Copyright
©The Author(s) 2000.
World J Gastroenterol. Jun 15, 2000; 6(3): 348-352
Published online Jun 15, 2000. doi: 10.3748/wjg.v6.i3.348
Published online Jun 15, 2000. doi: 10.3748/wjg.v6.i3.348
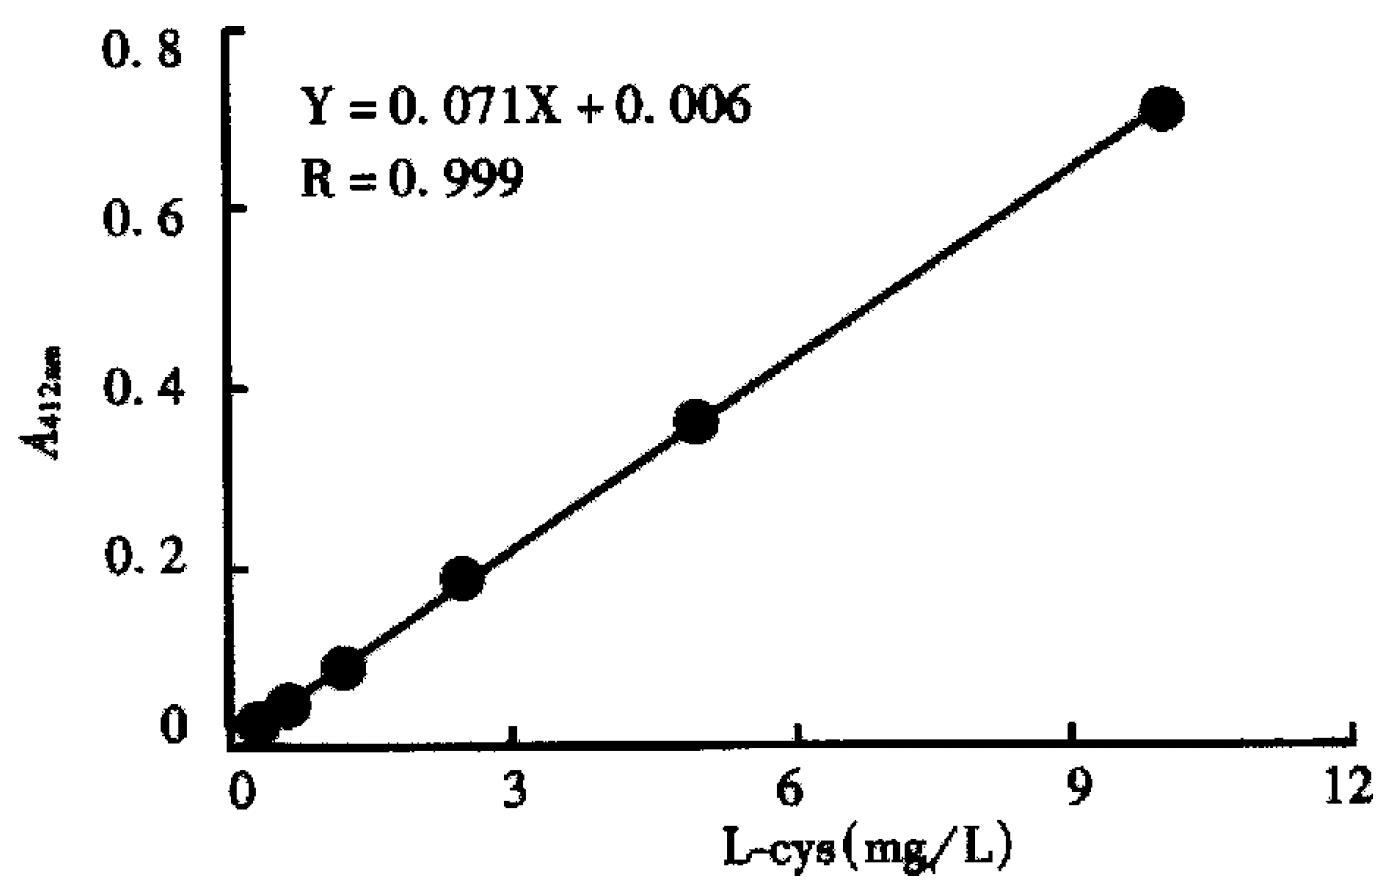
Figure 1 L-cysteine standard curve for sulphydryl d etermination using Ellman reaction.
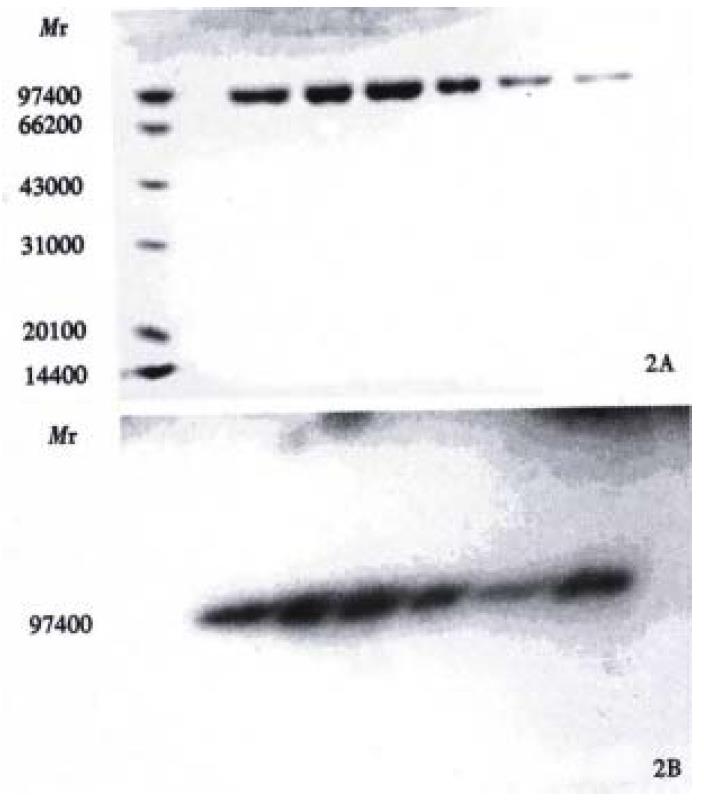
Figure 2 Effect of reduction on integrity of 99mTc-labeled HAb18 F(ab')2 as monitored by SDS-PAGE.
Vertical lanes re present molar ratios of Sn/GH to HAb18 F(ab')2: 1, 10:1; 2, 20:1; 3, 30: 1; 4, 40:1; 5, 50:1; 6, 60:1. (A)Coomassie brilliant blue R250 staining. Molecular weight (kD) is indicated at the left. (B) autoradiography.
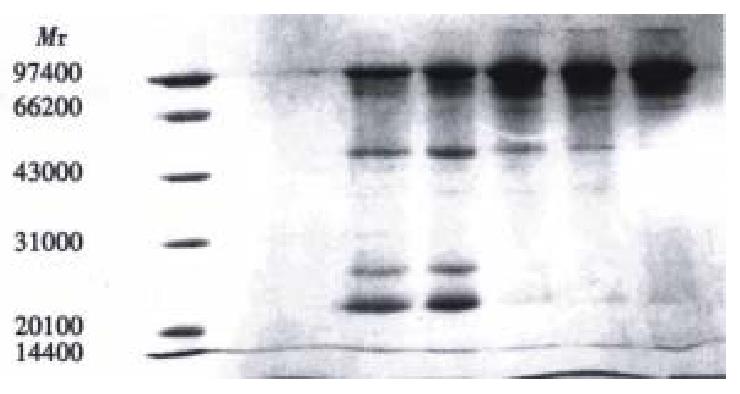
Figure 3 Effect of reduction on integrity of HAb18 F(ab')2 as monitored by SDS*PAGE.
Molecular weights (kD) are indicated at the left. Vertical lanes represent molar ratios of Sn/GH to HAb18 F(ab')2: 1, 1000:1; 2, 500:1; 3, 50:1; 4, 10:1; 5, unreduced F(ab')2.
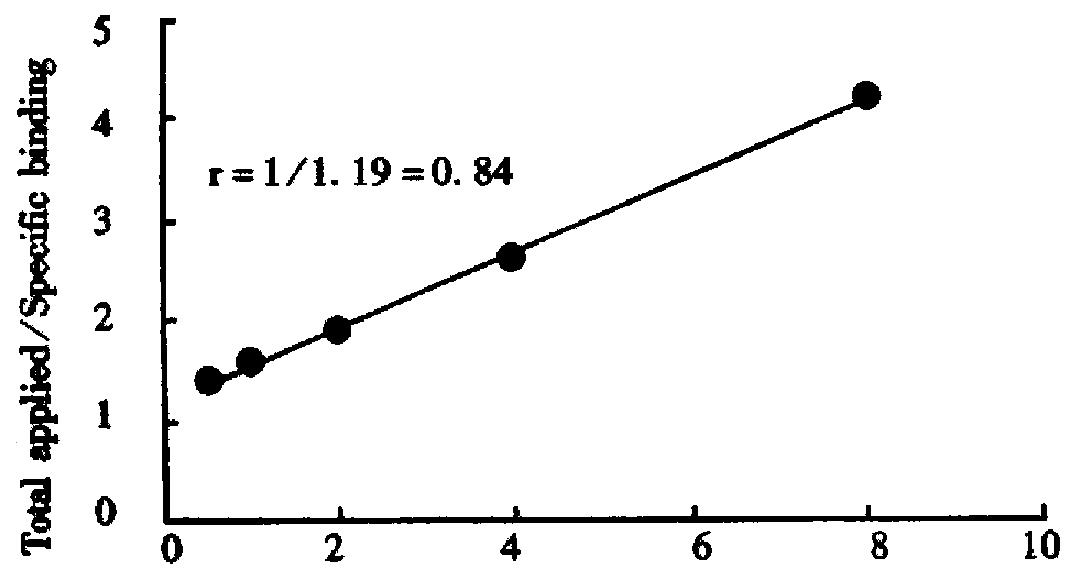
Figure 4 Binding assay for the determination of the immunoreactive fraction of 99mTc-labeled HAb18 F(ab')2.
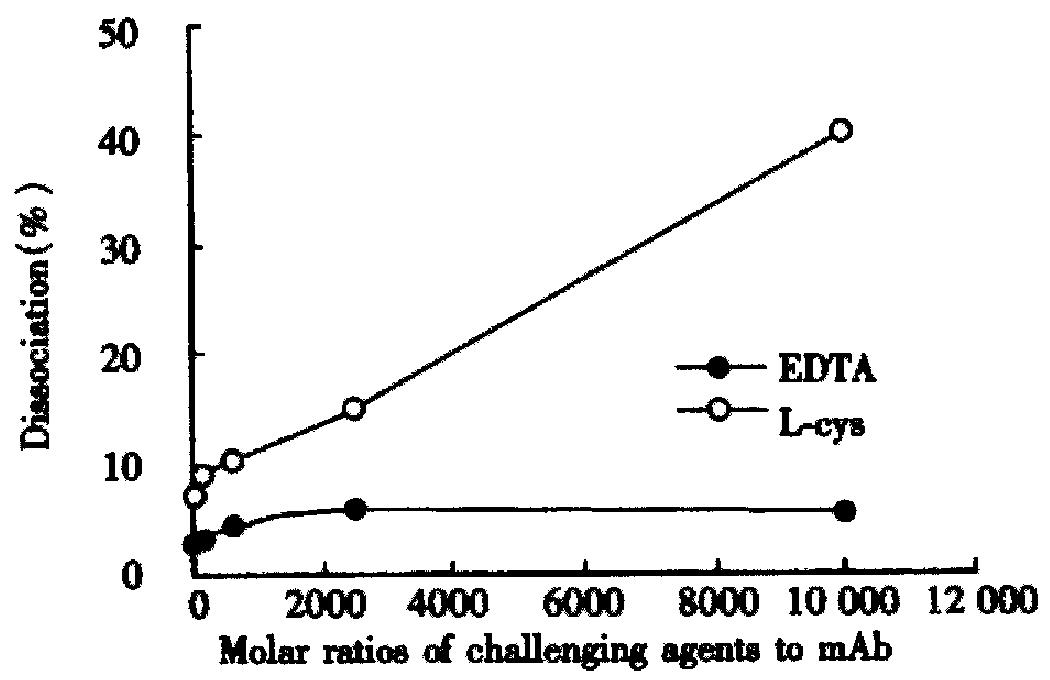
Figure 5 Dissociation of 99mTc-labeled HAb18 F(ab')2 with increasing molar ratio of EDTA to mAb (●) and L-cys to mAb (○).
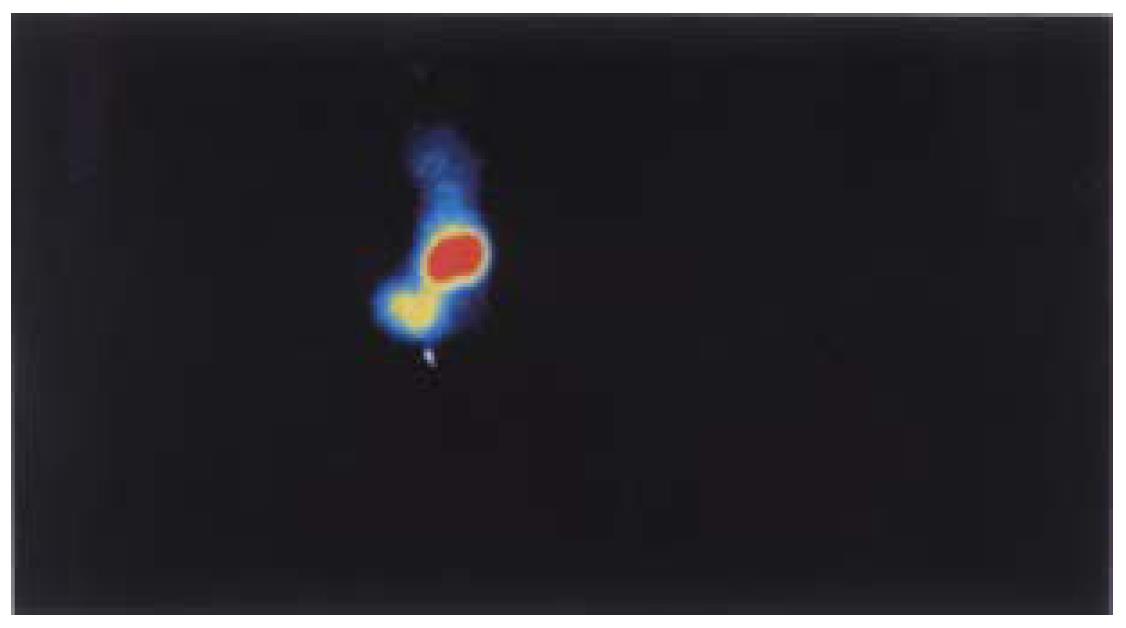
Figure 6 Images of nude mice bearing human hepatocel lular carcinoma with 99mTc-HAb18 F(ab')2 at 24 h.
- Citation: Bian HJ, Chen ZN, Deng JL. Direct technetium-99m labeling of anti-hepatoma monoclonal antibody fragment: a radioimmunoconjugate for hepatocellular carcinoma imaging. World J Gastroenterol 2000; 6(3): 348-352
- URL: https://www.wjgnet.com/1007-9327/full/v6/i3/348.htm
- DOI: https://dx.doi.org/10.3748/wjg.v6.i3.348


