Copyright
©The Author(s) 2000.
World J Gastroenterol. Jun 15, 2000; 6(3): 344-347
Published online Jun 15, 2000. doi: 10.3748/wjg.v6.i3.344
Published online Jun 15, 2000. doi: 10.3748/wjg.v6.i3.344
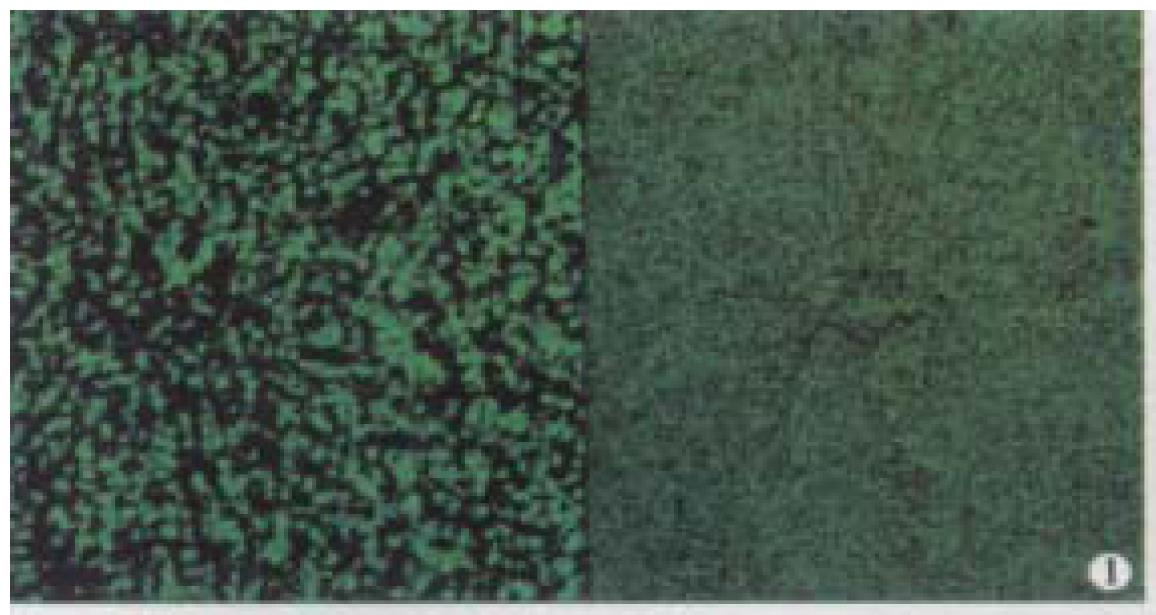
Figure 1 The transmission conventional light microscopic image was shown on the right side.
The out-of-focus blur reduced the contrast and sharpness of the image. In the confocal image (left) the out-of-focus signals were cut off and only signals in focus were clearly visible × 160
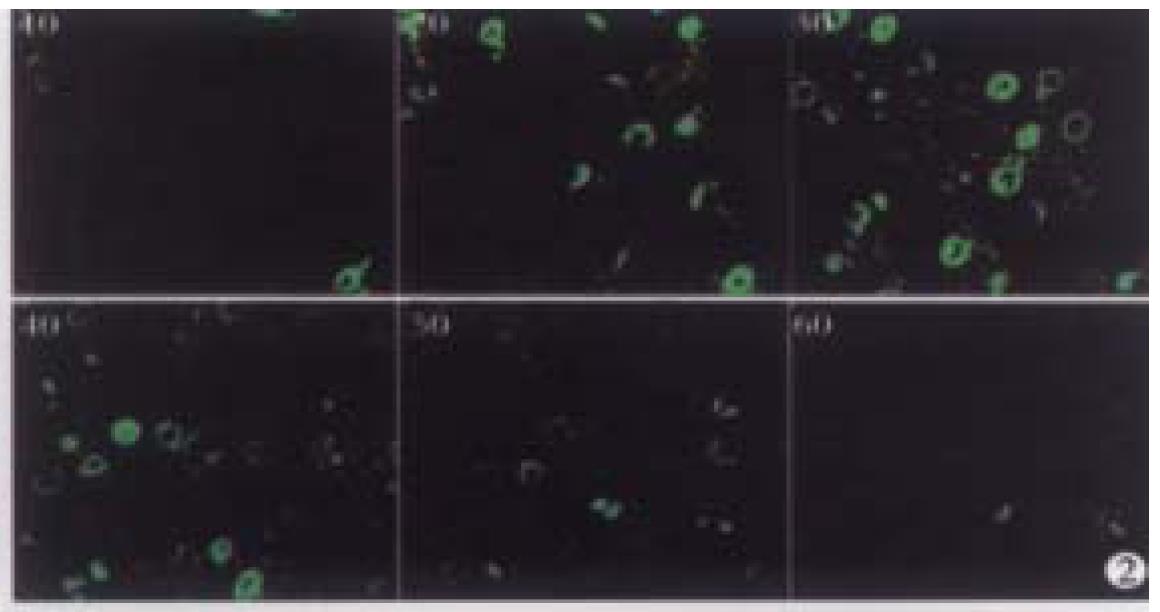
Figure 2 The 10th, 20th, 30th, 40th, 50th and 60th plane digital images of Z-series.
In the normal liver tissues of the confocal images some nuclei appeared or disappeared depending on their orientation in space. × 1000
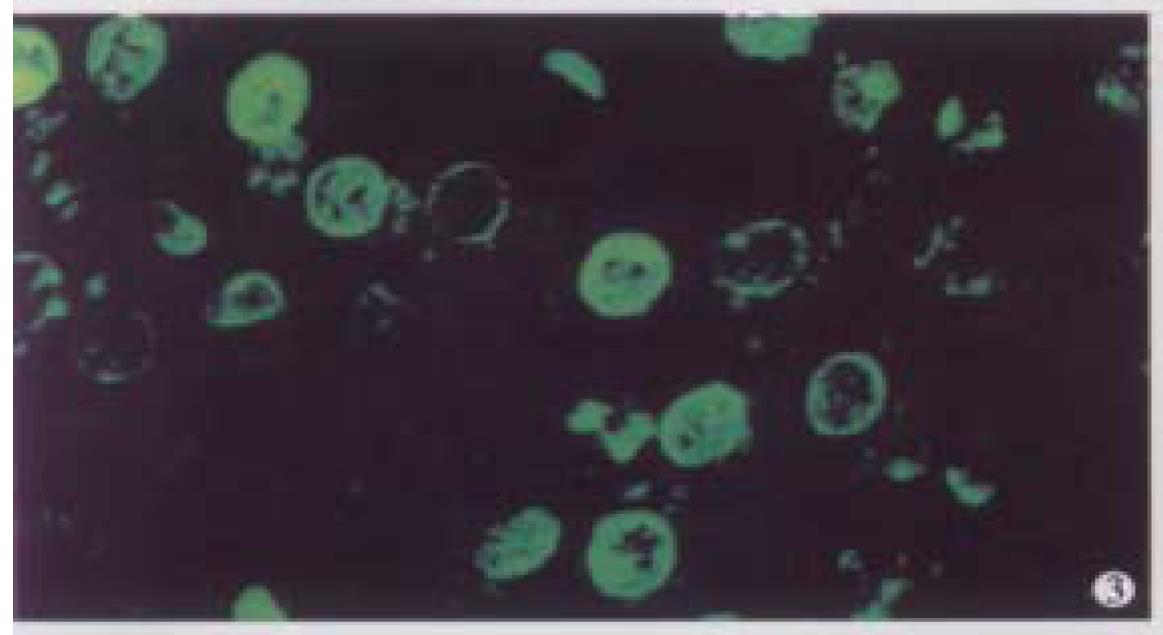
Figure 3 Deep-focusing image showed the normal live r cells with similar round or ovoid nuclei, similar in size and homogeneous intensity of YOYO-1 iodide fluorescence as well.
× 1000
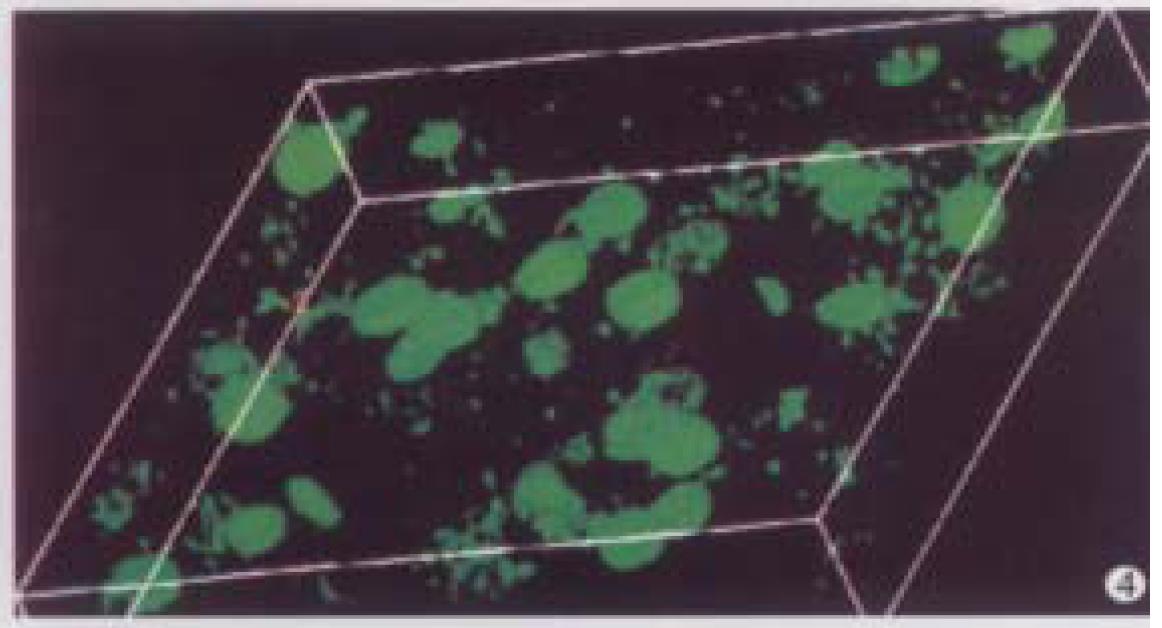
Figure 4 Three-dimensional view of normal liver cells, the nuclear surface appeared smooth with homogeneous fluorescence intensity.
× 1000
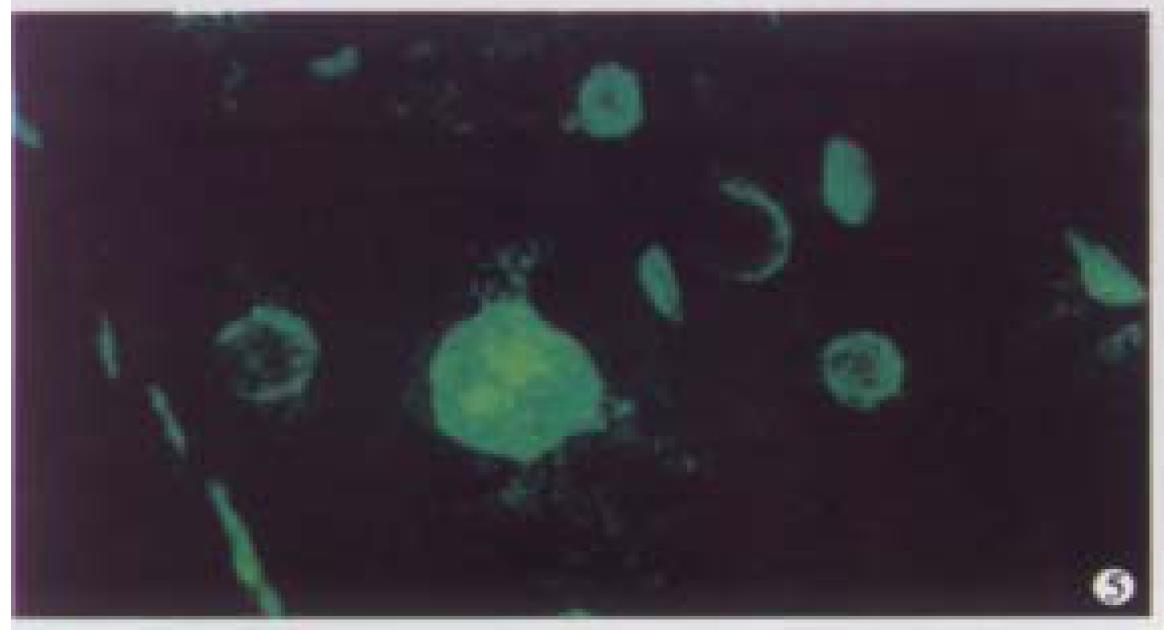
Figure 5 Deep-focusing image of atypical hyperplasi a liver cells, the structure of chromatin patterns inside the nucleus with homogeneous fluorescence intensity.
× 1000
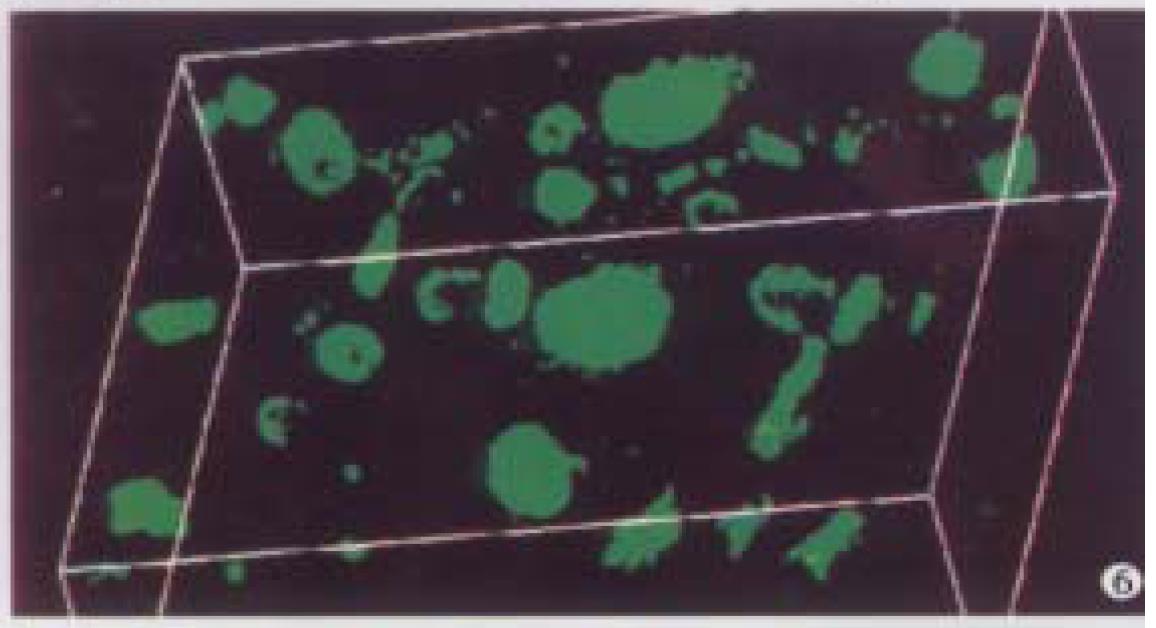
Figure 6 Three-dimensional view of atypical hyperplasia liver cells.
× 1000
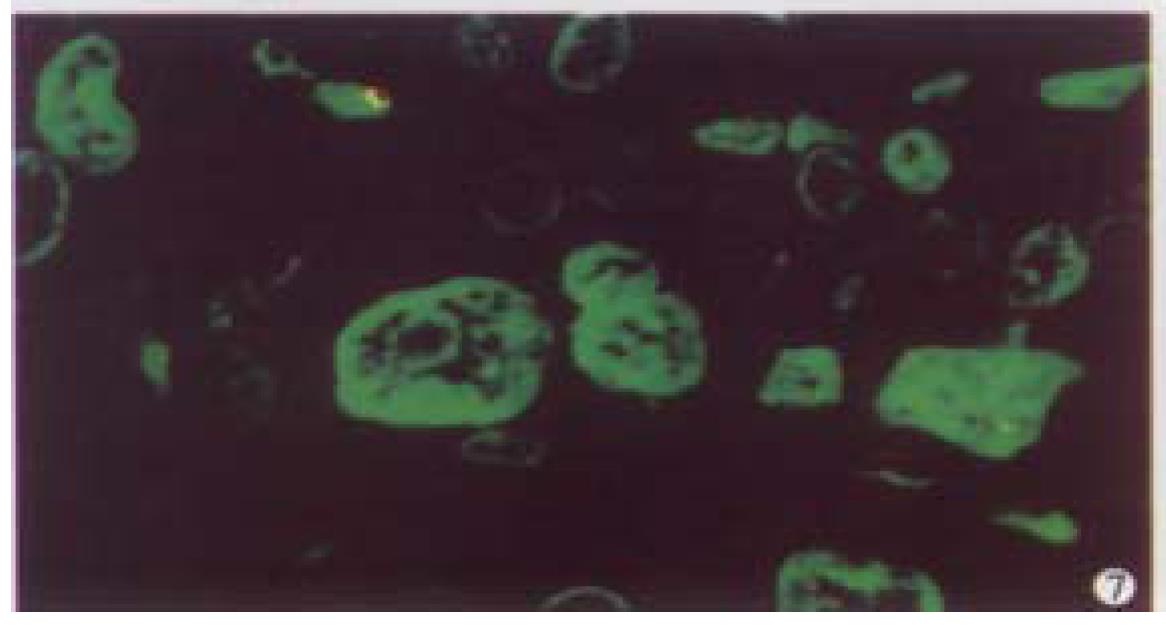
Figure 7 Deep-focusing image of HCC cells, the structure of chromatin patterns inside the nucleus with heterogeneous karyotheca thickness, irregular and coarse chromatin texture, chromatin underside the karyothecamainly.
× 1000
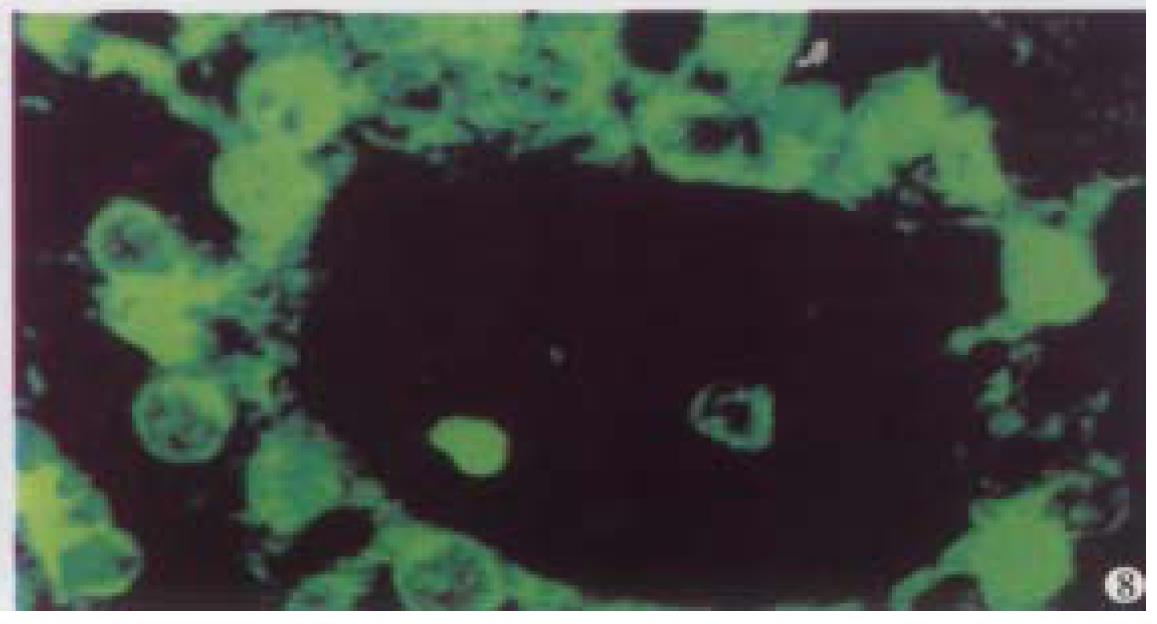
Figure 8 Deep-focusing image of highly differentiated HCC chromatin texture.
× 1000
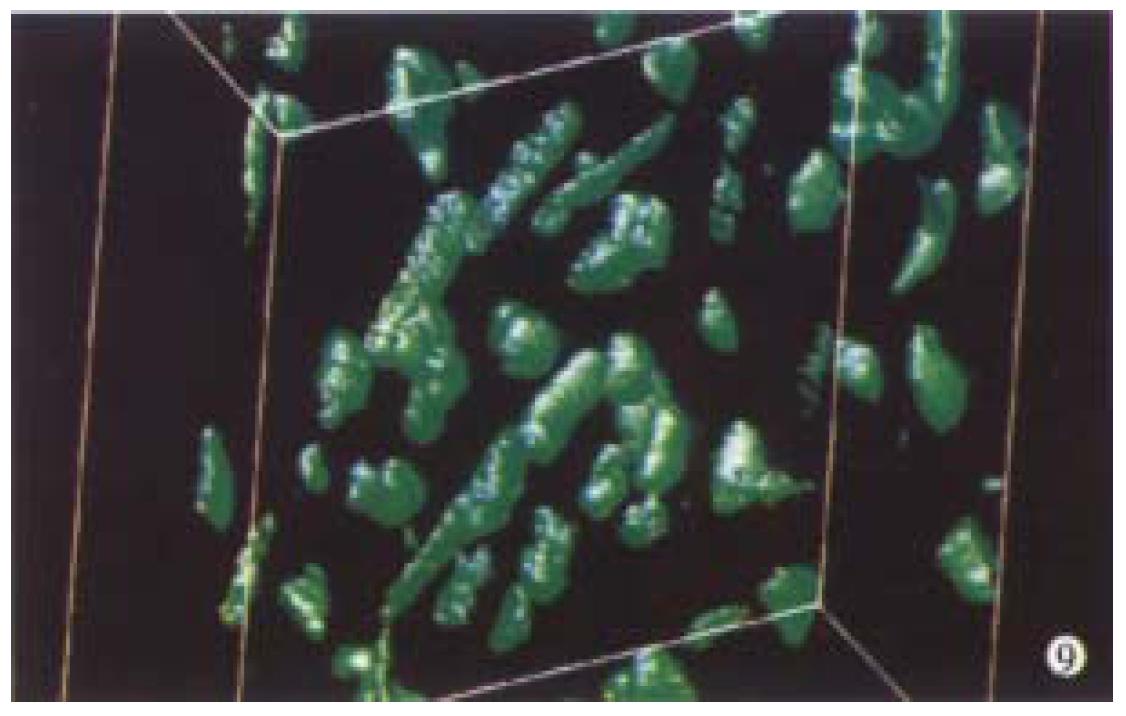
Figure 9 Three-dimensional view of spindle cell HCC.
× 1000
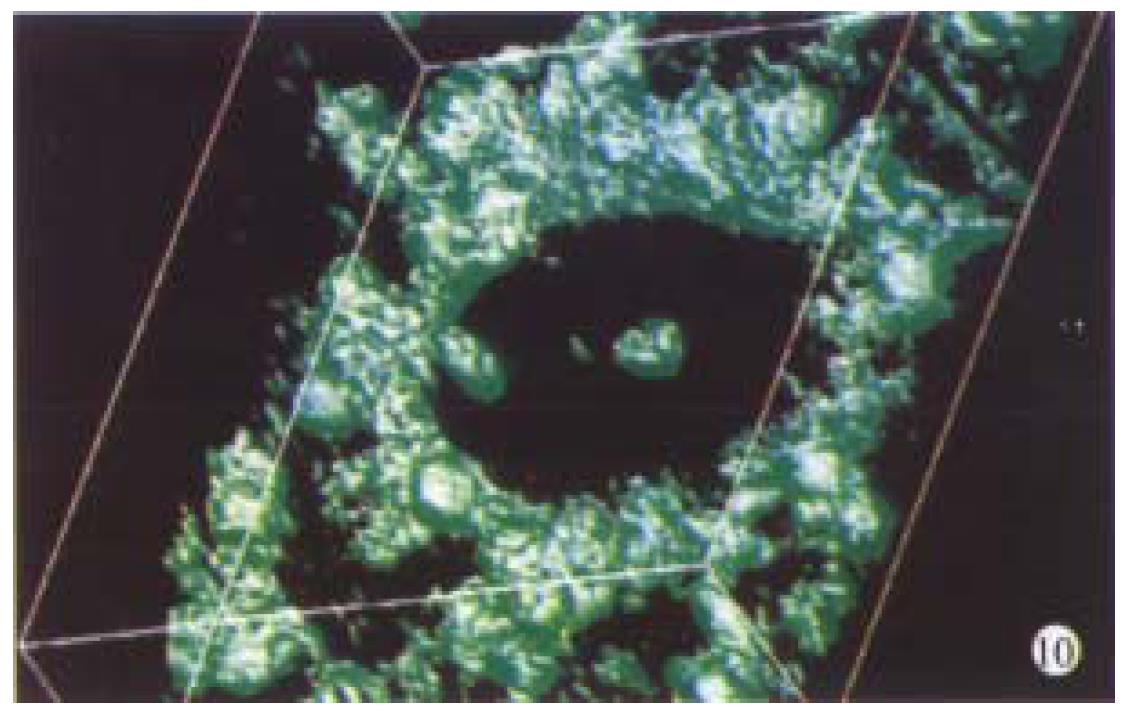
Figure 10 Three-dimensional view of tubular adenocarcinoma of HCC.
× 1000
- Citation: Zhang WH, Zhu SN, Lu SL, Huang YL, Zhao P. Three-dimensional image of hepatocellular carcinoma under confocal laser scanning microscope. World J Gastroenterol 2000; 6(3): 344-347
- URL: https://www.wjgnet.com/1007-9327/full/v6/i3/344.htm
- DOI: https://dx.doi.org/10.3748/wjg.v6.i3.344


