Copyright
©The Author(s) 2000.
World J Gastroenterol. Jun 15, 2000; 6(3): 339-343
Published online Jun 15, 2000. doi: 10.3748/wjg.v6.i3.339
Published online Jun 15, 2000. doi: 10.3748/wjg.v6.i3.339
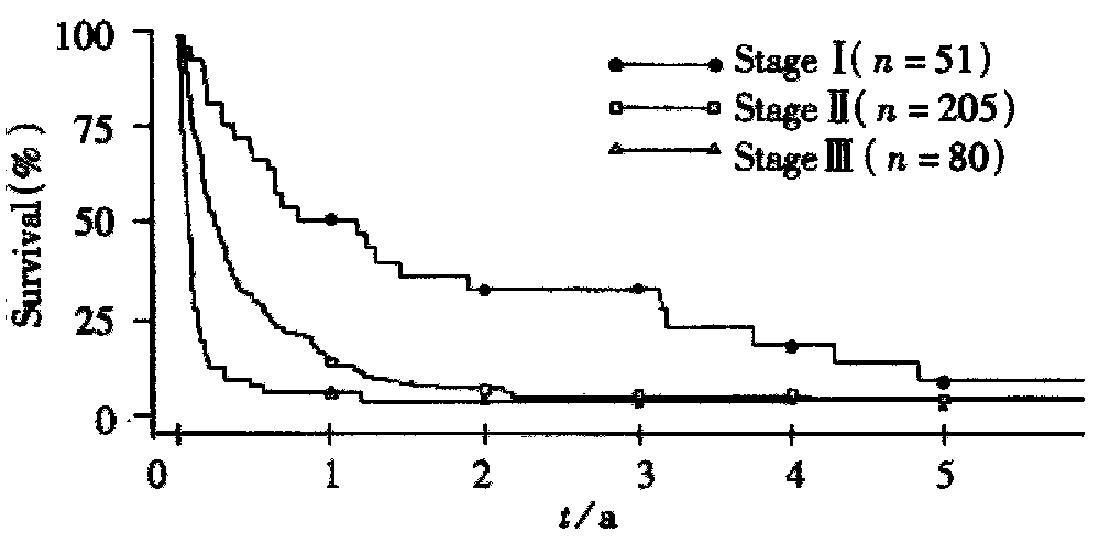
Figure 1 Kaplan-Meier survival curve for overall patients.
Total (n = 336) median survival of 2.1 months: Okuda's stage I (n = 51), median survival of 11.5 months; Okuda's stage II (n = 205), median survival of 2.6 months; Okuda's stage III (n = 80), median survival of 0.7 months (P = 0.014 and 0.001 respectively).
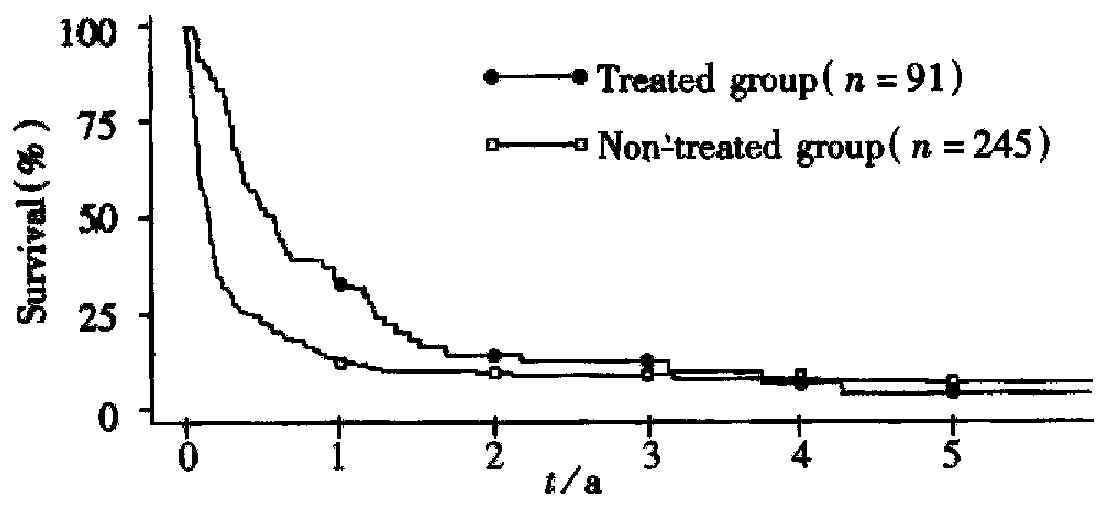
Figure 2 Kaplan-Meier survival curve in relation to treatment or non-treatment.
Treated group (n = 91), median survival of 5.5 months; non-treated group (n = 245), median survival of 1.6 months (P = 0.011).
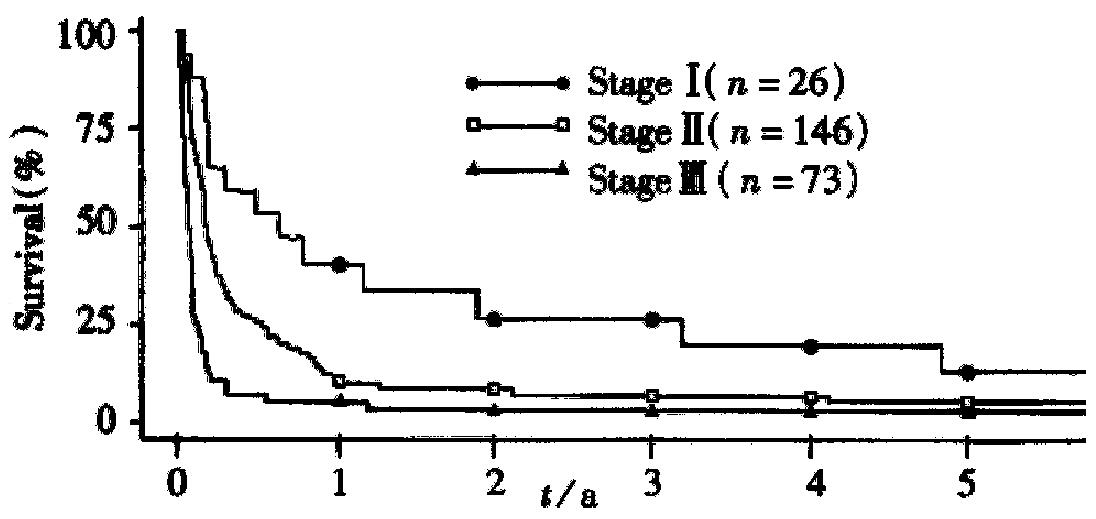
Figure 3 Kaplan-Meier survival curve in non-treated group.
Total (n = 245), median survival of 1.6 months, Okuda's stage I (n = 26), median survival of 7.7 months; Okuda's stage II (n = 146), median survival of 1.8 months; Okuda's stage III (n = 73), median survival of 0.6 months.
- Citation: Sithinamsuwan P, Piratvisuth T, Tanomkiat W, Apakupakul N, Tongyoo S. Review of 336 patients with hepatocellular carcinoma at Songklanagarind Hospital. World J Gastroenterol 2000; 6(3): 339-343
- URL: https://www.wjgnet.com/1007-9327/full/v6/i3/339.htm
- DOI: https://dx.doi.org/10.3748/wjg.v6.i3.339


