Copyright
©The Author(s) 2000.
World J Gastroenterol. Feb 15, 2000; 6(1): 61-65
Published online Feb 15, 2000. doi: 10.3748/wjg.v6.i1.61
Published online Feb 15, 2000. doi: 10.3748/wjg.v6.i1.61
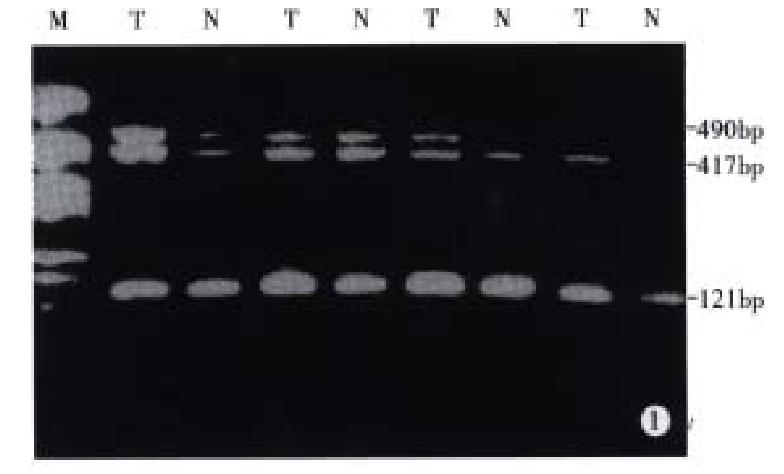
Figure 1 Electrophoresis analysis of RT-PCR product samplified from cDNA obtained from HCC and nontumorous liver tissues.
M, DNA m arker (PGEM-7ZF(+)/Hae-III); T, tumor; N, nontumorous liver tissues. The positive bands of 417 bp, 490 bp, and 121 bp represent VEGF165, VEGF189, and β2-MG, respectively.
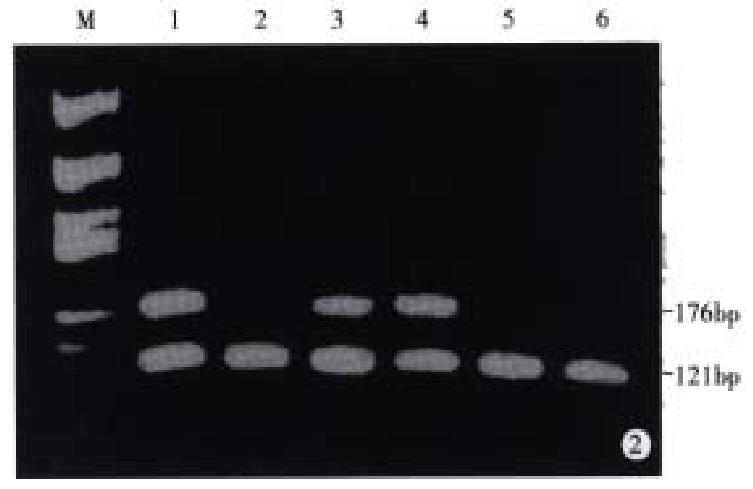
Figure 2 Electrophoresis analysis of RT-PCR product s from cDNA obtained from peripheral venous blood of patients with HCC.
M, DNA marker (PGEM-7ZF(+)/Hae-III). Lane 1, lane 3, and lane 4 showed positive bands for AFP (176 bp). All lanes showed positive bands for β2-MG (121 bp).
- Citation: Jiang YF, Yang ZH, Hu JQ. Recurrence or metastasis of HCC: predictors, early detection and experimental antiangiogenic therapy. World J Gastroenterol 2000; 6(1): 61-65
- URL: https://www.wjgnet.com/1007-9327/full/v6/i1/61.htm
- DOI: https://dx.doi.org/10.3748/wjg.v6.i1.61


