Copyright
©The Author(s) 2000.
World J Gastroenterol. Feb 15, 2000; 6(1): 1-11
Published online Feb 15, 2000. doi: 10.3748/wjg.v6.i1.1
Published online Feb 15, 2000. doi: 10.3748/wjg.v6.i1.1
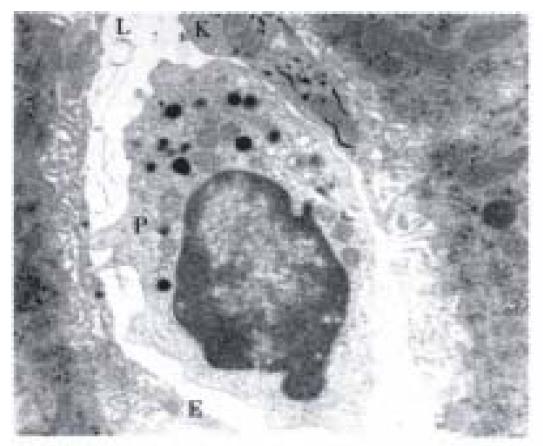
Figure 1 Transmission electron micrograph of a pit cell in a rat hepatic sinusoidal lumen (L).
The pit cell shows polarity with an eccentric nucleus. The cytoplasm is abundant and contains characteristic electr on-dense granules and other organelles lying mainly on one side of the nucleus. The cell contacts an endothelial cell (E) and a portion of a Kupffer cell (K) with a positive peroxidase reaction product in the rough endoplasmic reticulum. Bar = 1 μm. (from Hepatology,1988; 8: 46-52, with permission)
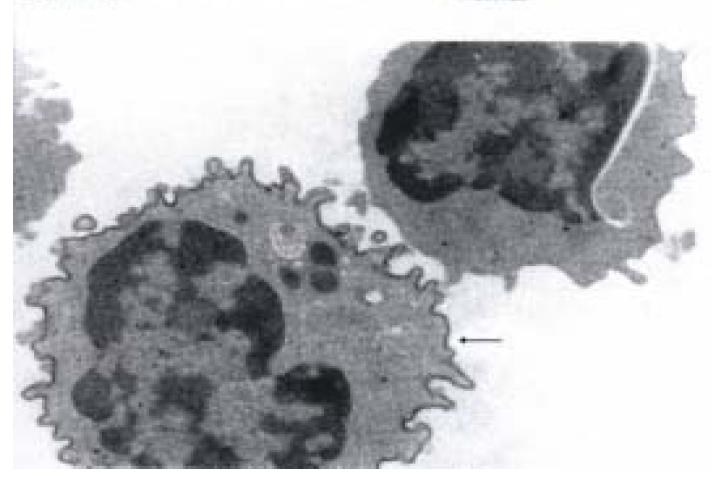
Figure 2 Immuno-transmission electron micrograph showing a 3.
2.3 positive LGL (pit cell) (arrowhead) and a 3.2.3 negative agranular cell. The 3.2.3+ pit cell shows characteristic electron-dense granules in the cyt oplasm and immunoperoxidase reaction product on the surface. Bar = 1 μm.(from Hepatology, 1995; 21: 1690-1694, with permission)
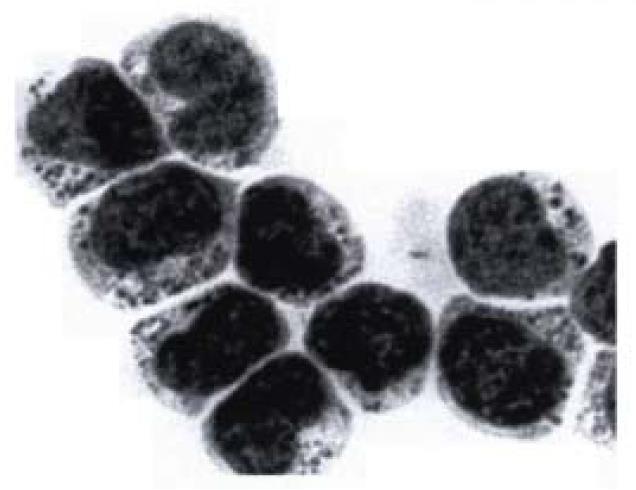
Figure 3 Light micrograph of an isolated and purified pit cell population in a May-Grünwald-Giemsa-stained cytospin.
The cells contain cytoplasmic granules, which can be used to recognize and count the number of pit cells in freshly isolated liver-associated lymphocyte population. Bar = 5 μm.
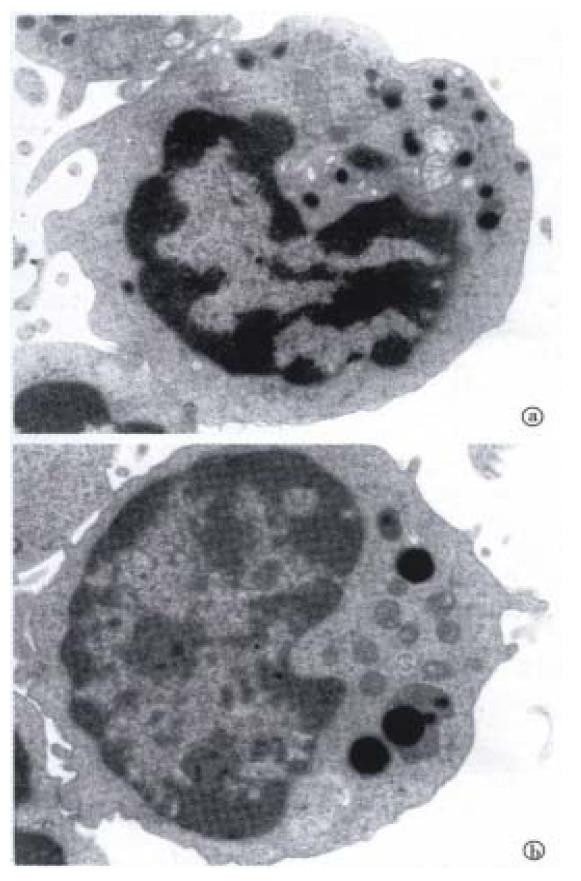
Figure 4 Transmission electron micrographs of a typical LD pit cell and a blood NK cell (B).
(A) The main morphological characteristic of LD pit cells, compared to HD cells and blood NK cells, is the presence of numerous small cytoplasmic granules. (B) Note the few, but large granules in blood NK cell. Bar = 1 μm. (from Hepatology, 1990; 12: 70-75, with permission)
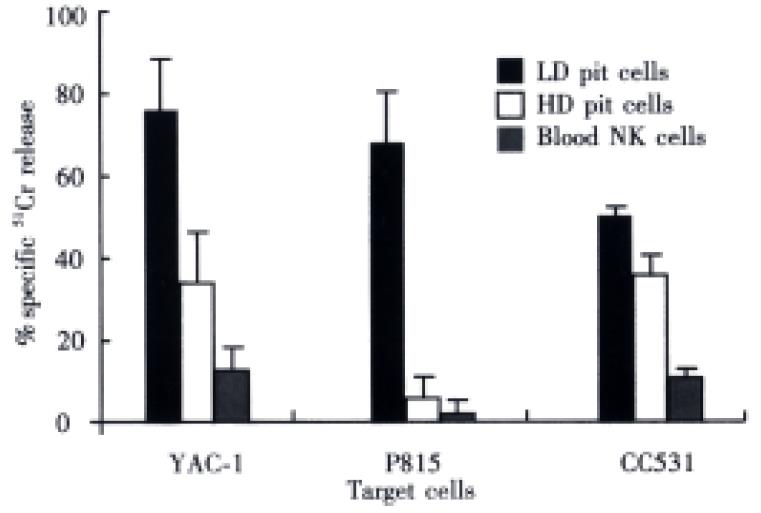
Figure 5 Comparison of cytolysis between rat blood N K, HD and LD pit cells.
The ratio of freshly isolated effector cells to target cells was 20:1.The cytolysis was measured in a 4 h 51Cr-rele ase assay for YAC-1and P815 cells and a 16 h 51Cr-release assay for CC531s cells. The data show that LD pit cells are more cytotoxic against YA C-1, P815 and CC531s than HD cells and blood NK cells. Values were means ± SD of three to five independent experiments. (Hepatology,1990; 12: 70-75, with permission)
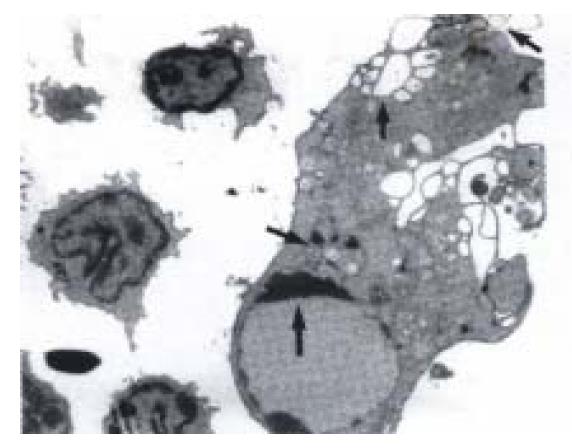
Figure 6 Transmission electron micrograph of an apoptotic CC531s cell (T) coincubated with pit cells (E) for 3 h.
The apoptotic CC531s cell (T) shows vacuolization (large arrowhead), blebbing of the cell surface (small arrowhead), chromatin condensation (thin arrow), and fragmentation of the nucleus (thick arrow). Bar: 2μm. (Hepatology,1999; 29: 51-56, with permission)
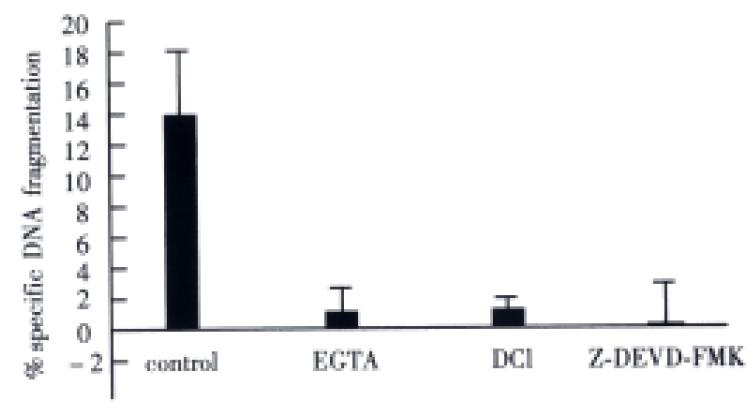
Figure 7 The involvement of the perforin/granzyme pathway in pit cell-induced CC531s apoptosis.
The ratio of freshly isolated pit cells to CC531s cells was 10:1. Apoptosis was measured in a 3 h DNA-fr agmentation assay. EGTA is a Ca2+ chelator that blocks granule exocytosis and the action of perforin. DCI is a granzyme inhibitor. Z-DEVD-FMK is a inhibitor of caspase 3. These treatments completely inhibit pit cell-induced CC531s apoptosis. Values were mean ± SD of three independent experiments. (Hepatology, 1999; 29: 51-56, with permission)
- Citation: Luo DZ, Vermijlen D, Ahishali B, Triantis V, Plakoutsi G, Braet F, Vanderkerken K, Wisse E. On the cell biology of pit cells, the liver-specific NK cells. World J Gastroenterol 2000; 6(1): 1-11
- URL: https://www.wjgnet.com/1007-9327/full/v6/i1/1.htm
- DOI: https://dx.doi.org/10.3748/wjg.v6.i1.1


