Copyright
©The Author(s) 1999.
World J Gastroenterol. Jun 15, 1999; 5(3): 235-240
Published online Jun 15, 1999. doi: 10.3748/wjg.v5.i3.235
Published online Jun 15, 1999. doi: 10.3748/wjg.v5.i3.235
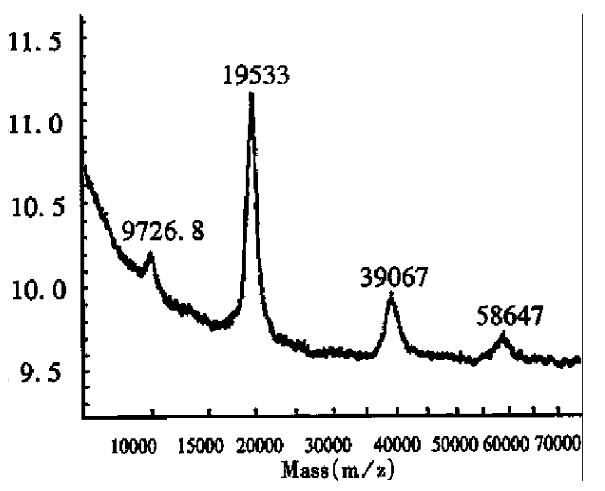
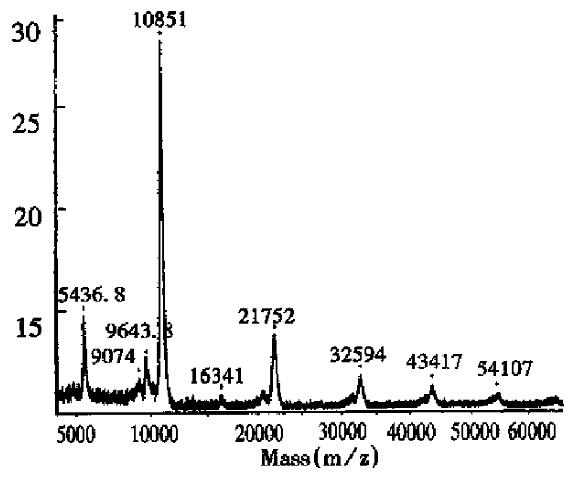
Figure 1 MALDI-TOF mass spectrum of interferon α2b using sinapinic acid as matrix.
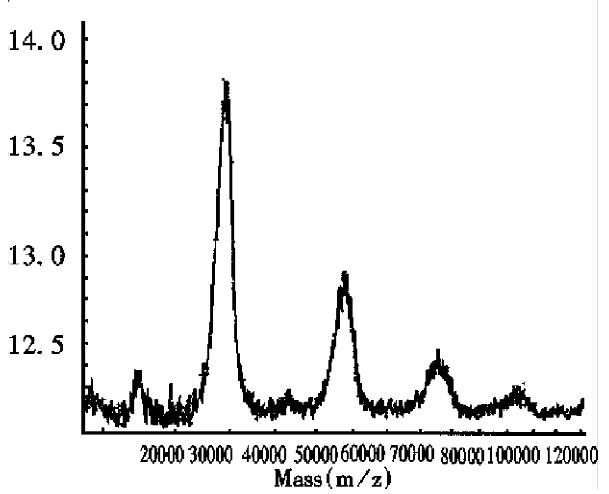
Figure 2 MALDI-TOF mass spectrum of recombinant human erythropoietin using sinapinic acid as matrix.
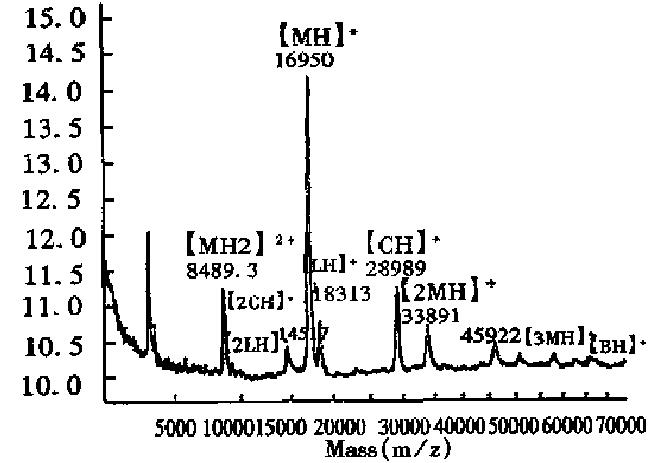
Figure 3 MALDI-TOF mass spectrum of mixtures containing calmodulin using sinapinic acid as matrix.
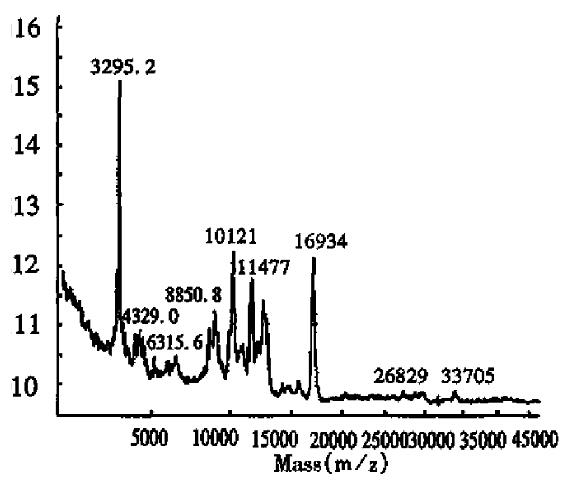
Figure 4 MALDI-T OF mass spectrum of calmodulin fragment using sinapinic acid as matrix.
Figure 5 MALDI-TOF mass spectrum of standard protein mixtures using sinapinic acid as matrix.
M: Myoglobin; C: Carbonic anhydrase B ; L: β-lactoglobulin; B: Bovine serum albumin.
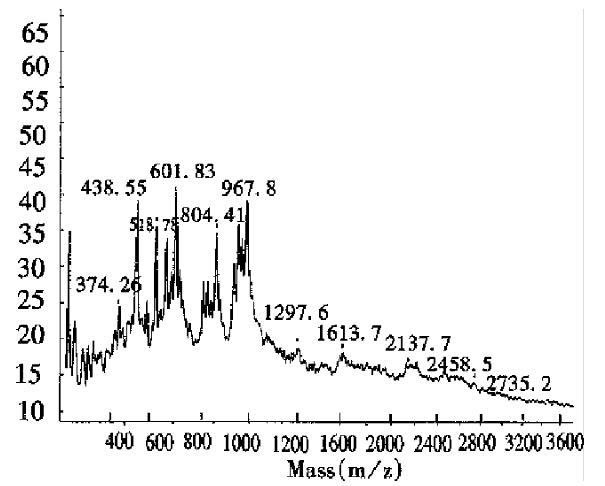
Figure 6 MALDI-TOF mass spectrum of tryptic digests of recombinant human erythropoietin using 100 mM DHB as matrix.
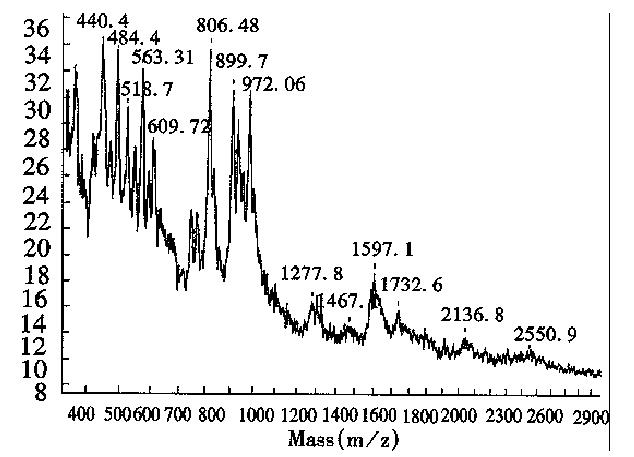
Figure 7 MALDI-TOF mass spectrum of tryptic digests of recombinant human erythropoietin using 2-Aminobenzoic acid as matrix.
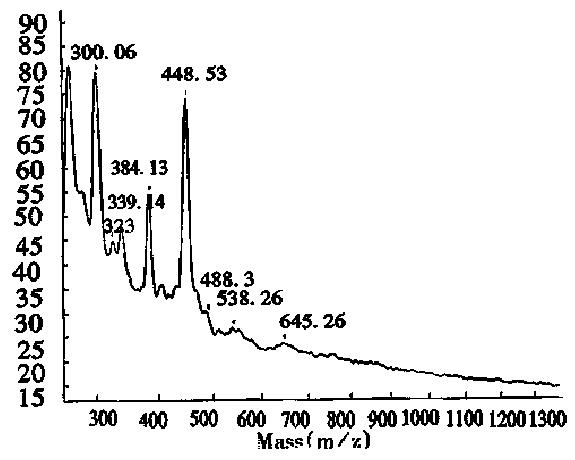
Figure 8 MALDI-TOF mass spectrum of tryptic digests of recombinant human erythropoietin using α-cyano-4-hydroxycinnamic acid as matrix.
- Citation: Zhou GH, Luo GA, Sun GQ, Cao YC, Zhu MS. Study on the quality of recombinant proteins using matrix-assisted laser desorption ionization time of flight mass spectrometry. World J Gastroenterol 1999; 5(3): 235-240
- URL: https://www.wjgnet.com/1007-9327/full/v5/i3/235.htm
- DOI: https://dx.doi.org/10.3748/wjg.v5.i3.235


