Copyright
©The Author(s) 1998.
World J Gastroenterol. Oct 15, 1998; 4(5): 434-436
Published online Oct 15, 1998. doi: 10.3748/wjg.v4.i5.434
Published online Oct 15, 1998. doi: 10.3748/wjg.v4.i5.434
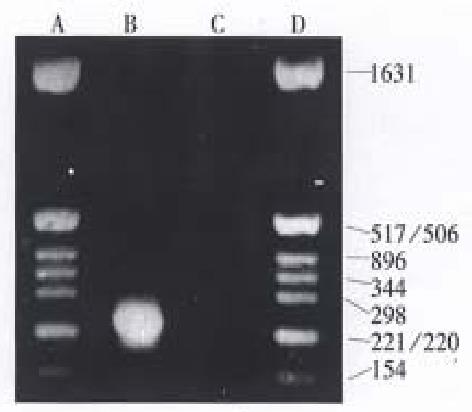
Figure 1 Amplification of HBV DNA in the 2.
2.15 cells with PCR. The PCR products were resolved on 1.5% agarose gel. A and D: Marker (PBR322/Hinf I ); B: HBV DNA in cells; C: HBV DNA (adr sutype)
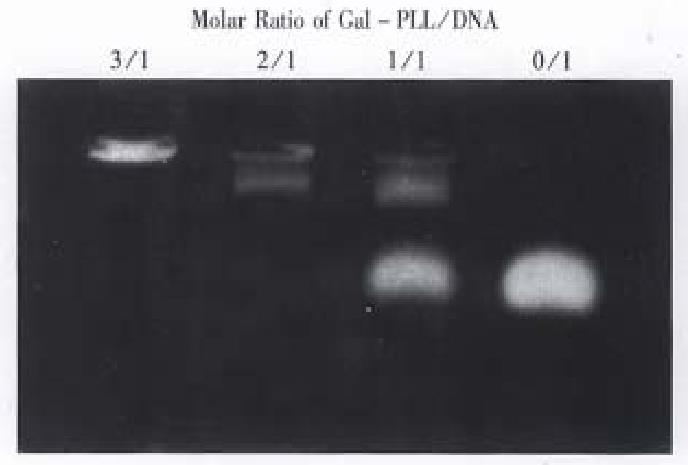
Figure 2 Agarose gel electrophoresis analysis of complex formation.
DNA: Gal-PLL complex was made with increasing molar ratios of Gal-PLL to DNA; 0/1 represents DNA only. DNA was visualized with ethidium bromide.
- Citation: Zhong S, Wen SM, Zhang DF, Wang QL, Wang SQ, Ren H. Sequencing of PCR amplified HBV DNA pre-c and c regions in the 2.2.15 cells and antiviral action by targeted antisense oligonucleotide directed against sequence. World J Gastroenterol 1998; 4(5): 434-436
- URL: https://www.wjgnet.com/1007-9327/full/v4/i5/434.htm
- DOI: https://dx.doi.org/10.3748/wjg.v4.i5.434


