Copyright
©The Author(s) 2025.
World J Gastroenterol. Mar 7, 2025; 31(9): 98027
Published online Mar 7, 2025. doi: 10.3748/wjg.v31.i9.98027
Published online Mar 7, 2025. doi: 10.3748/wjg.v31.i9.98027
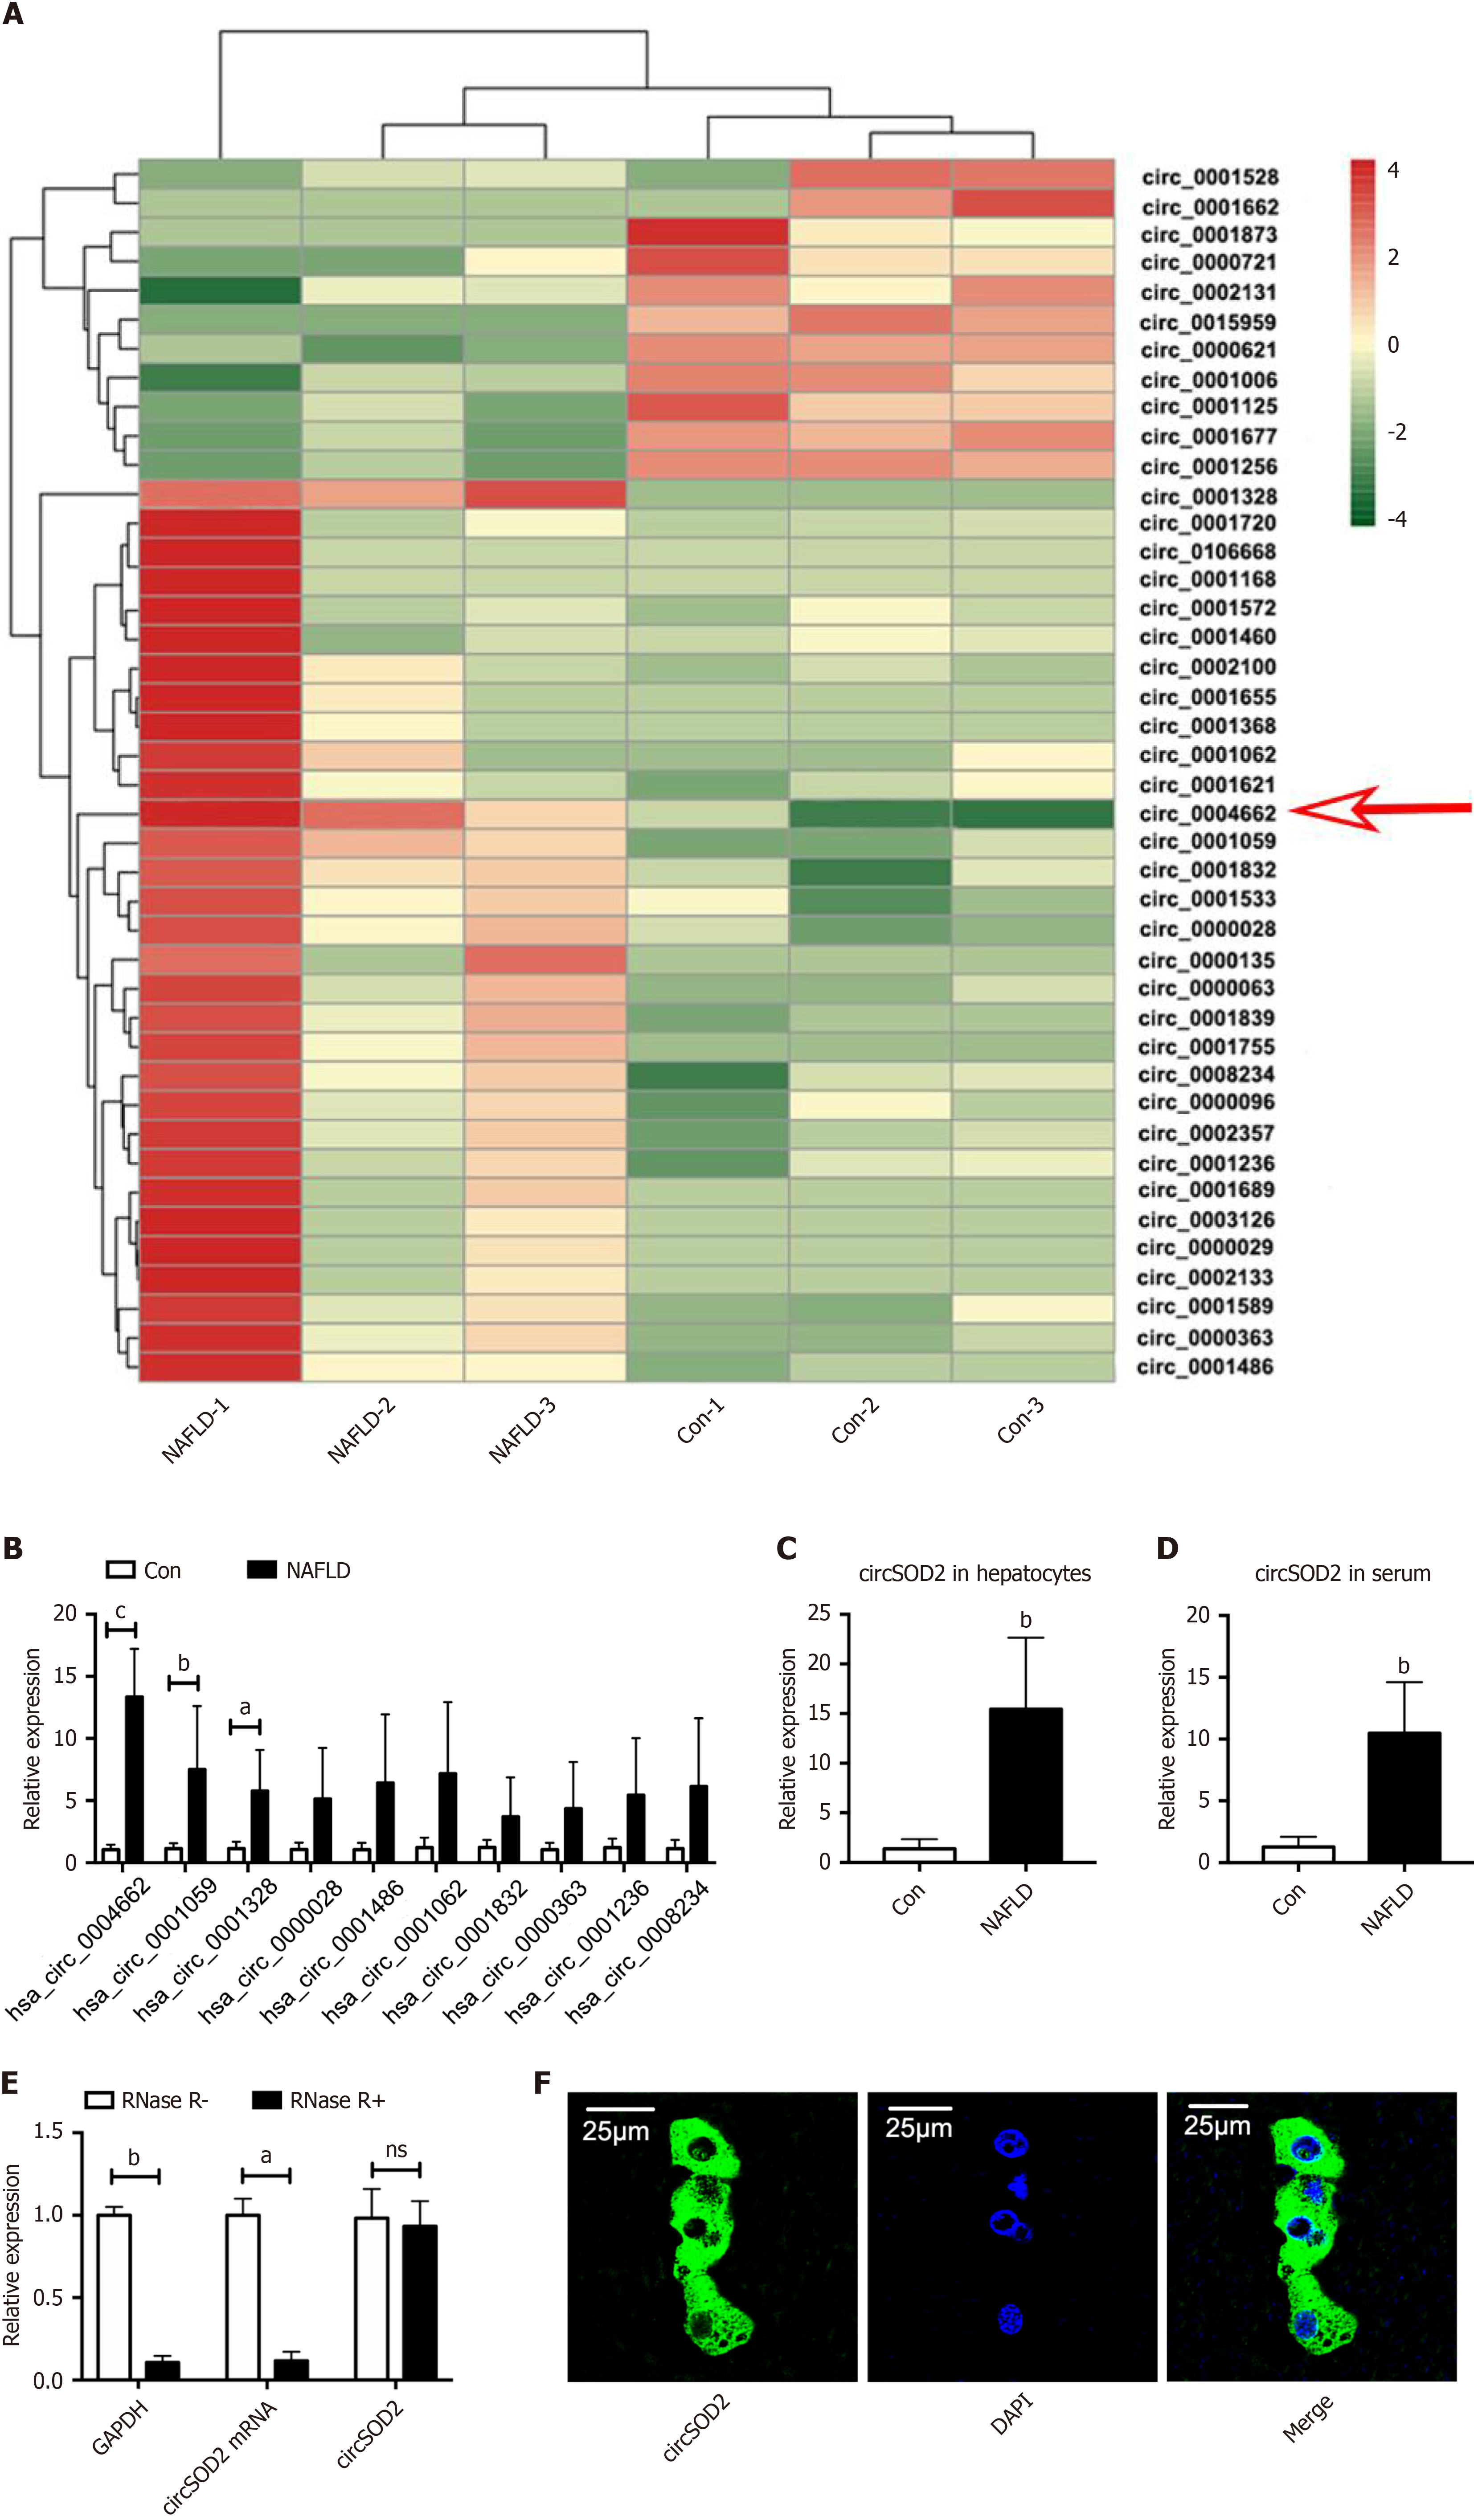
Figure 1 circSOD2 is upregulated in metabolic-associated fatty liver disease.
A: Heat map depicting differentially expressed circRNAs in the liver from three clinical subjects with metabolic-associated fatty liver disease (MAFLD) and three control subjects after RNA sequencing; B: Validation of the top 10 upregulated circRNAs in MAFLD livers, including circSOD2 (hsa_circ_0004662), confirmed using quantitative real-time reverse transcription polymerase chain reaction (n = 5); C and D: CircSOD2 was highly expressed in primary hepatocytes and serum subjects with MAFLD (n = 5); E: RNase R digestion assay showing that circSOD2 was more resistant to degradation by RNase R; F: Fluorescence in situ hybridization assay showing that circSOD2 was predominantly located in the cytoplasm. aP < 0.05; bP < 0.01; cP < 0.001; NS: Not significant; Con: Control; NAFLD: Nonalcoholic fatty liver disease.
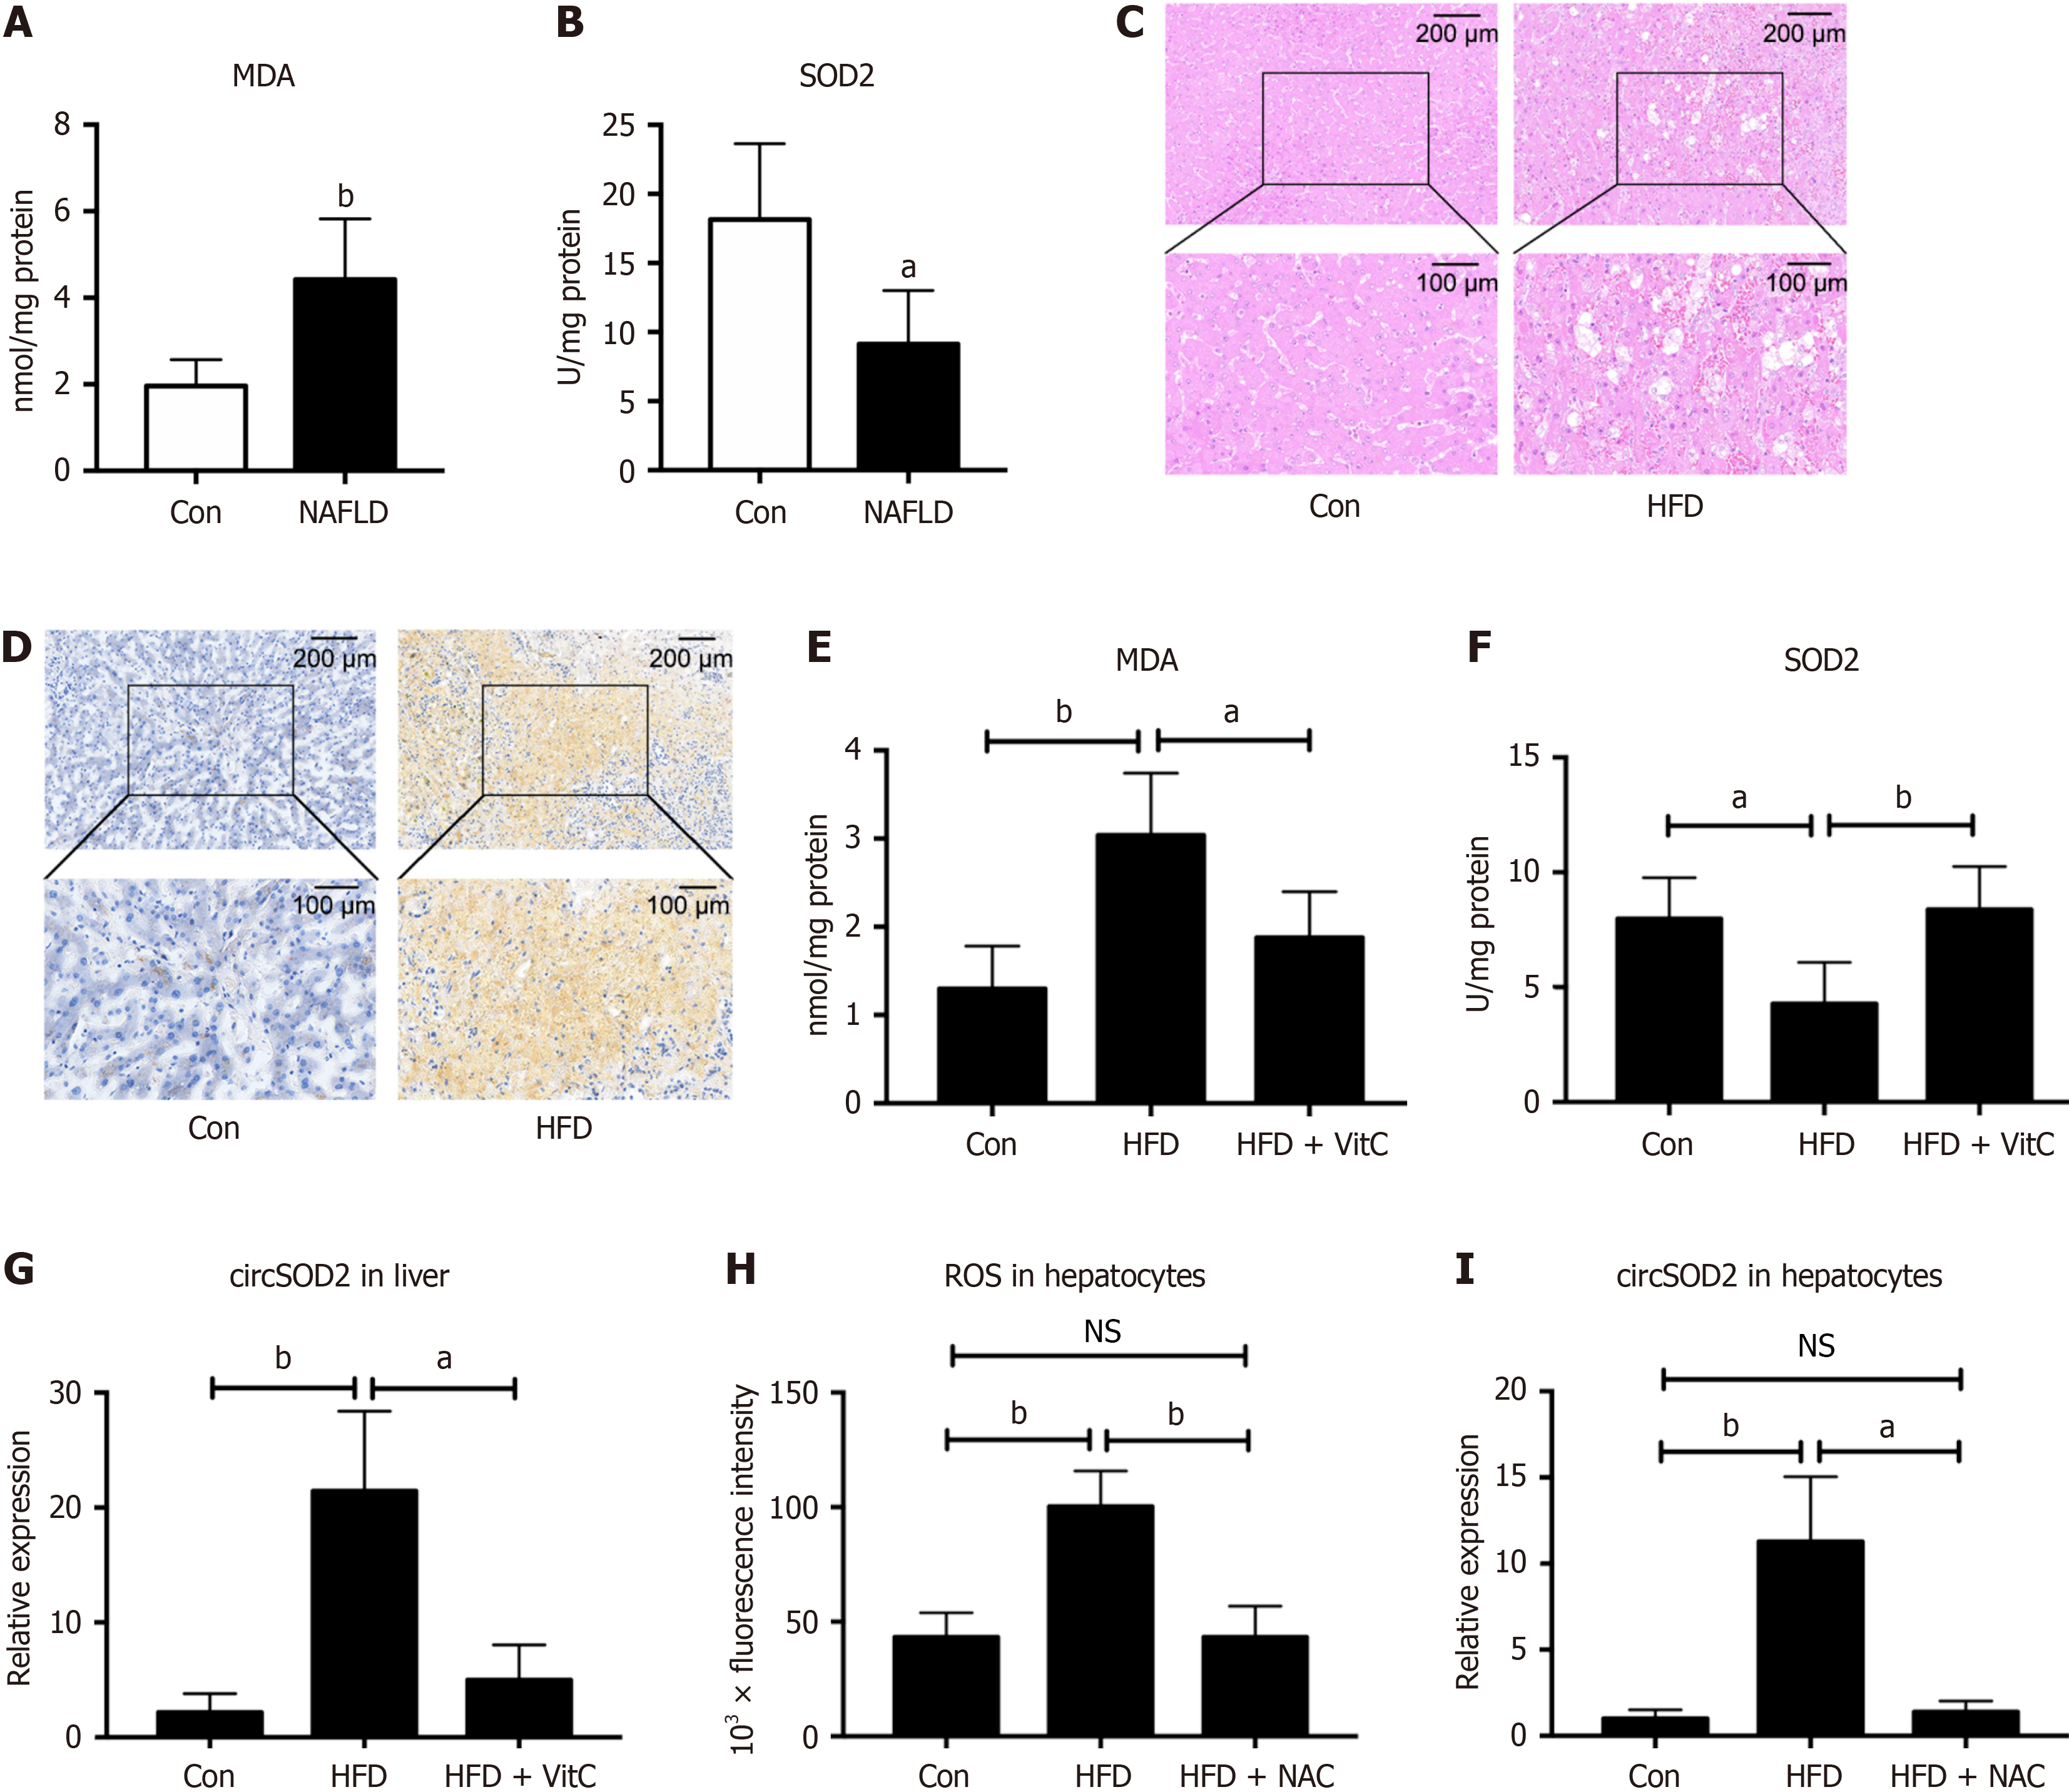
Figure 2 circSOD2 is induced by oxidative stress.
A and B: Levels of malondialdehyde (MDA), a lipid peroxidation metabolite, and antioxidant SOD2 in livers of metabolic-associated fatty liver disease (MAFLD) and control subjects (n = 5); C and D: Representative hematoxylin & eosin and Oil red O staining images confirm the successful establishment of a high-fat diet (HFD) mice model to simulate MAFLD; normal diet mice served as negative control (Con); E-G: MDA, SOD2, and circSOD2 Levels in the livers of Con, HFD, and HFD supplemented with Vitamin C groups (n = 5); H and I: Reactive oxygen species and circSOD2 Levels in primary hepatocytes from Con, HFD, and HFD were pretreated with N-acetyl L-cysteine groups (n = 5). aP < 0.05; bP < 0.01; NS: Not significant; Con: Control; NAFLD: Nonalcoholic fatty liver disease; MDA: Malondialdehyde; HFD: High-fat diet; VitC: Vitamin C; NAC: N-acetyl L-cysteine.
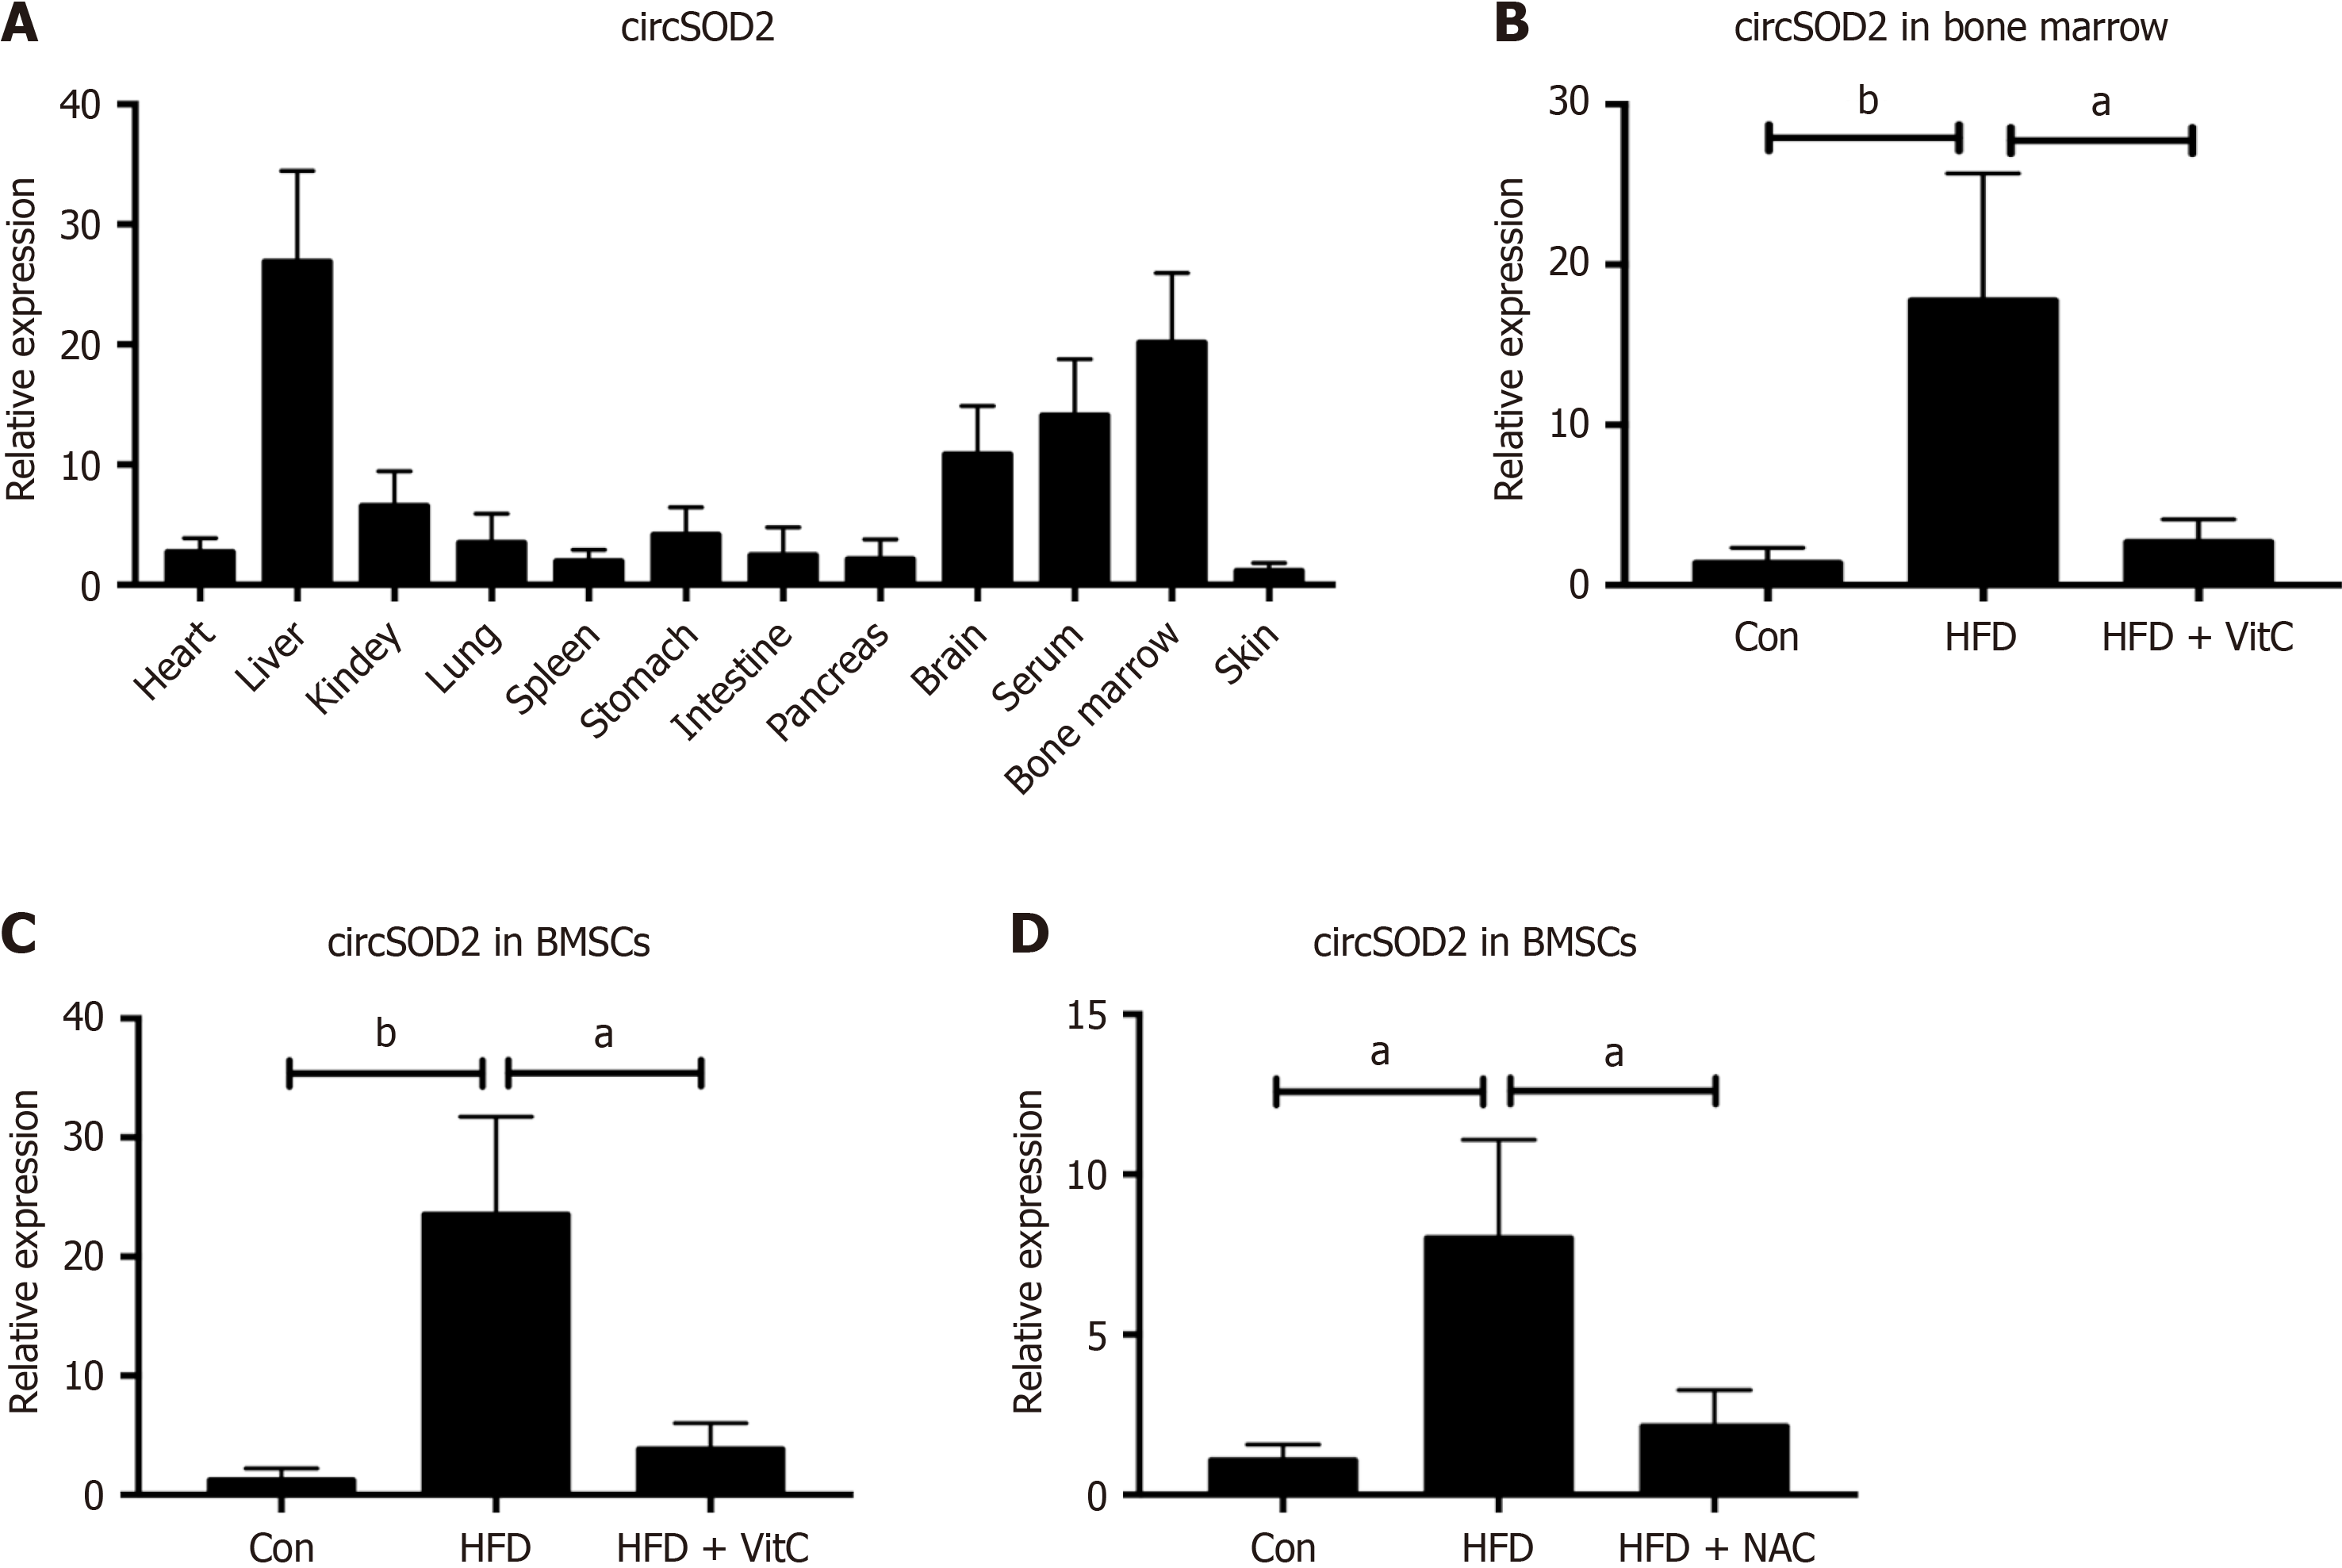
Figure 3 circSOD2 is delivered from hepatocytes to bone marrow mesenchymal stem cells.
A: Expression pattern of circSOD2 in various organs and tissues of high-fat diet (HFD) mice (n = 5); B and C: Expression levels of circSOD2 in bone marrow and bone marrow mesenchymal stem cells (BMSCs) of normal diet mice (Con), HFD mice, and HFD mice supplemented with Vitamin C (n = 5); D: Expression levels of circSOD2 in mice BMSCs after cocultured with hepatocytes from Con, HFD, and HFD pretreated with N-acetyl L-cysteine groups (n = 5). aP < 0.05; bP < 0.01; Con: Control; MDA: Malondialdehyde; HFD: High-fat diet; VitC: Vitamin C; NAC: N-acetyl L-cysteine.
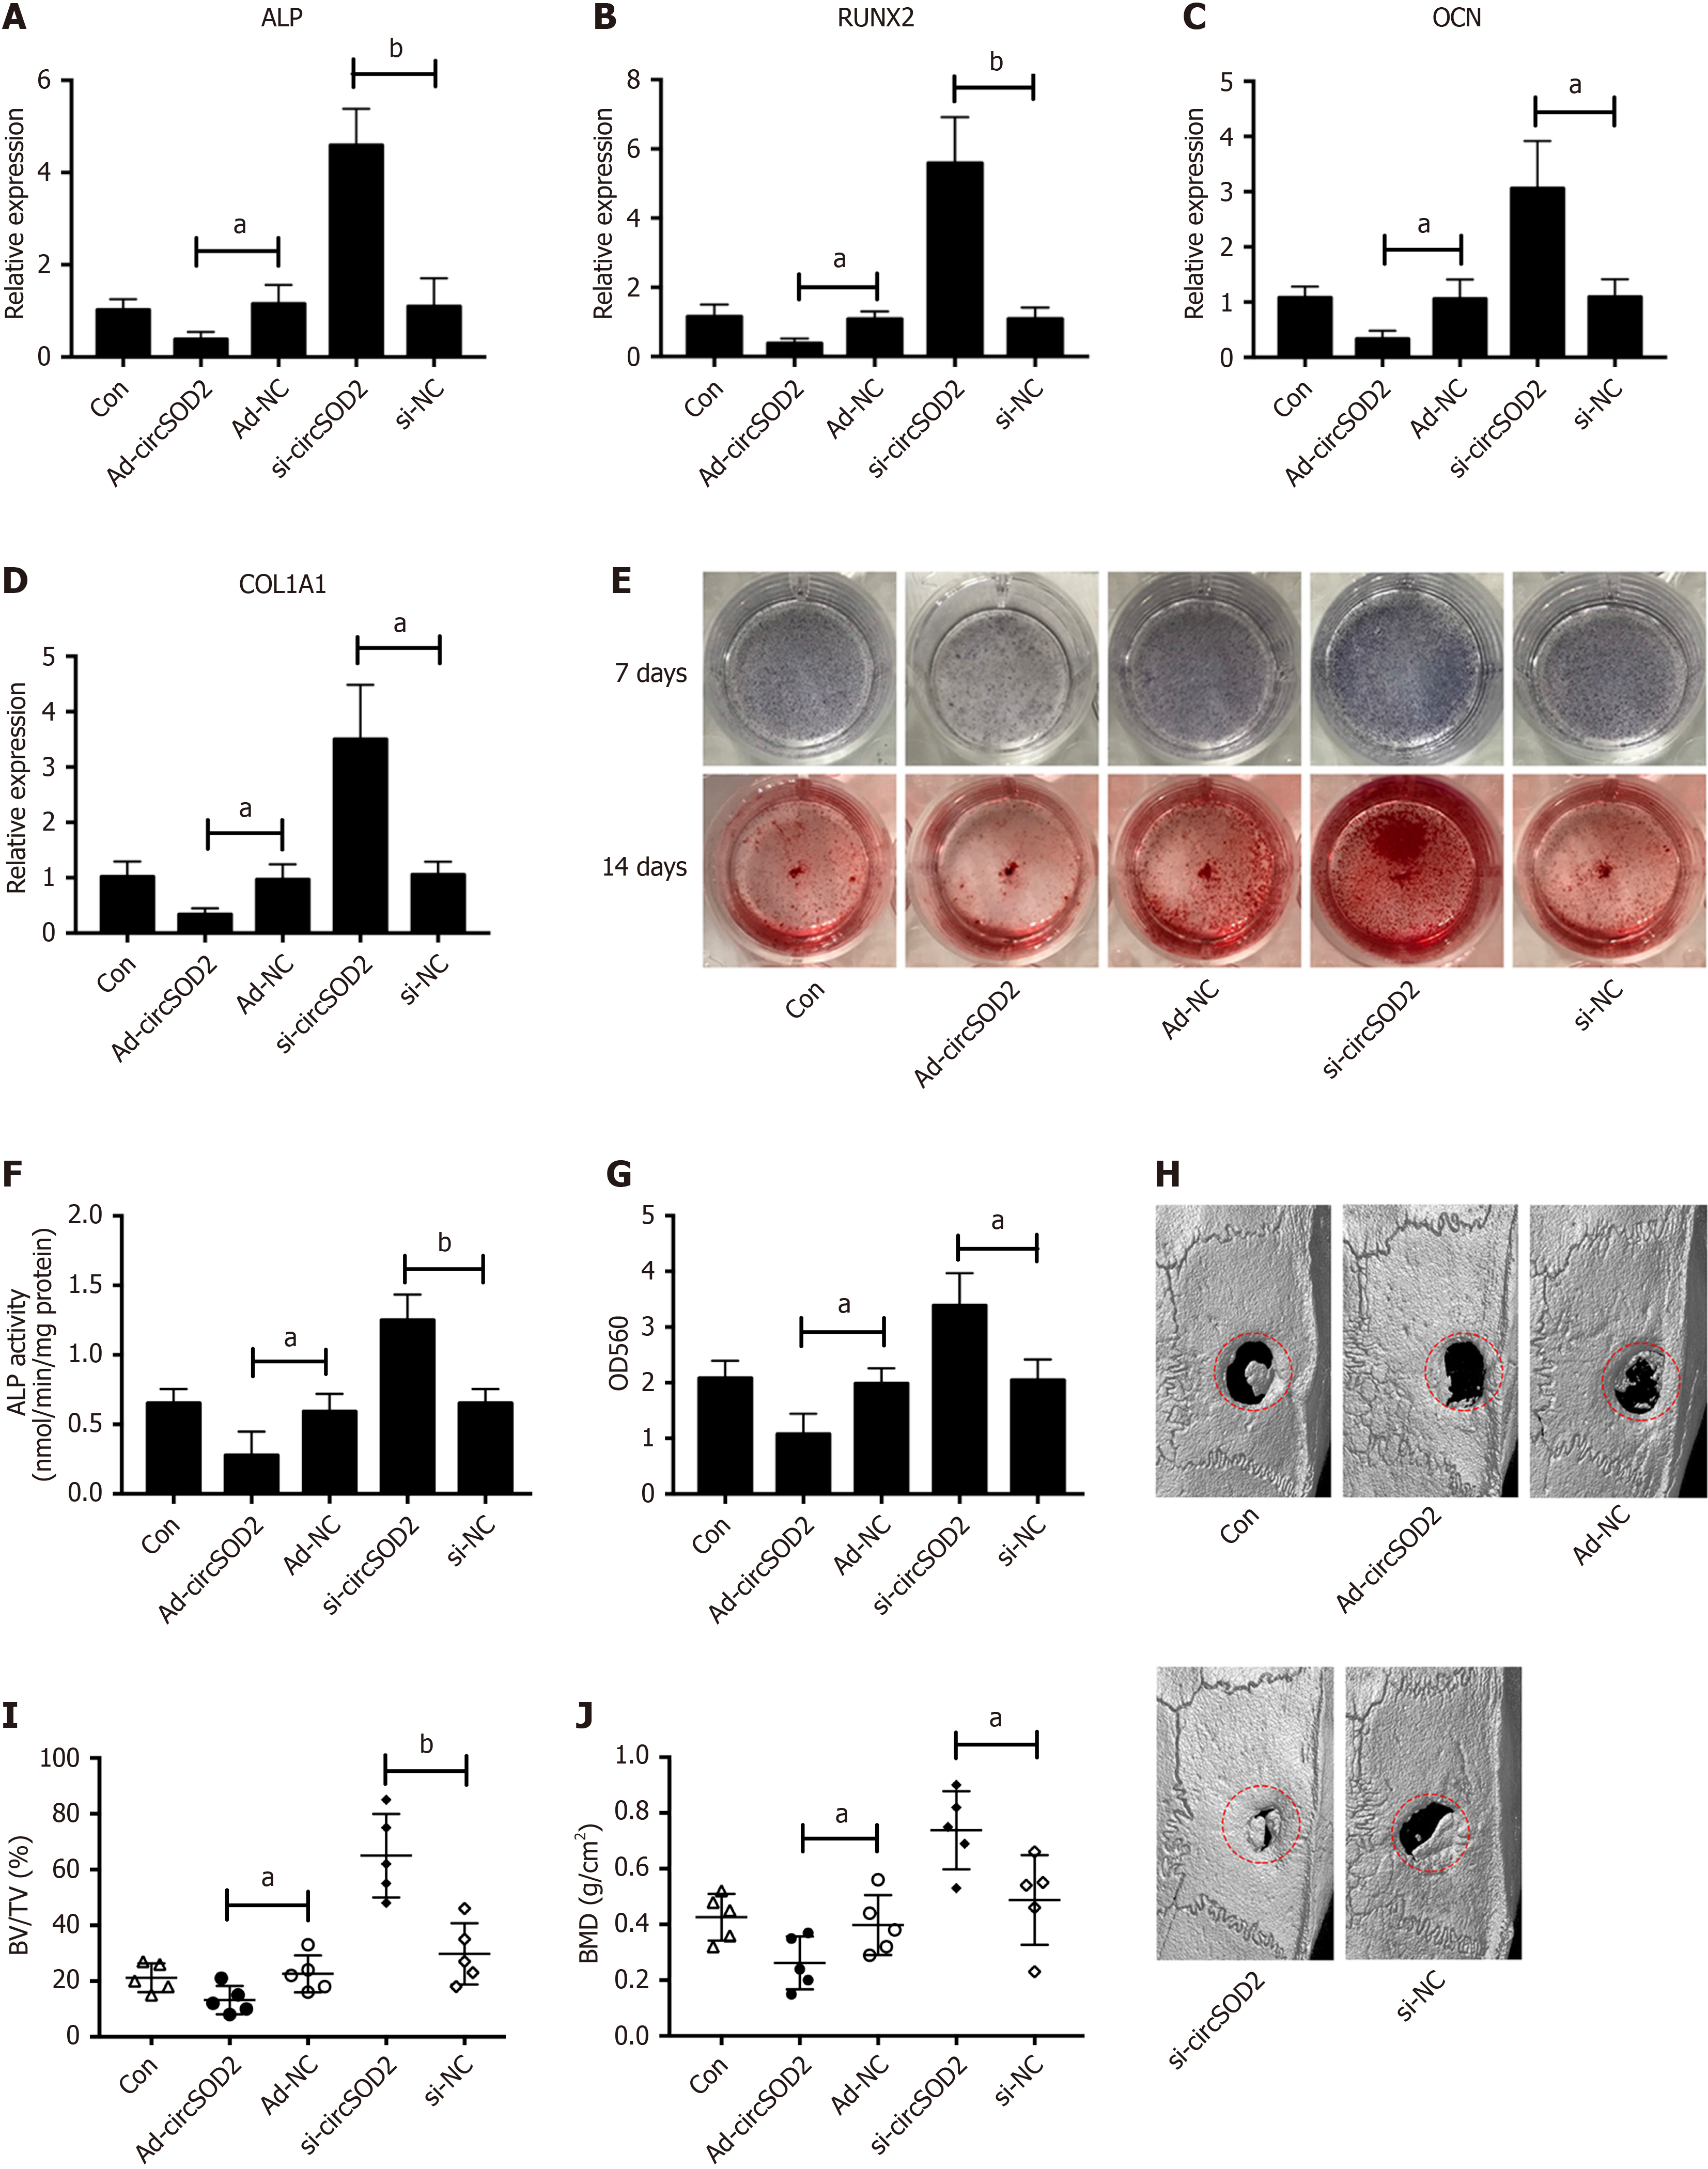
Figure 4 circSOD2 inhibits osteogenesis.
A-D: MRNA expression of osteogenic markers, including alkaline phosphatase (ALP), runt-related transcription factor 2, osteocalcin, and collagen type 1 alpha 1 in bone marrow mesenchymal stem cells (BMSCs) incubated with osteogenic medium for 7 days after transfection of AD-circSOD2 or si-circSOD2; E: ALP staining at 7 days and Alizarin Red staining at 14 days, demonstrating ALP activity and calcium deposition, respectively; F and G: Quantification of ALP activity and calcium deposition; H: Representative micro-computed tomography imaging of bone formation in rat calvarial critical-size defect mode at 8 weeks. Rats (n = 25) were randomly assigned to five groups: Blank (Con), overexpression (AD-circSOD2), overexpression control (AD-NC), knockdown (Sh-circSOD2), knockdown control (Sh-NC); I: Trabecular bone volume per tissue volume from histomorphometric analysis in the calvarial model (n = 5); J: Quantitative analysis of bone mineral density in the calvarial rat model (n = 5). aP < 0.05; bP < 0.01; ALP: Alkaline phosphatase; RUNX2: Runt-related transcription factor 2; OCN: Osteocalcin; COL1A1: Collagen type 1 alpha 1; Con: Control; BV/TV: Bone volume per tissue volume.
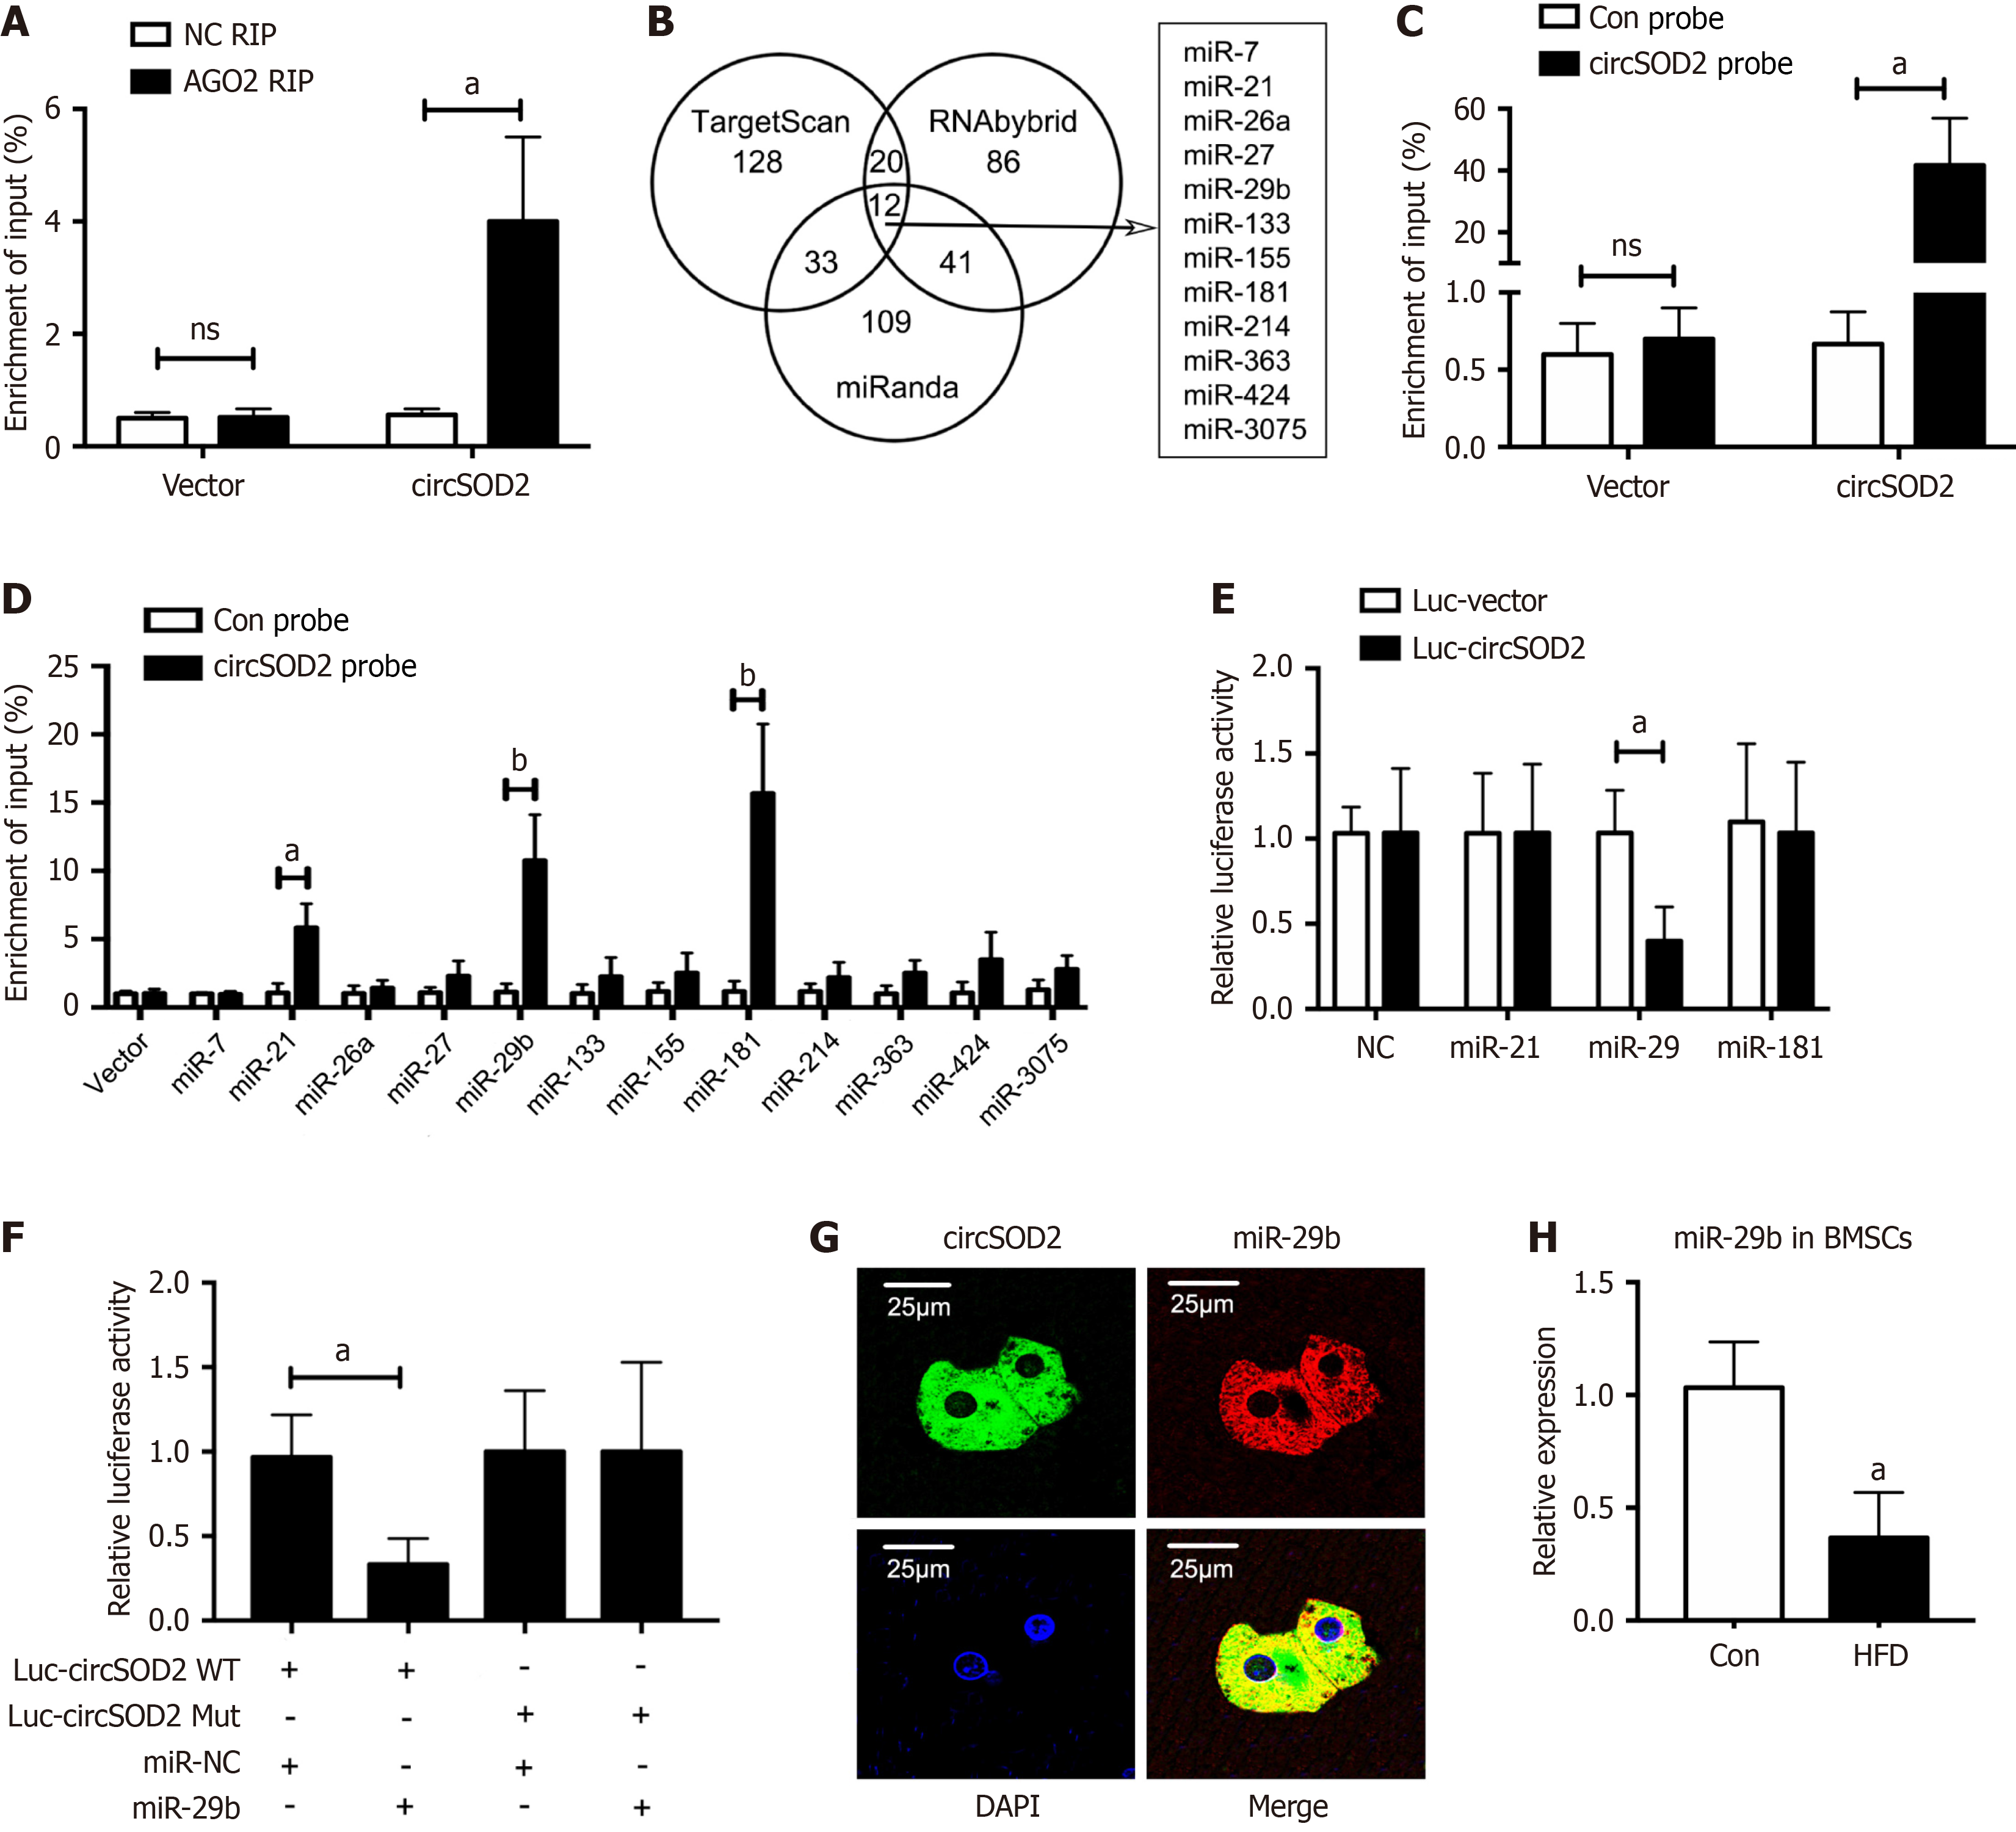
Figure 5 circSOD2 sponges miR-29b.
A: Reverse transcription-quantitative polymerase chain reaction (qRT-PCR) analysis of argonaute-2-bound circSOD2 using RNA immunoprecipitation; B: Venn diagram illustrating 12 potential target miRNAs of circSOD2 through cross-referencing TargetScan, RNAbybrid, and miRanda databases; C: Quantification of the efficiency of the circSOD2 probe for RNA antisense purification analysis using qRT-PCR; D: Quantification of the circSOD2-bound miRNAs using qRT-PCR; E: Relative luciferase activity of circSOD2 Luciferase reporter plasmids co-transfected with candidate miRNA mimics in HEK-293T cells; F: Quantification of relative luciferase activity using dual luciferase reporter assay after co-transfection of Luc-circSOD2 WT or Mut with miR-29b mimic or negative control in HEK-293T cells; G: Fluorescence in situ hybridization assay images demonstrating co-localization of circSOD2 and miR-29b in the cytoplasm; H: Decreased expression of miR-29b in bone marrow mesenchymal stem cells from high-fat diet mice (n = 5). aP < 0.05; bP < 0.01; NS: Not significant; NC: Negative control; AGO2: Analysis of argonaute-2; RIP: RNA immunoprecipitation; WT: Wildtype; Mut: Mutation; Con: Control.
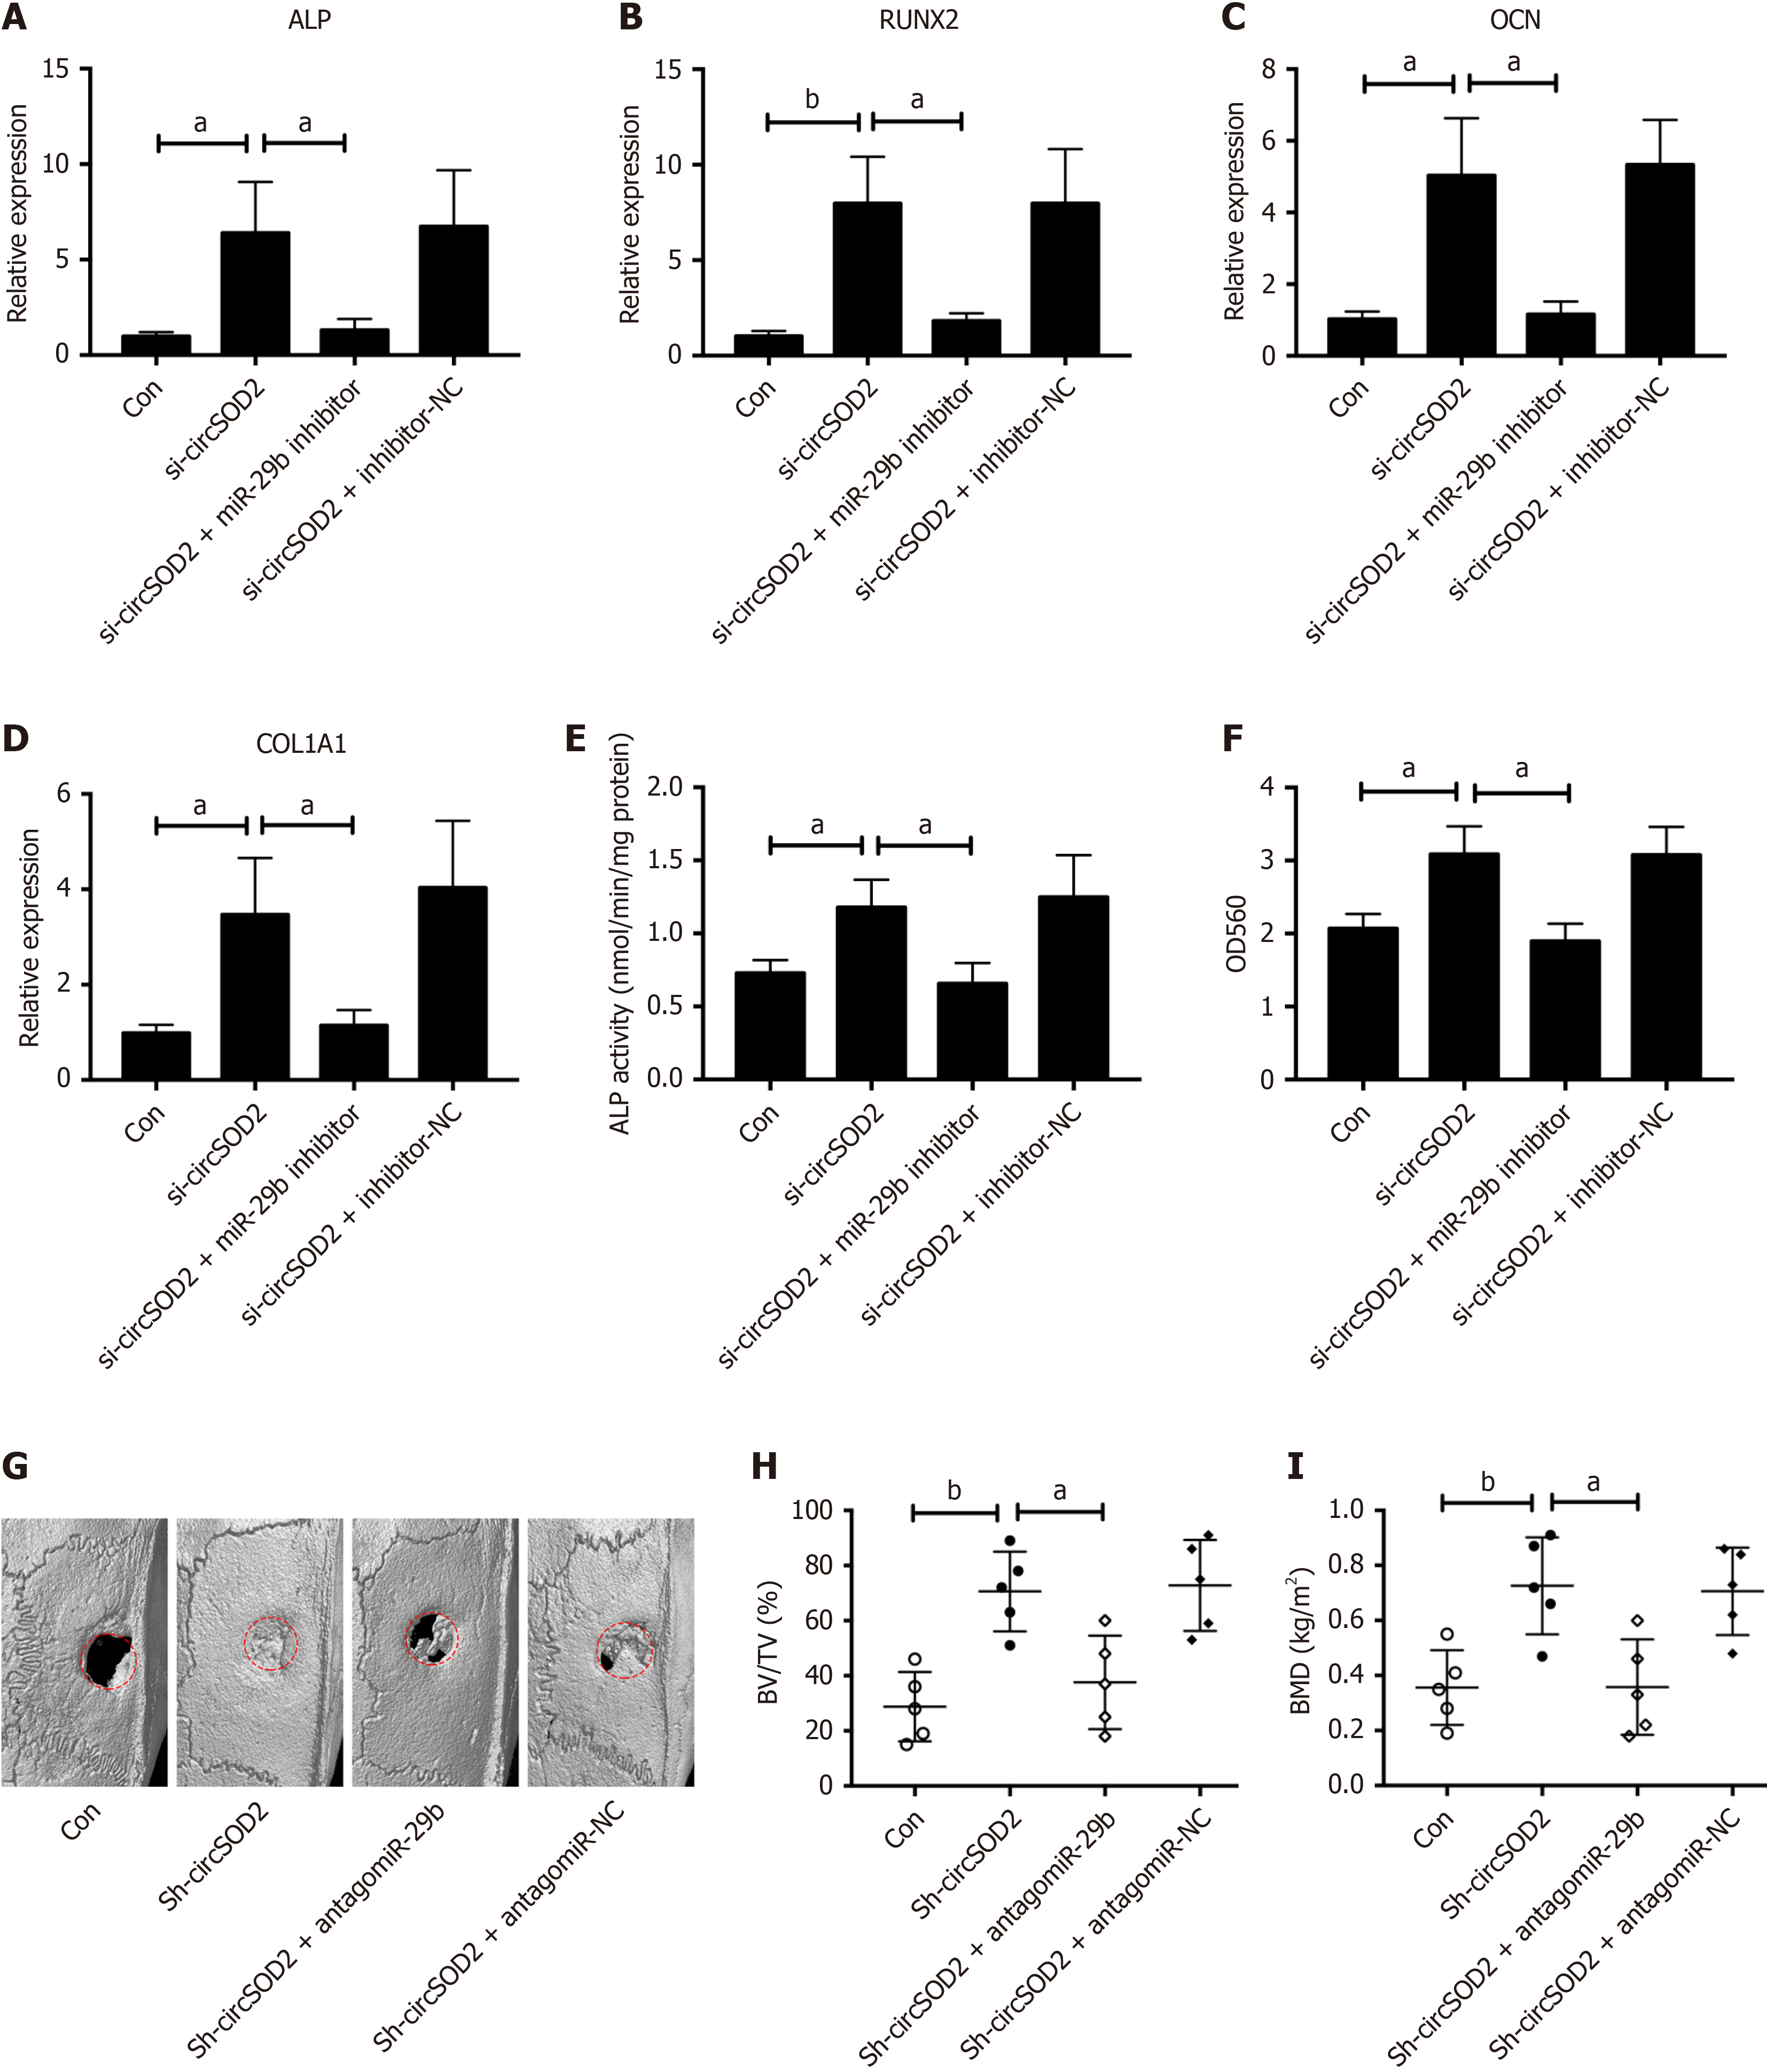
Figure 6 miR-29b inhibition reversed the effect of circSOD2 silencing on osteogenic differentiation of bone marrow mesenchymal stem cells.
A-F: The mRNA expression of osteogenic markers, including alkaline phosphatase (ALP) (A), Runt-related transcription factor 2 (B), osteocalcin (C), and collagen type 1 alpha 1 (D), and ALP activity (E), calcium deposition (F) in bone marrow mesenchymal stem cells incubated with osteogenic medium for 7 days after cotransfection of si-circSOD2 with or without miR-29b inhibitor; G: Representative micro-computed tomography imaging of bone formation at 8 weeks in a rat calvarial critical size defect model. Rats (n = 20) were randomly assigned to four groups: Blank (Con), knockdown (Sh-circSOD2), rescue (Sh-circSOD2 + antagomiR-29b), and rescue control (Sh-circSOD2 + antagomiR-negative control); H: Trabecular bone volume per tissue volume in the rat calvarial model quantified via histomorphometric analysis (n = 5); I: Quantitative analysis of calvarial bone mineral density in the rat model (n = 5). Data indicate the mean ± SD from at least three independent experiments. Representative images are from three independent experiments. aP < 0.05; bP < 0.01; BMD: Bone mineral density; NC: Negative control; ALP: Alkaline phosphatase; RUNX2: Runt-related transcription factor 2; OCN: Osteocalcin; COL1A1: Collagen type 1 alpha 1; BMSCs: Bone marrow mesenchymal stem cells; BV/TV: Bone volume per tissue volume; Con: Control.
- Citation: Li LP, Chen XY, Liu HB, Zhu Y, Xie MJ, Li YJ, Luo M, Albahde M, Zhang HY, Lou JY. Oxidative stress-induced circSOD2 inhibits osteogenesis through sponging miR-29b in metabolic-associated fatty liver disease. World J Gastroenterol 2025; 31(9): 98027
- URL: https://www.wjgnet.com/1007-9327/full/v31/i9/98027.htm
- DOI: https://dx.doi.org/10.3748/wjg.v31.i9.98027


