Copyright
©The Author(s) 2025.
World J Gastroenterol. Feb 21, 2025; 31(7): 98852
Published online Feb 21, 2025. doi: 10.3748/wjg.v31.i7.98852
Published online Feb 21, 2025. doi: 10.3748/wjg.v31.i7.98852
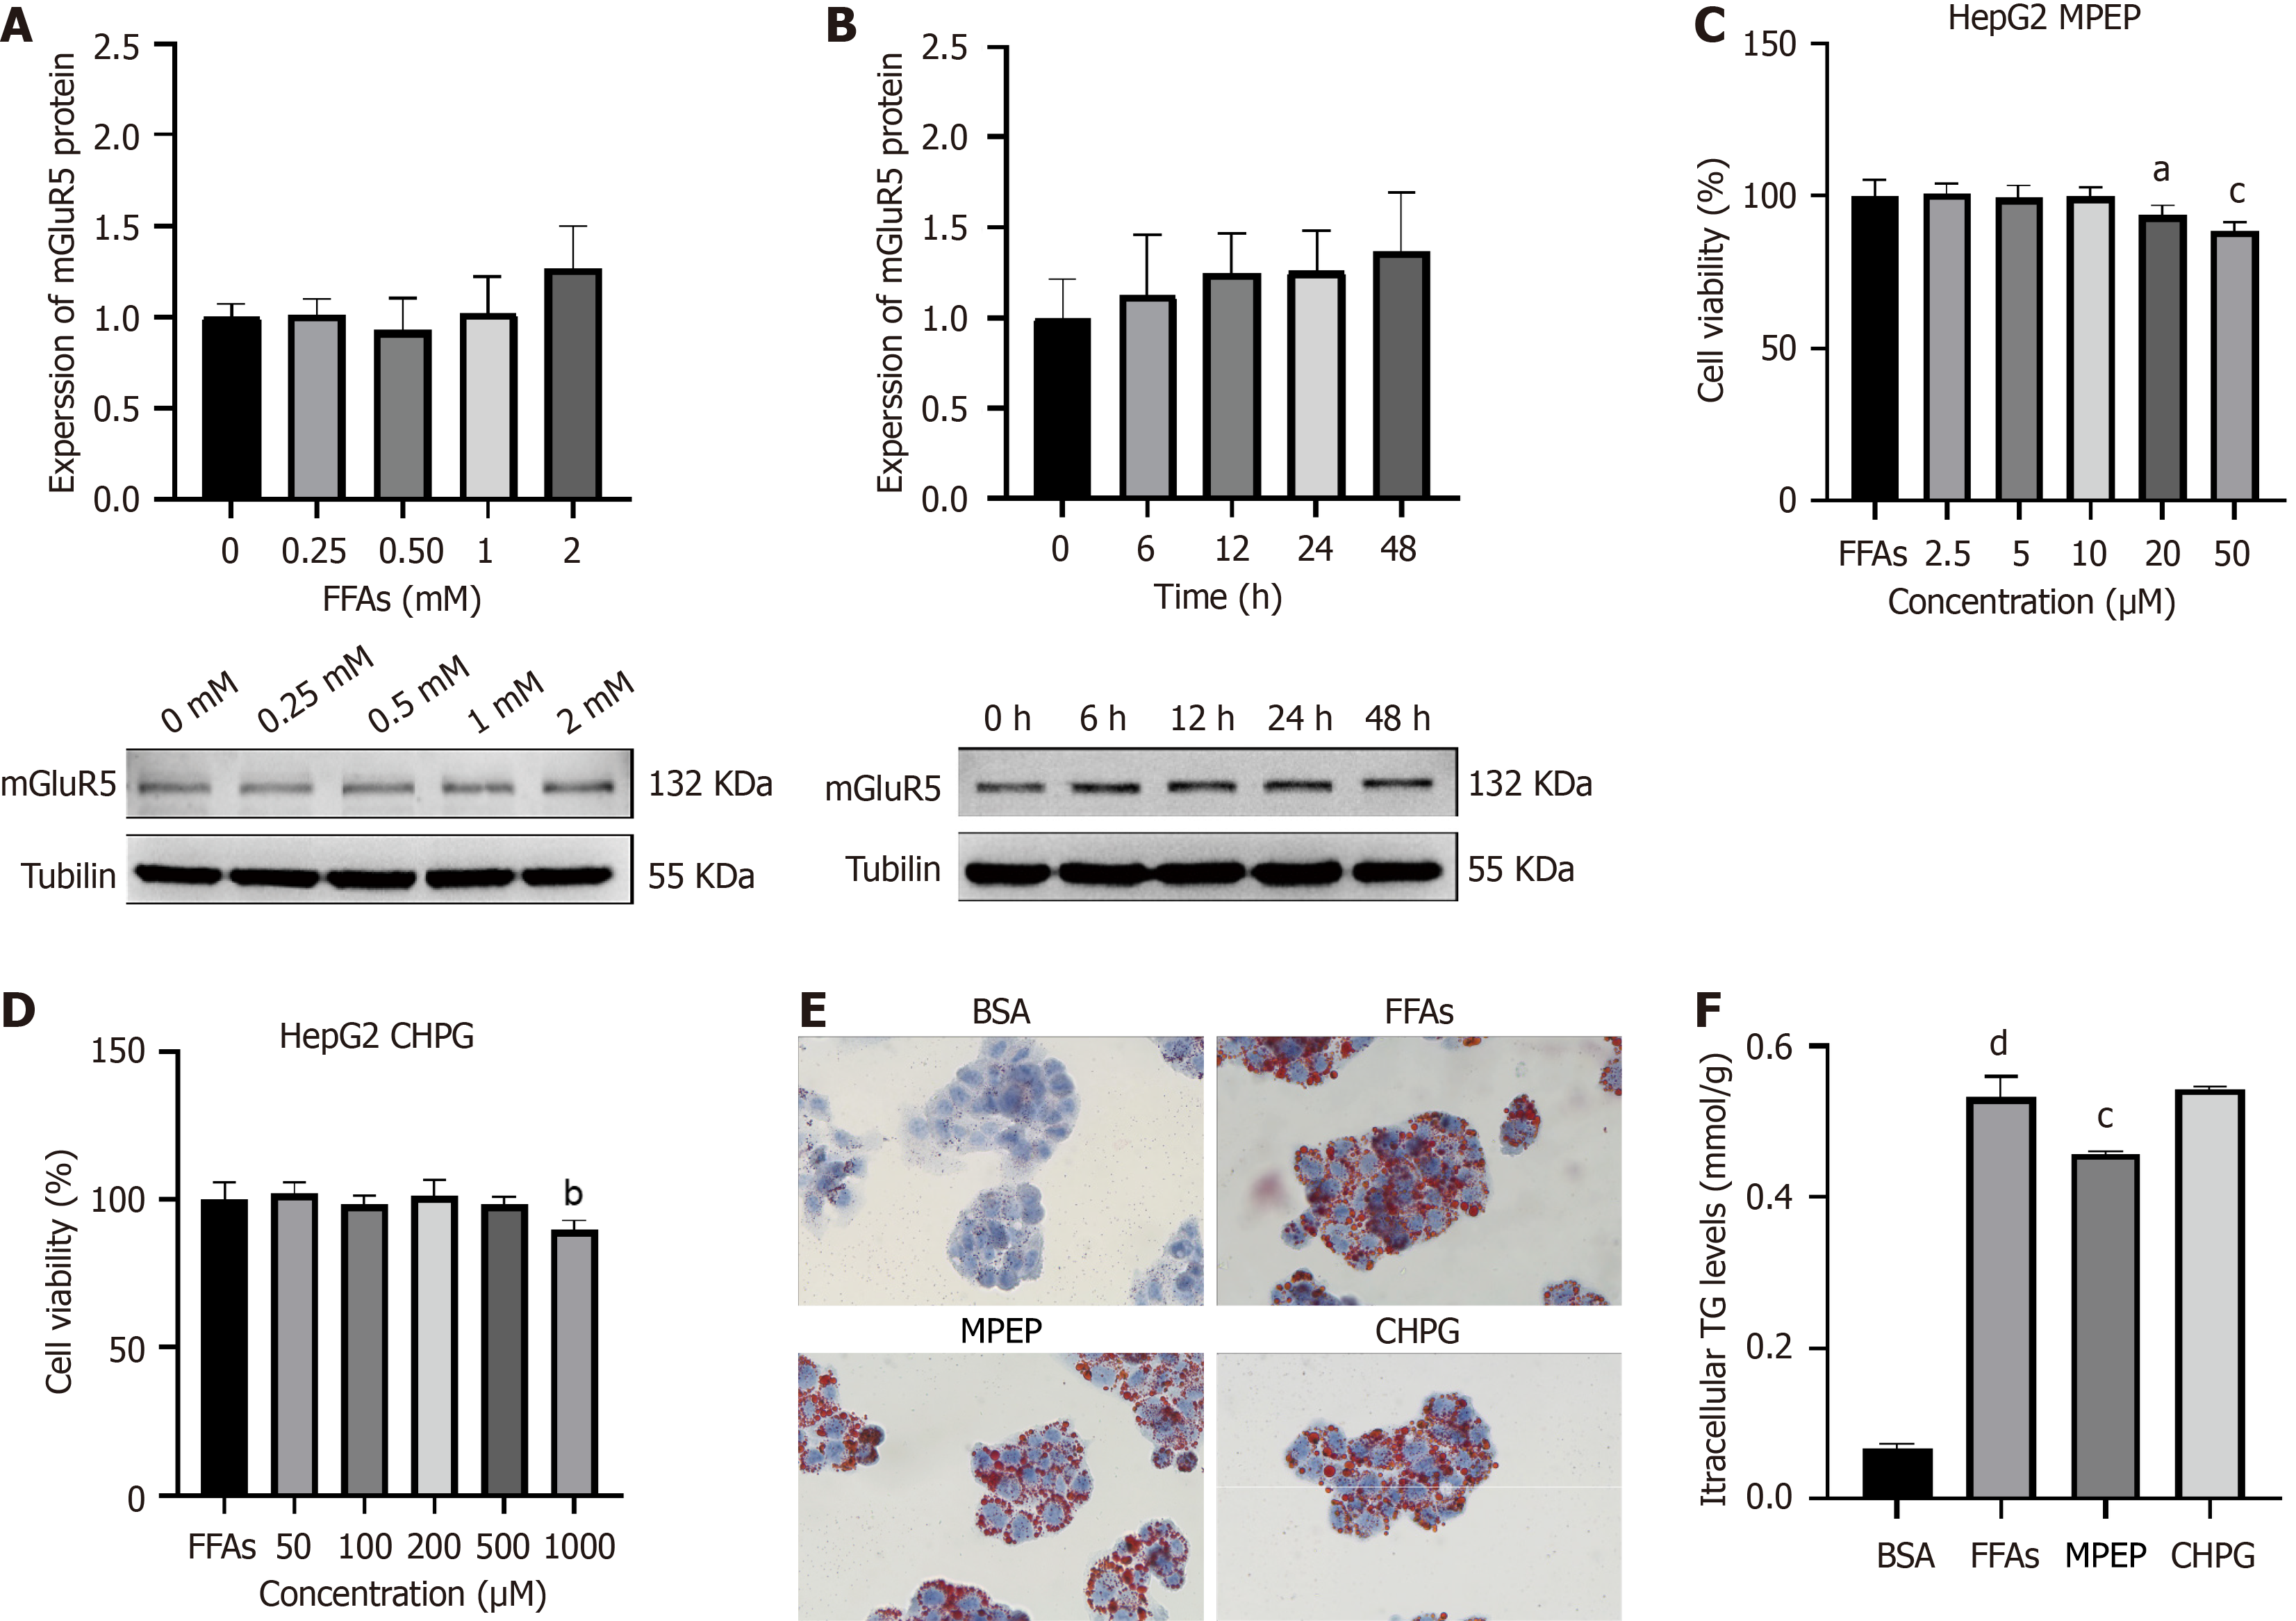
Figure 1 Inhibition of metabotropic glutamate receptor type 5 attenuates hepatocyte steatosis in vitro.
A: Protein expression of metabotropic glutamate receptor type 5 (mGluR5) in HepG2 cells treated with different concentrations of free fatty acids (FFAs) for 24 hours; B: Protein expression of mGluR5 in HepG2 cells treated with 0.5 mmol/L FFAs for different Durations; C: CCK-8 assays revealed the effects of MPEP (2.5, 5, 10, 20, and 50 μM) on HepG2 cell viability; D: CCK-8 assays revealed the effects of CHPG (50, 100, 200, 500, and 1000 μM) on HepG2 cell viability; E and F: HepG2 cells were stimulated with 0.5 mmol/L FFAs for 24 hours and then treated with MPEP (10 μM) or CHPG (500 μM) for another 24 hours. The cells were stained with Oil Red O, and the intracellular triglyceride concentration was quantitatively determined. aP < 0.05 vs free fatty acids, bP < 0.01 vs free fatty acids, cP < 0.001 vs free fatty acids; dP < 0.001 vs bovine serum albumin. The data are presented as the mean ± SE. All cell experiments were repeated three times. mGluR5: Metabotropic glutamate receptor type 5; FFAs: Free fatty acids; BSA: Bovine serum albumin.
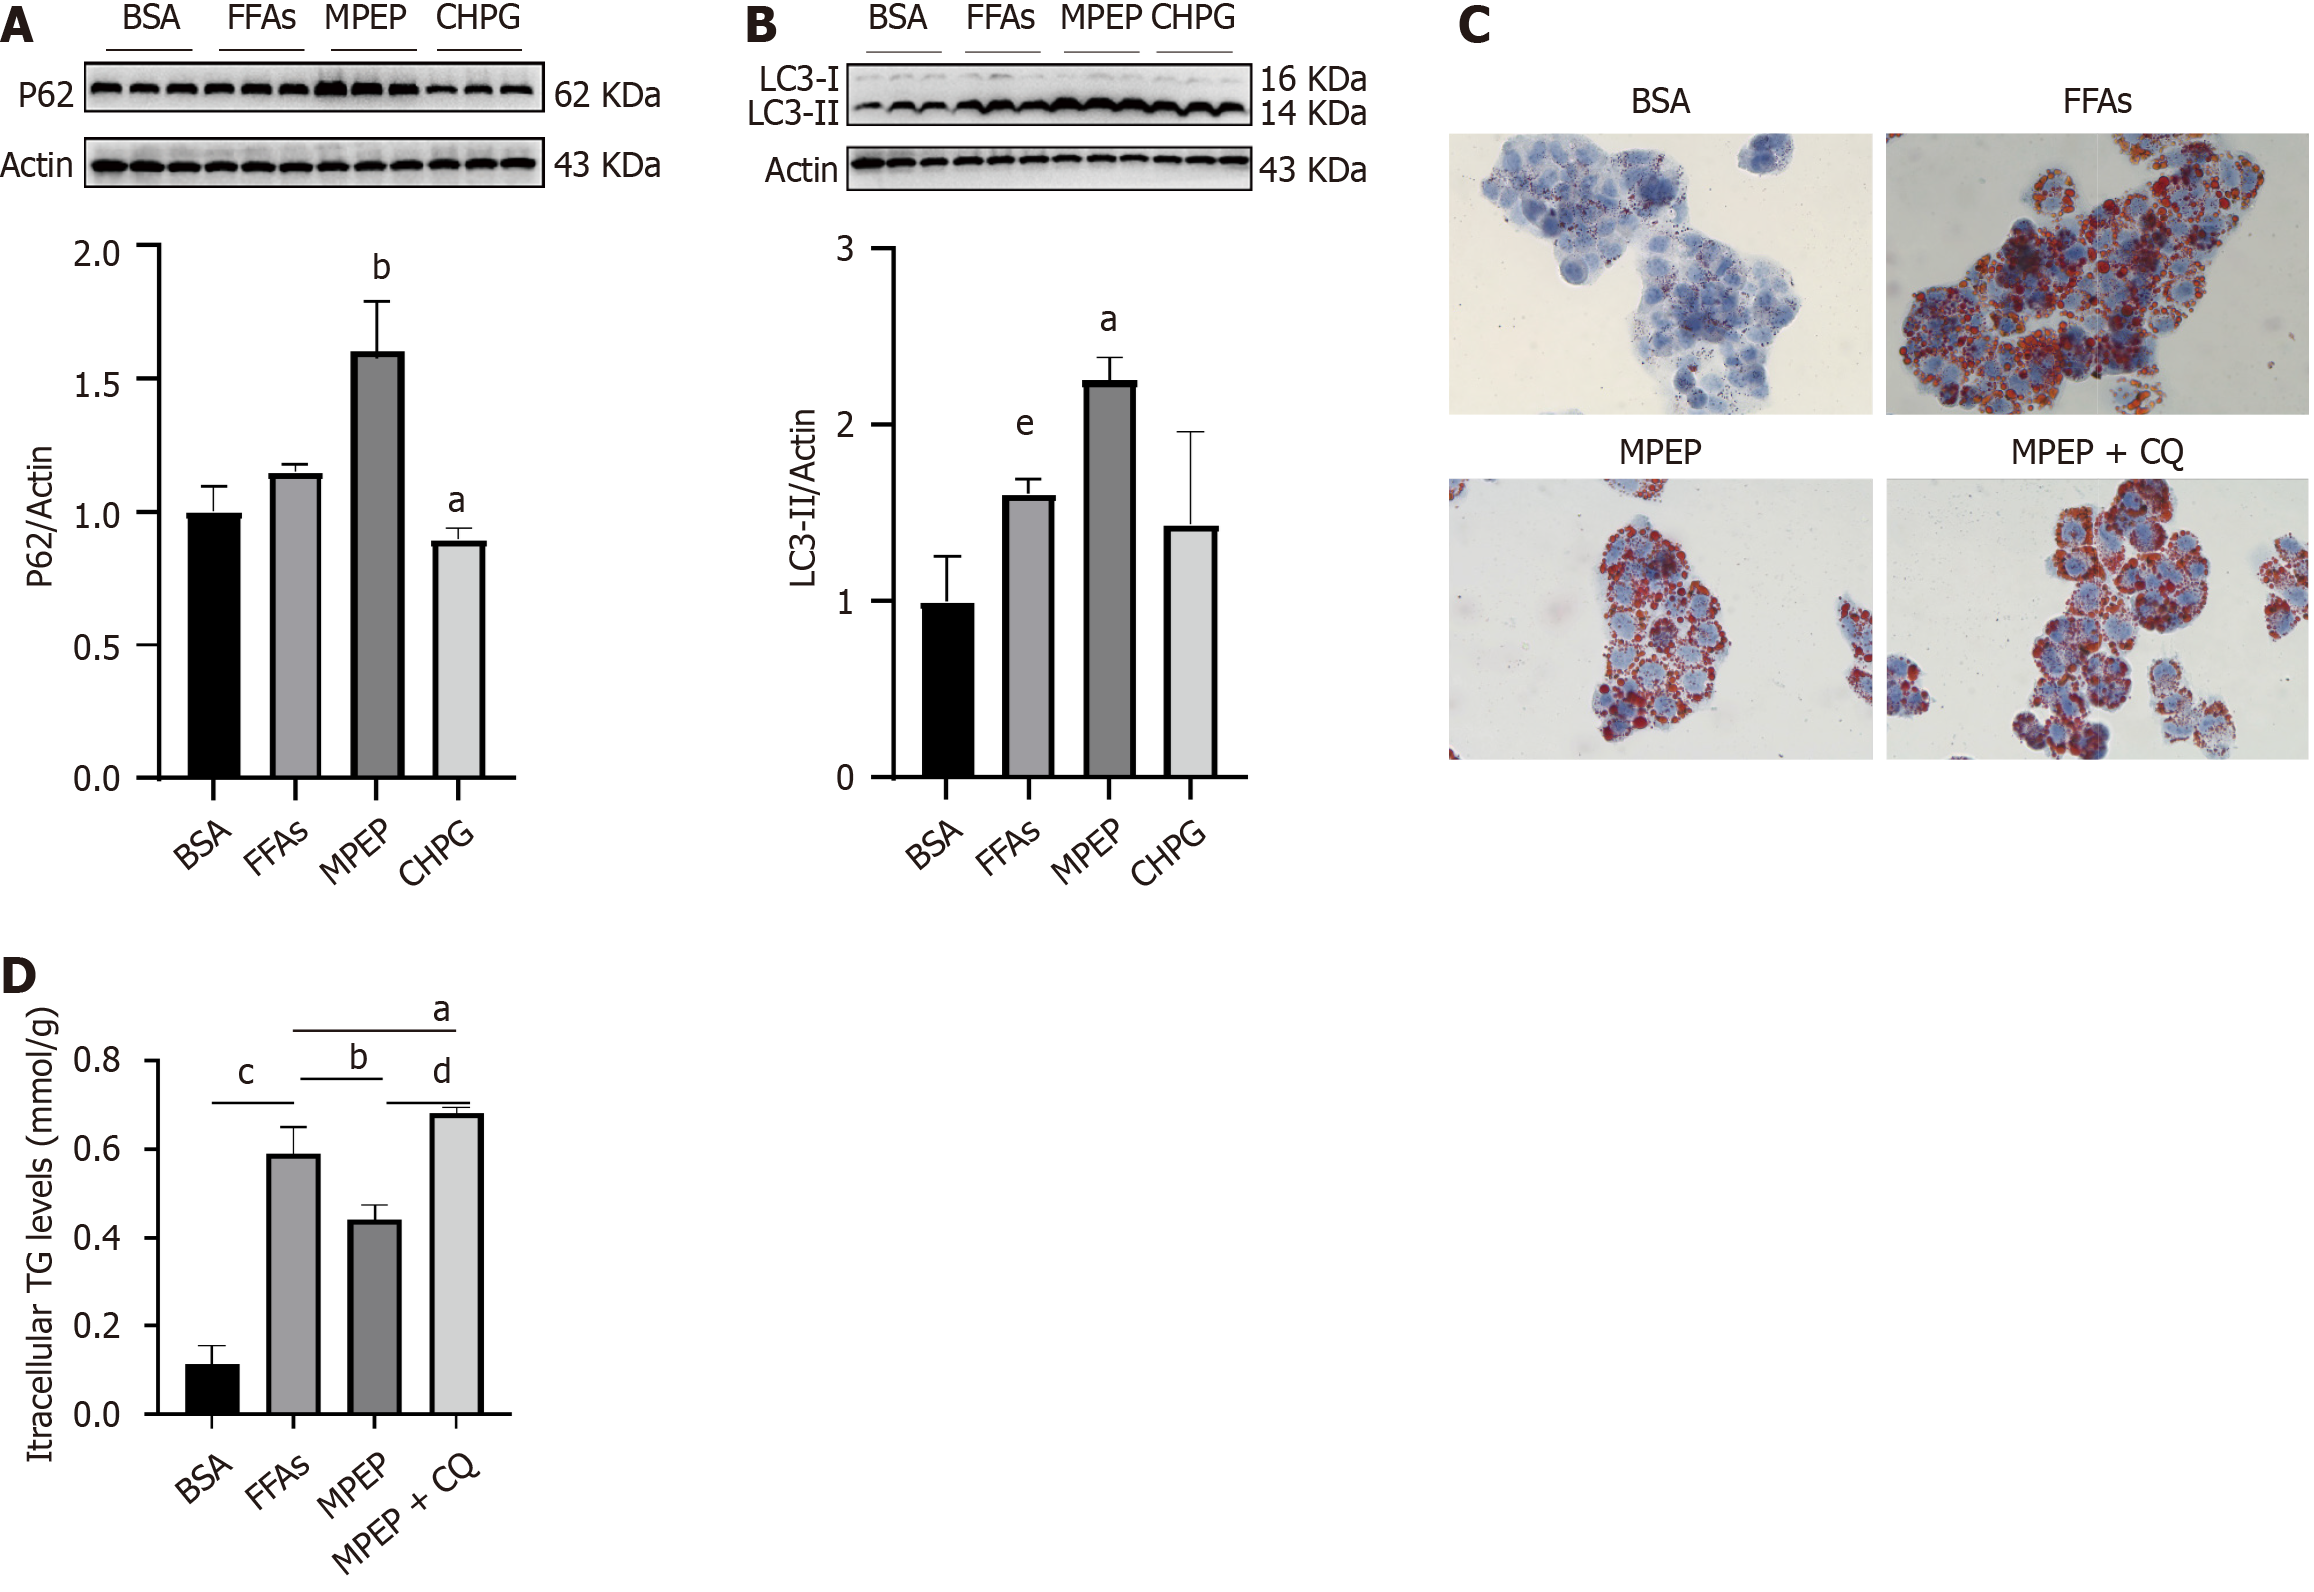
Figure 2 Inhibition of metabotropic glutamate receptor type 5 improves lipid accumulation by increasing autophagy in free fatty acids-stimulated HepG2 cells.
A and B: HepG2 cells were stimulated with 0.5 mmol/L free fatty acids (FFAs) for 24 hours and then treated with MPEP (10 μM) or CHPG (500 μM) for another 24 hours. Western blotting was used to detect the protein expression of LC3 and p62 in the cells; C and D: HepG2 cells were stimulated with 0.5 mmol/L FFAs for 24 hours and then treated with MPEP (10 μM) or MPEP (10 μM) +chloroquine (20 μM) for another 24 hours. The cells were stained with Oil Red O, and the intracellular triglyceride concentration was quantitatively determined. aP < 0.05 vs free fatty acids; bP < 0.01 vs free fatty acids; cP < 0.001 vs bovine serum albumin; dP < 0.001 vs MPEP; eP < 0.05 vs bovine serum albumin. The data are presented as the mean ± SE. All cell experiments were repeated three times. FFAs: Free fatty acids; BSA: Bovine serum albumin; CQ: Chloroquine.
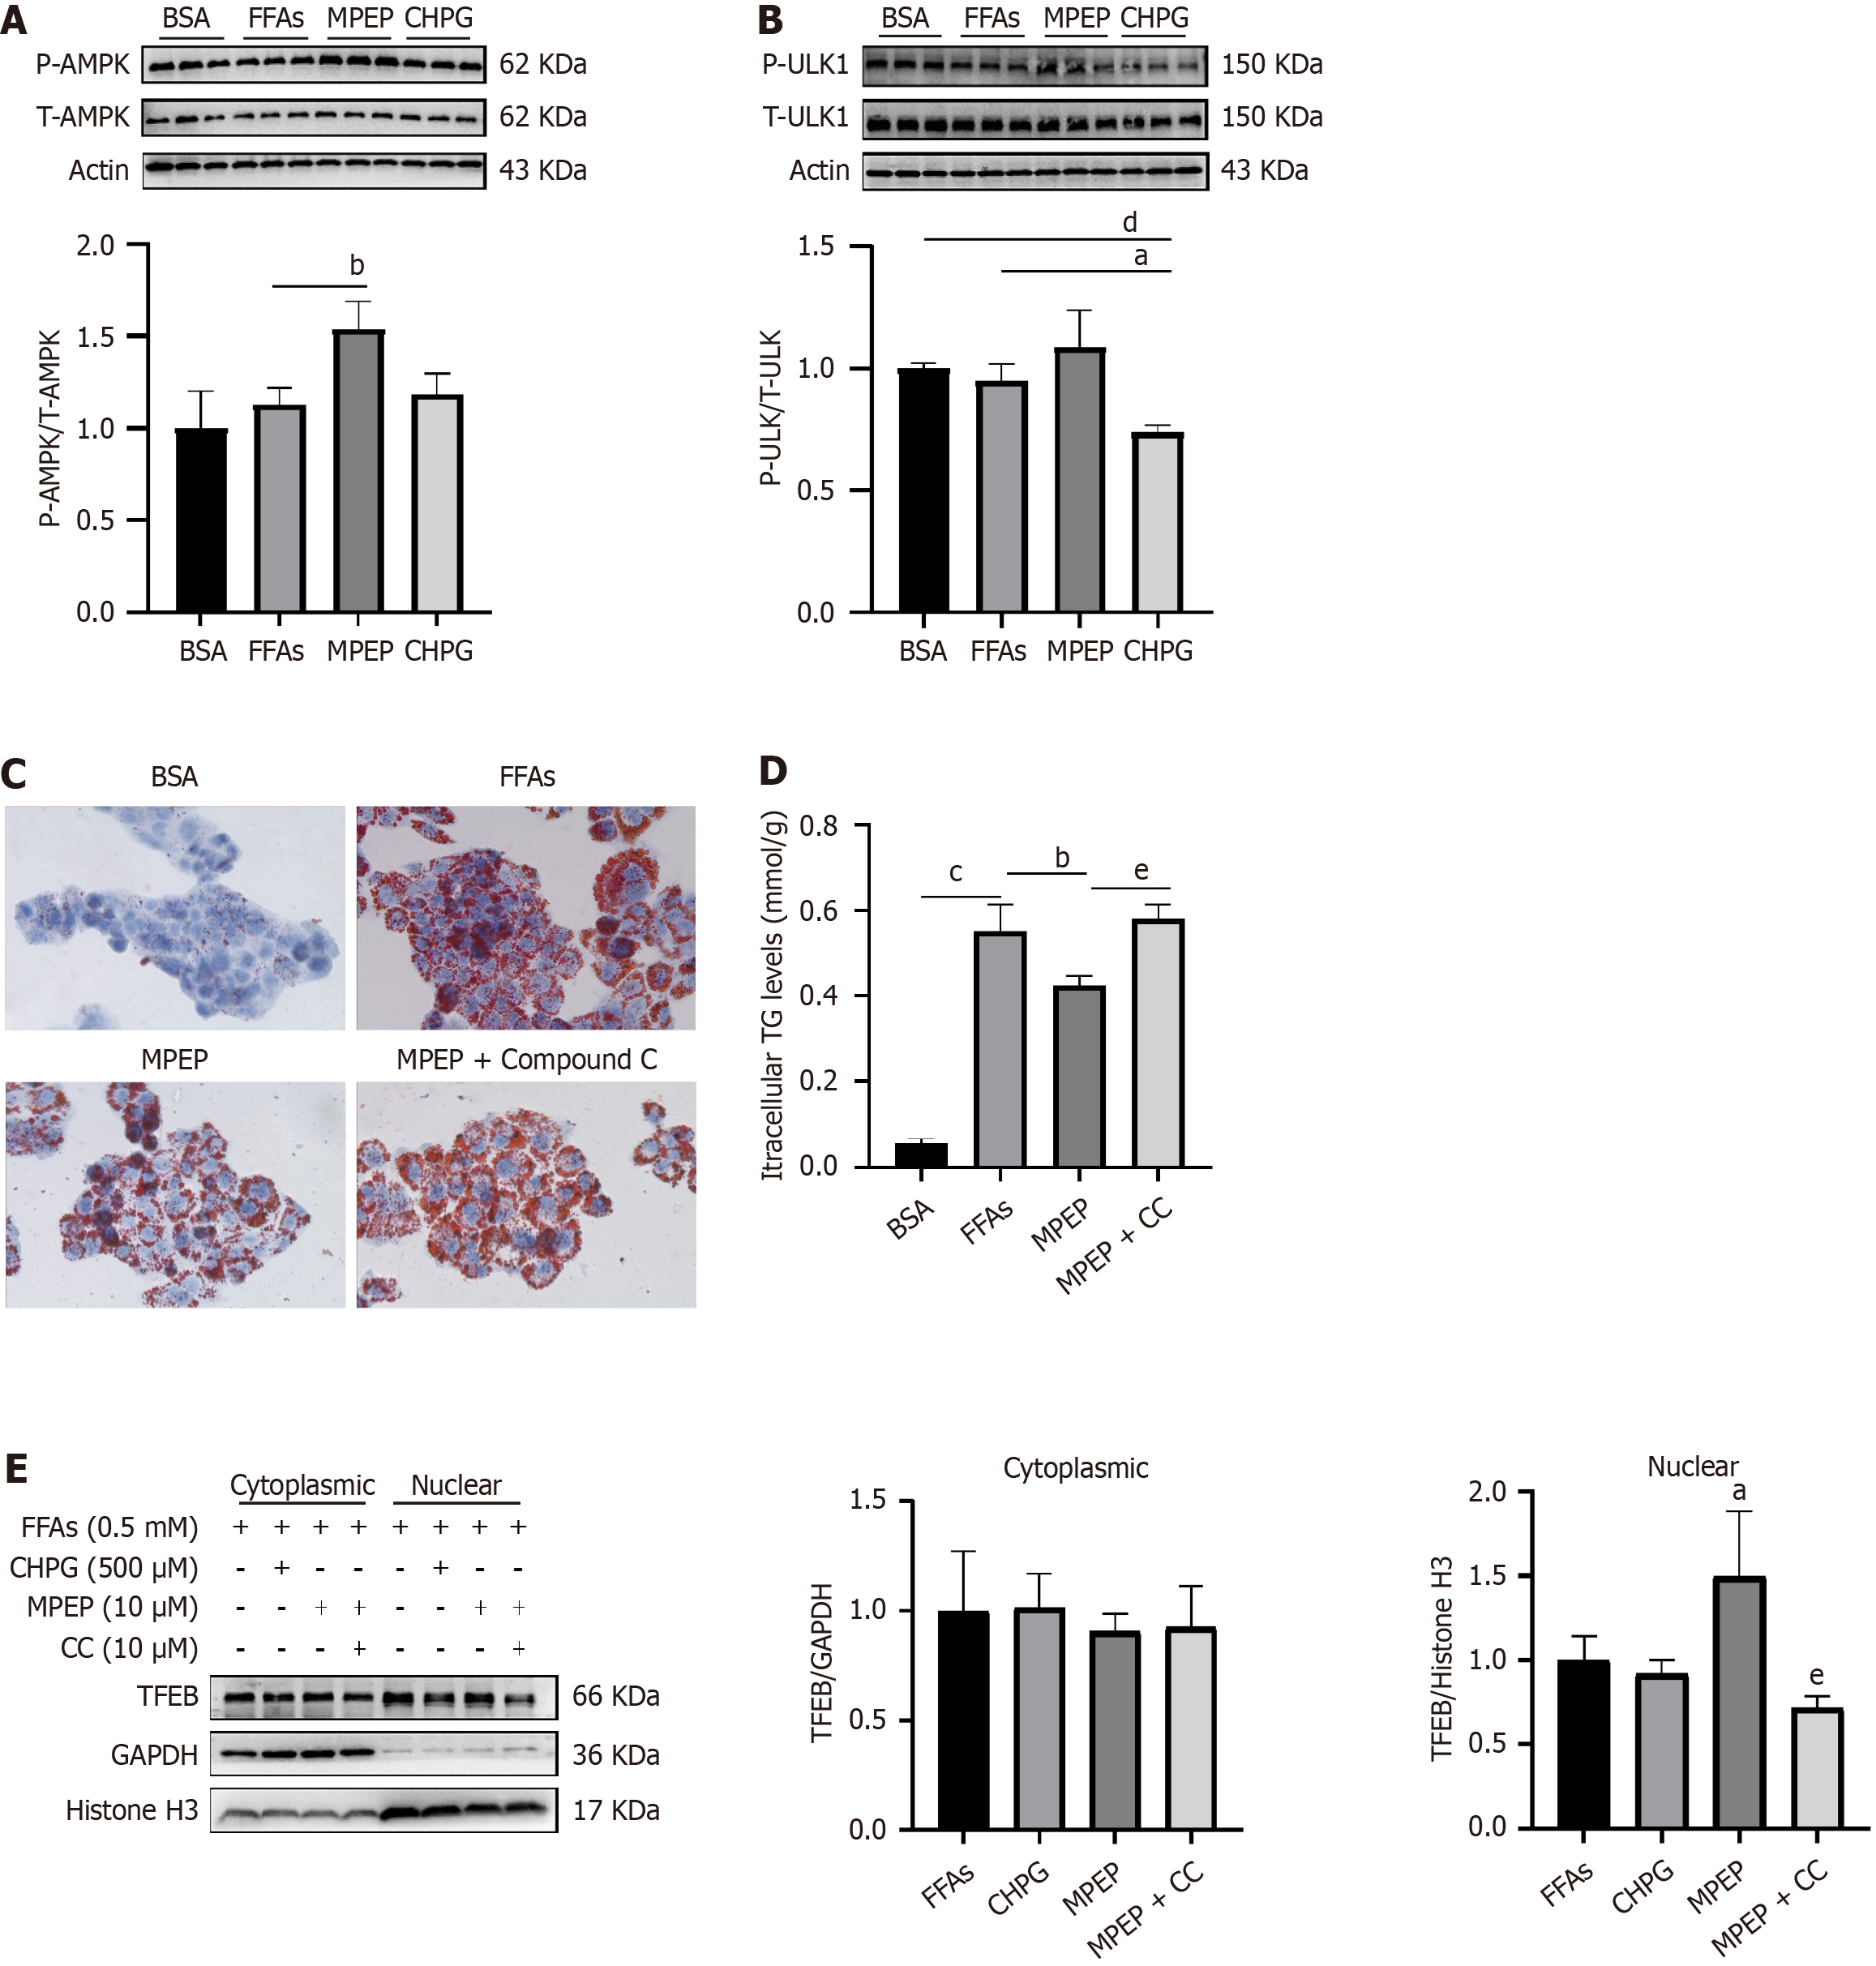
Figure 3 Inhibition of metabotropic glutamate receptor type 5-induced autophagy via activation of the AMPK signaling pathway.
A and B: HepG2 cells were stimulated with 0.5 mmol/L free fatty acids (FFAs) for 24 hours and then treated with MPEP (10 μM) or CHPG (500 μM) for another 24 hours. Western blotting was used to detect the protein expression of P-AMPK, AMPK, P-ULK1 and ULK1 in the cells; C-E: HepG2 cells were stimulated with 0.5 mmol/L FFAs for 24 hours and then treated with MPEP (10 μM), CHPG or MPEP (10 μM) + Compound C (10 μM) for another 24 hours. The cells were stained with Oil Red O (C), and the level of intracellular triglyceride was quantitatively determined (D). Western blot was used to determine transcription factor EB expression in the cytoplasmic and nuclear fractions of HepG2 cells (E). Histone H3 was used as a reference control for nuclear expression. aP < 0.05 vs free fatty acids; bP < 0.01 vs free fatty acids; cP < 0.001 vs bovine serum albumin; dP < 0.01 vs bovine serum albumin; eP < 0.01 vs MPEP. The data are presented as the mean ± SE. All cell experiments were repeated three times. FFAs: Free fatty acids; BSA: Bovine serum albumin; TFEB: Transcription factor EB.
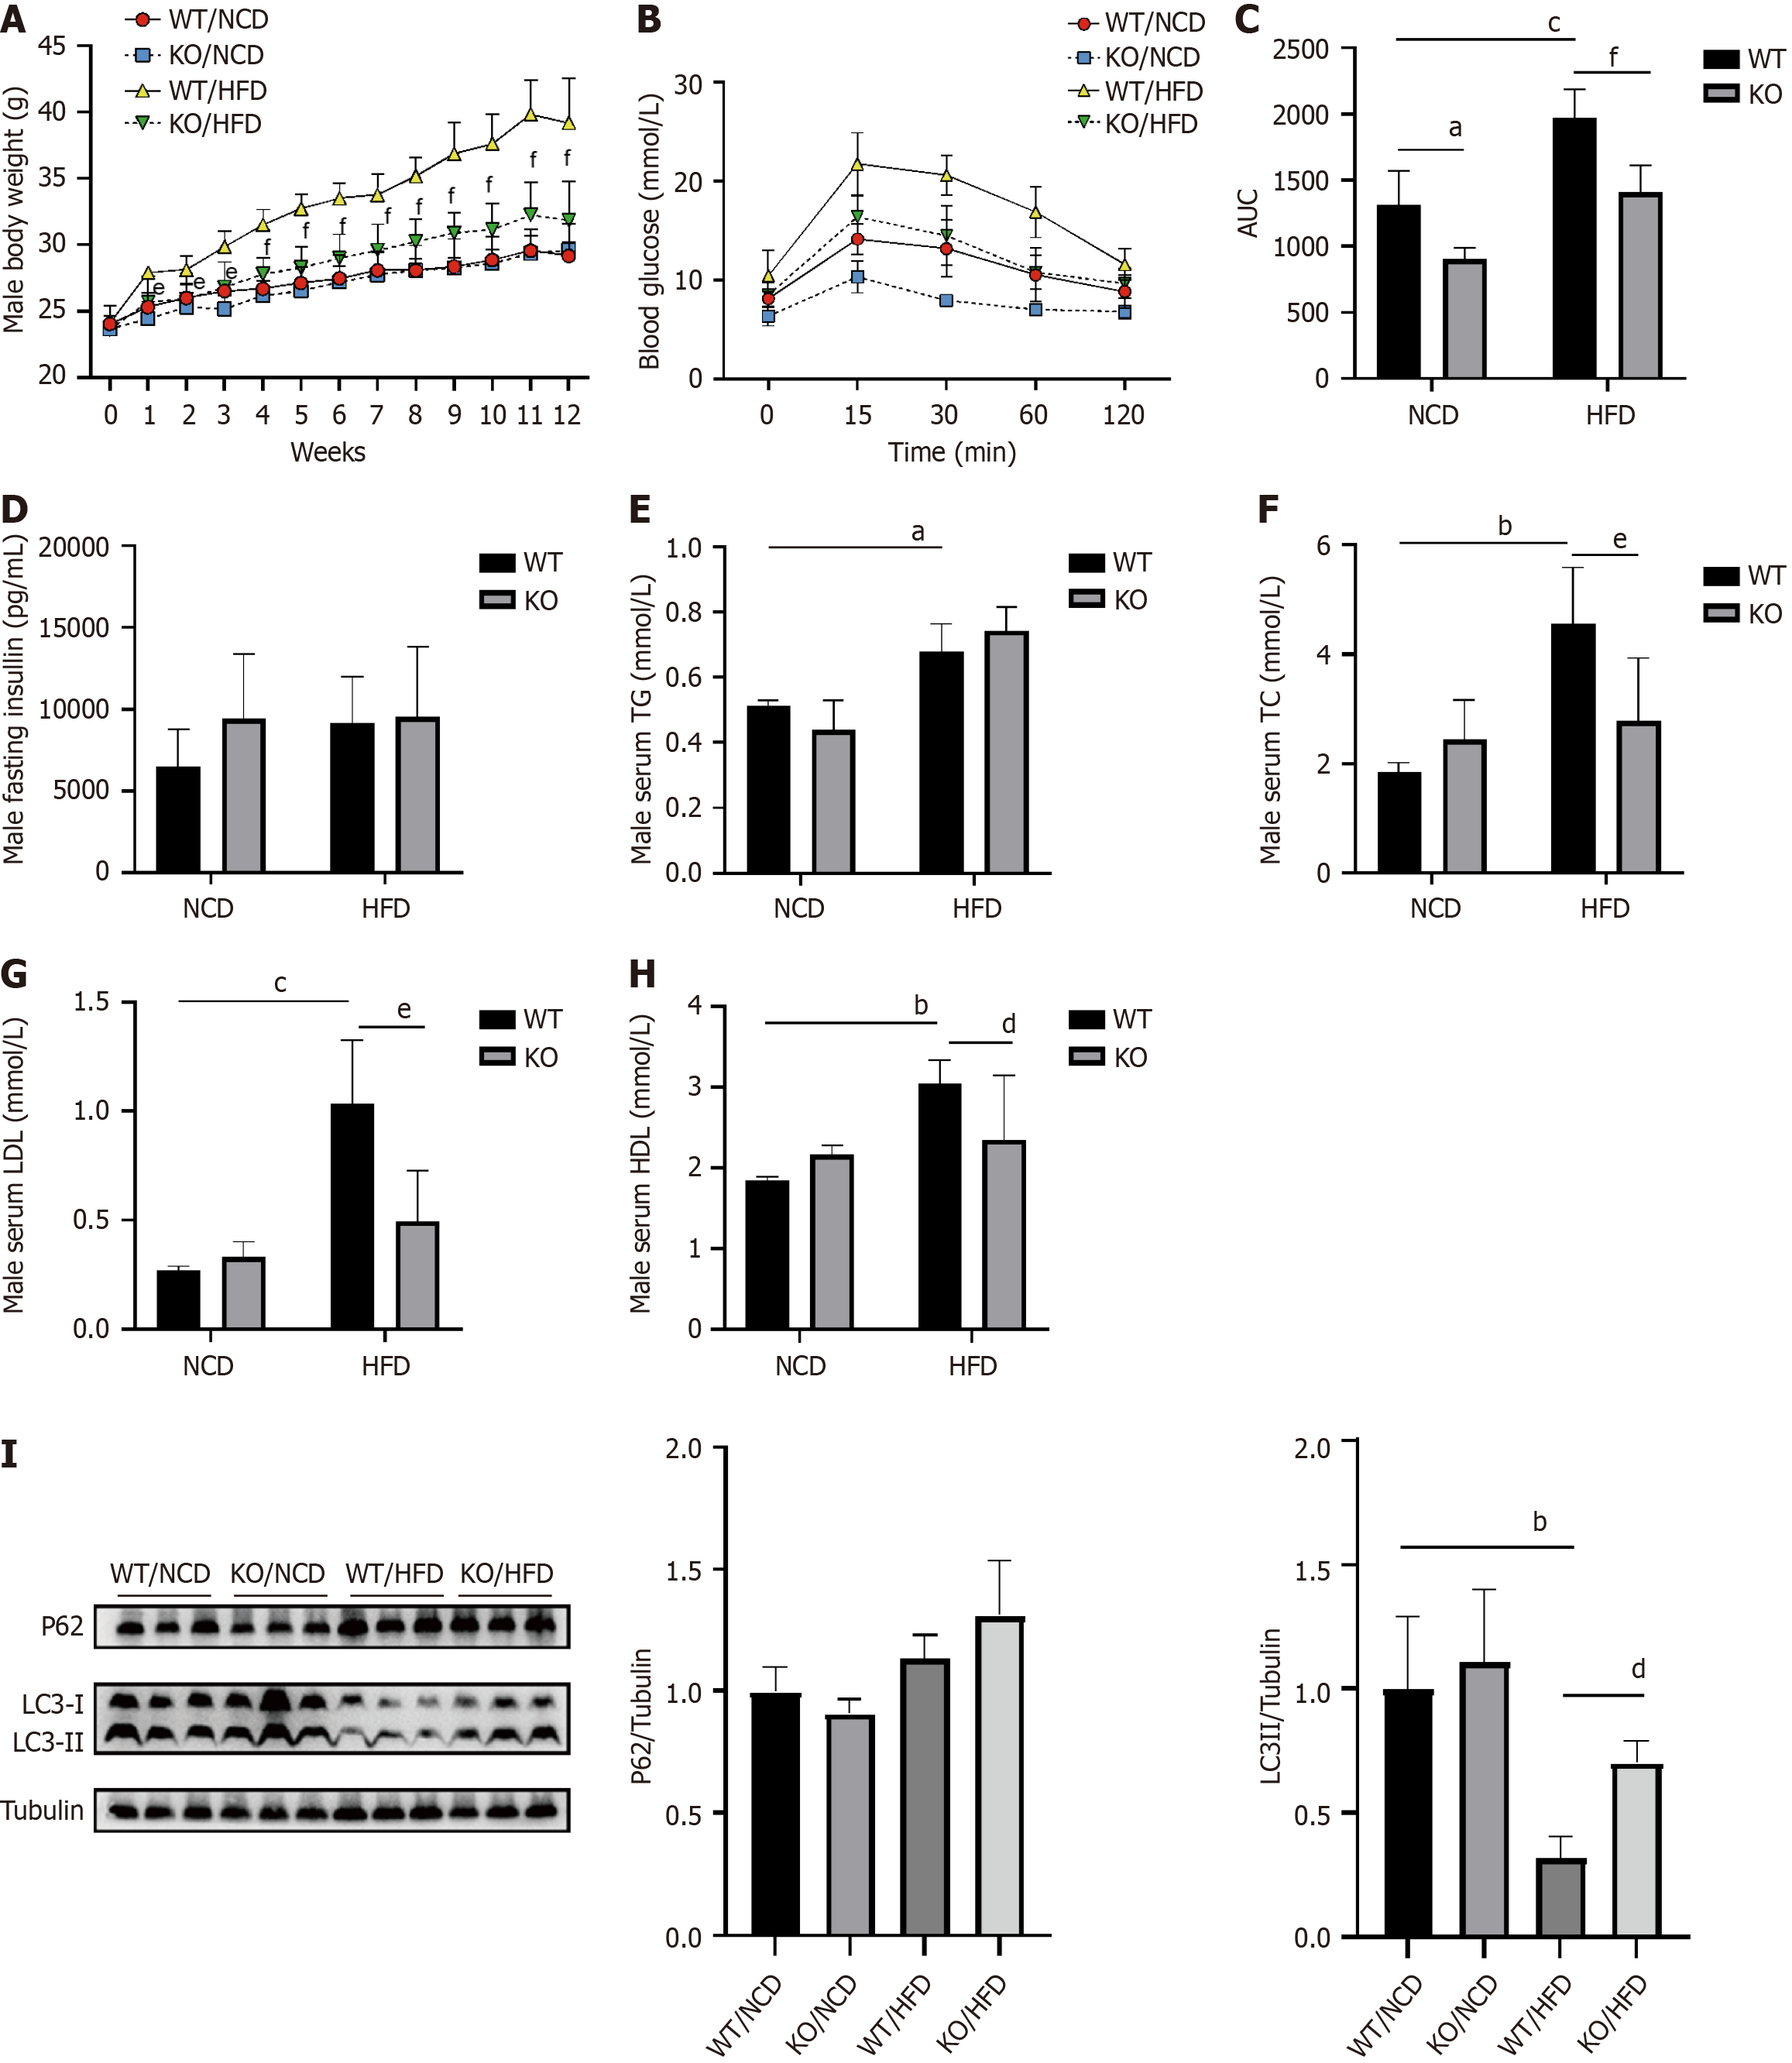
Figure 4 Knockout of the metabotropic glutamate receptor type 5 gene improved glucose and lipid metabolism and induced hepatic autophagy in high-fat diet-fed mice.
A: Weekly weights of male mice; B and C: Blood glucose curve and area under the curve of the Intraperitoneal glucose tolerance test in male mice; D: Serum insulin levels in male mice; E and F: Serum triglyceride and total cholesterol levels in male mice; G and H: Serum low-density lipoprotein and high-density lipoprotein levels in male mice; I: Western blot analysis was used to evaluate the protein expression levels of LC3 and p62 in mice livers. The data are presented as the mean ± SE. aP < 0.05 vs WT/NCD, bP < 0.01 vs WT/NCD, cP < 0.001 vs WT/NCD; dP < 0.05 vs WT/HFD, eP < 0.01 vs WT/HFD, fP < 0.001 vs WT/HFD. WT: Wild-type; KO: Knockout; HFD: High-fat diet; NCD: Normal chow diet; AUC: Area under the curve; TG: Triglyceride; TC: Total cholesterol; HDL-C: High-density lipoprotein cholesterol; LDL-C: Low-density lipoprotein cholesterol.
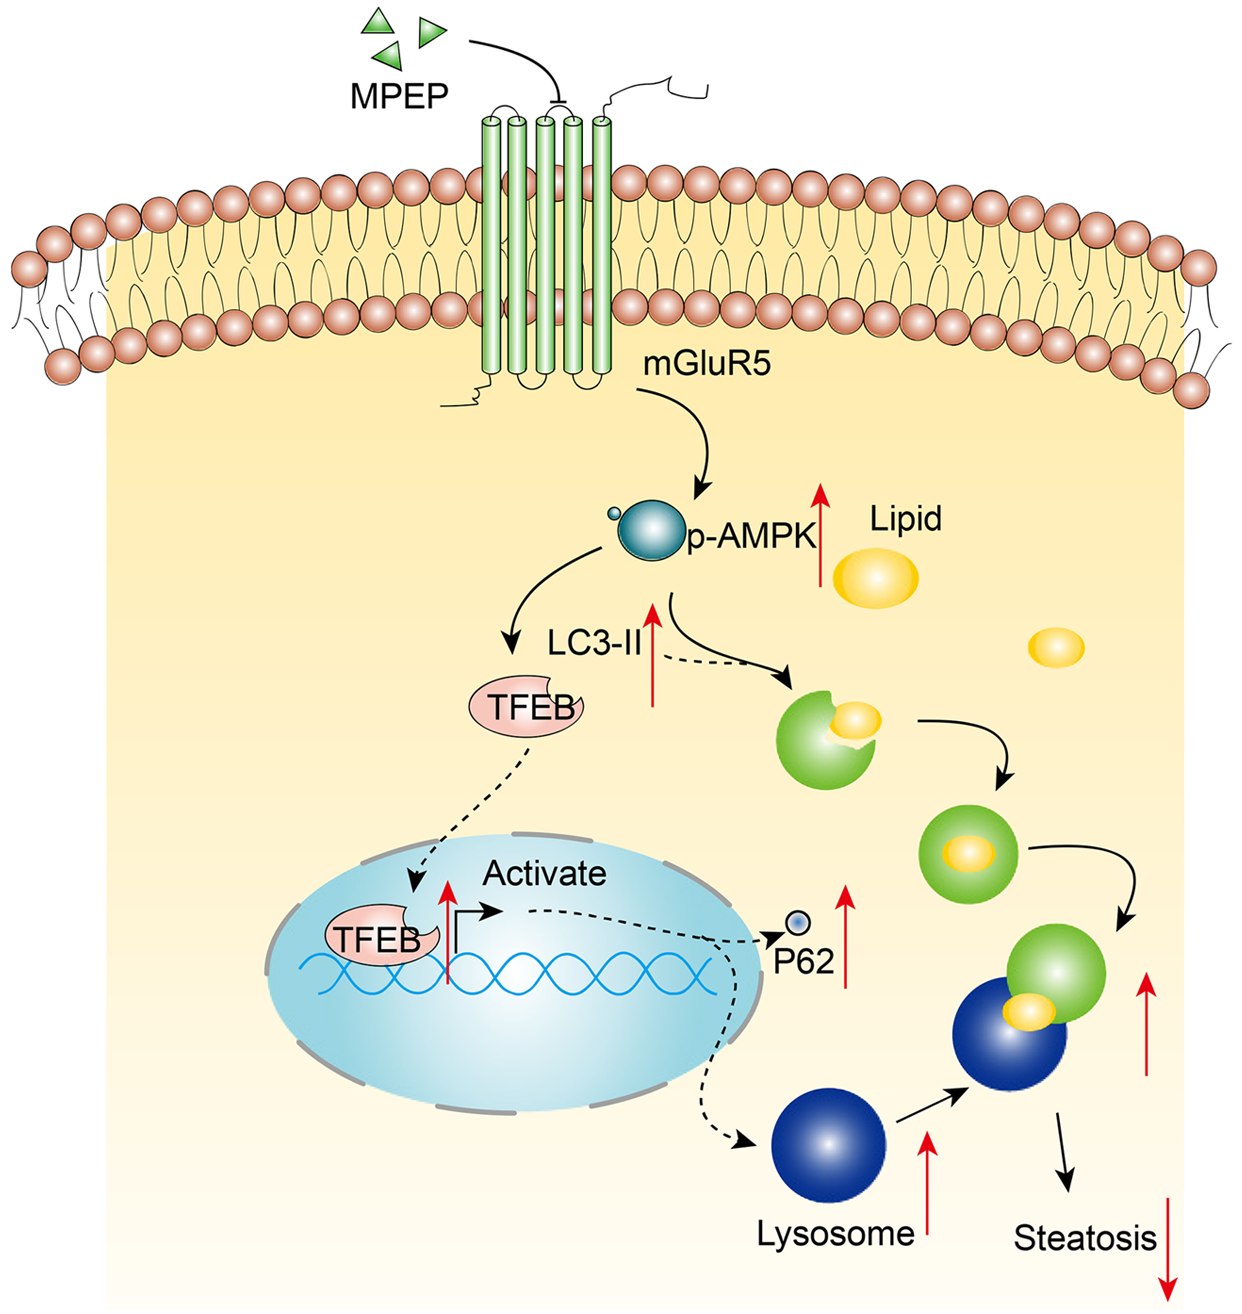
Figure 5 Schematic diagram summarizing the underlying mechanism by which metabotropic glutamate receptor type 5 alleviates hepatic steatosis.
Metabotropic glutamate receptor type 5 inhibition promotes AMPK phosphorylation, which leads to increased LC3II expression and nuclear translocation of transcription factor EB and the induction of p62 transcription, thereby activating autophagy and reducing lipid accumulation in hepatocytes. mGluR5: Metabotropic glutamate receptor type 5; TFEB: Transcription factor EB.
- Citation: Tao M, Zhang LL, Zhou GH, Wang C, Luo X. Inhibition of metabotropic glutamate receptor-5 alleviates hepatic steatosis by enhancing autophagy via activation of the AMPK signaling pathway. World J Gastroenterol 2025; 31(7): 98852
- URL: https://www.wjgnet.com/1007-9327/full/v31/i7/98852.htm
- DOI: https://dx.doi.org/10.3748/wjg.v31.i7.98852


