Copyright
©The Author(s) 2025.
World J Gastroenterol. Jan 28, 2025; 31(4): 101749
Published online Jan 28, 2025. doi: 10.3748/wjg.v31.i4.101749
Published online Jan 28, 2025. doi: 10.3748/wjg.v31.i4.101749
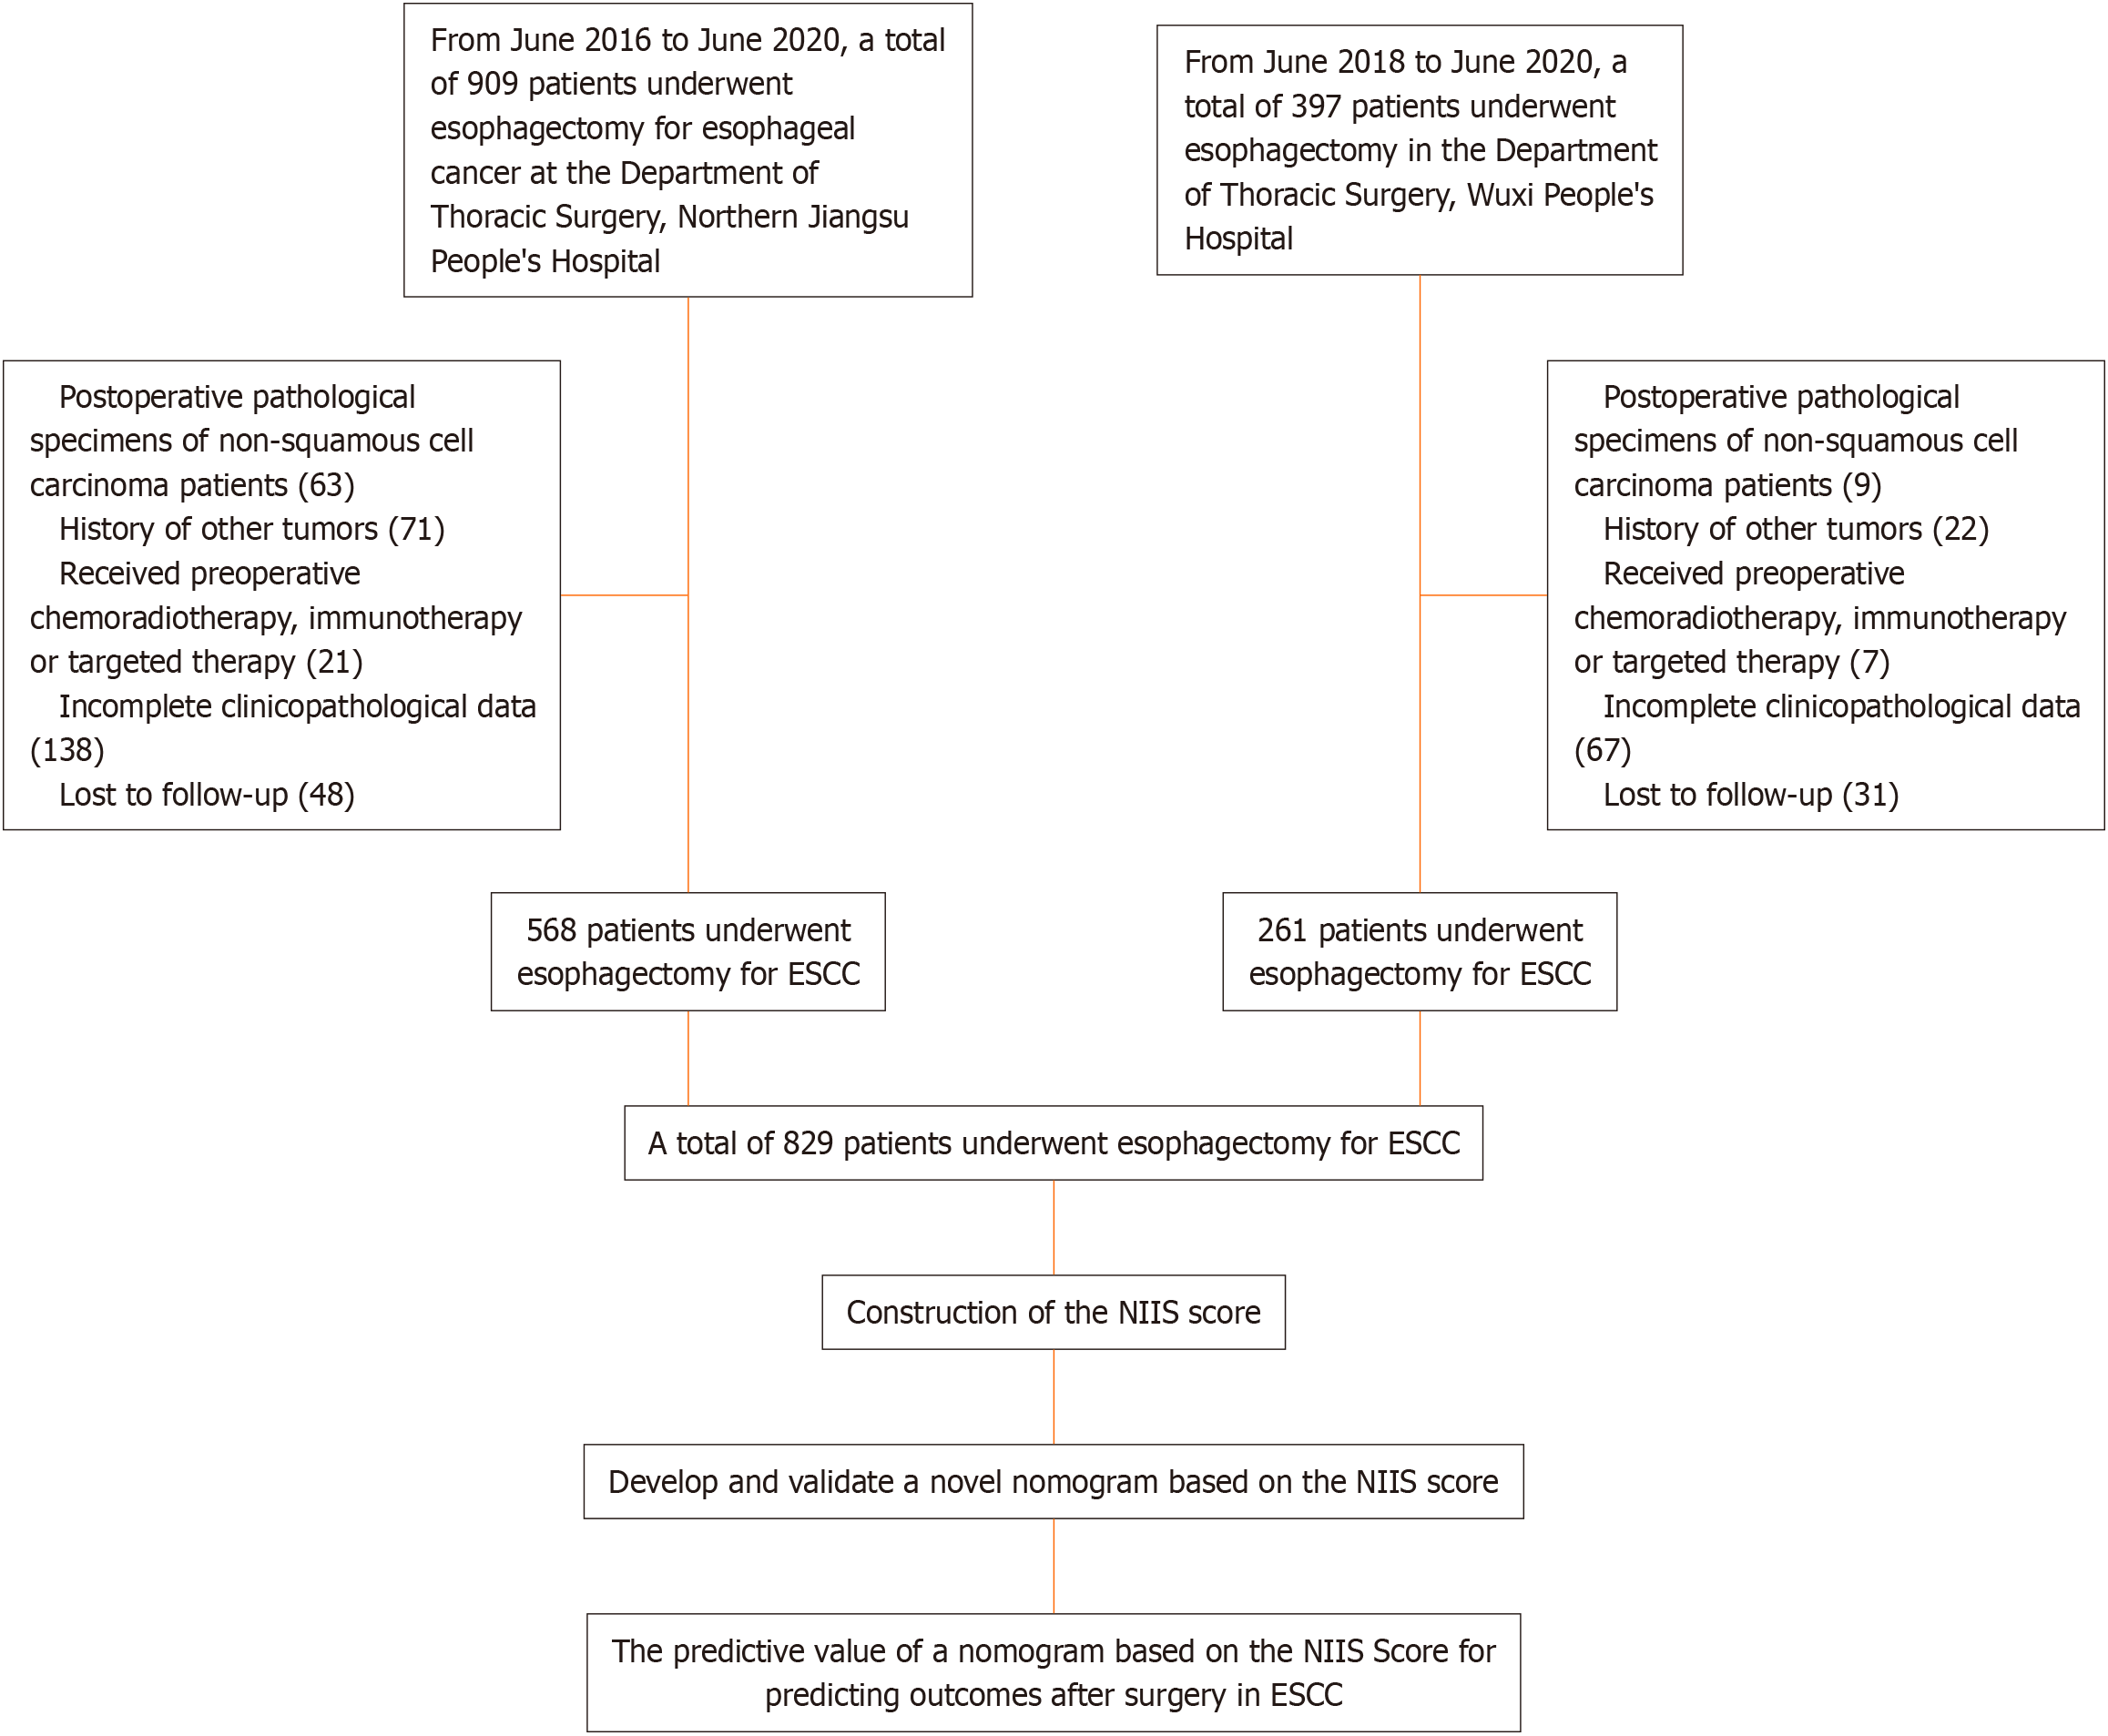
Figure 1 Flow chart of the retrospective study.
NIIS: Nutritional immune-inflammatory status; ESCC: Esophageal squamous cell carcinoma.
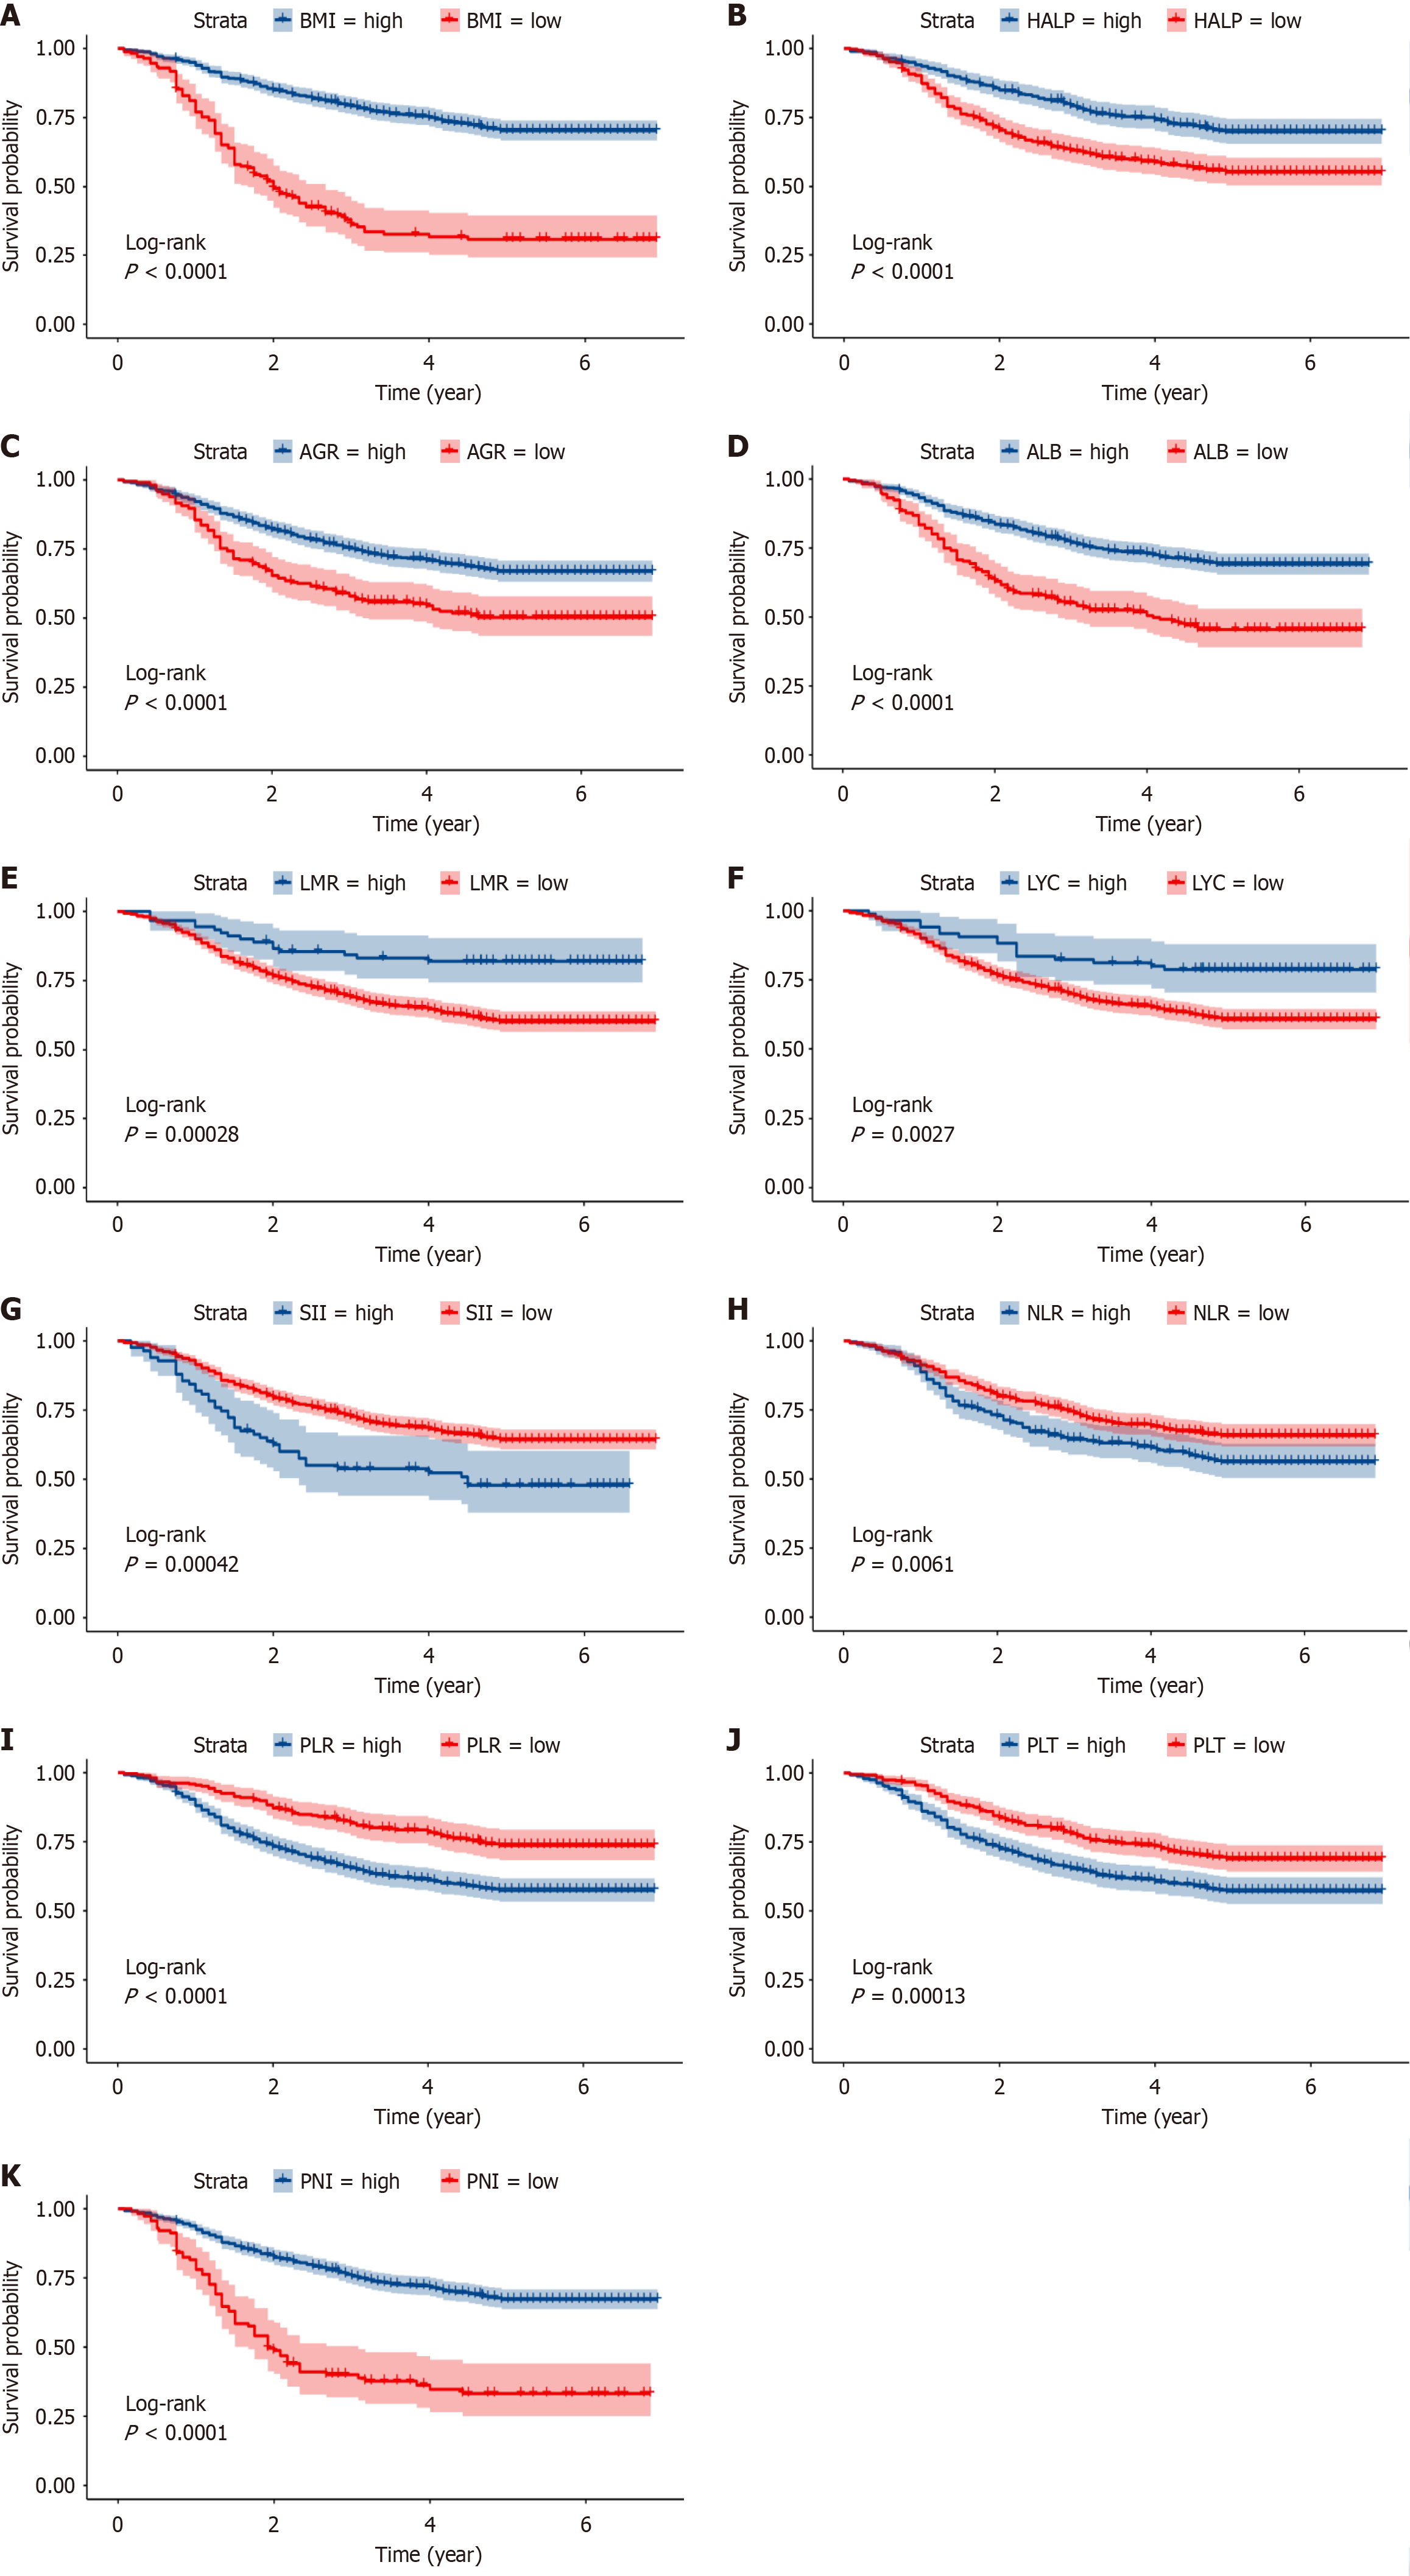
Figure 2 Kaplan-Meier curves.
A-K: Kaplan-Meier curves for overall survival (OS), stratified by (A) body mass index, (B) hemoglobin albumin (ALB) lymphocyte platelet score, (C) ALB-to-globulin ratio, (D) ALB, (E) lymphocyte-to-monocyte ratio, (F) lymphocyte count, (G) systemic immune-inflammation index, (H) neutrophil-to-lymphocyte ratio, (I) platelet-to-lymphocyte ratio, (J) platelet count, and (K) prognostic nutritional index grades in patients with esophageal squamous cell carcinoma after surgery. BMI: Body mass index; HALP: Hemoglobin albumin lymphocyte platelet score; AGR: Albumin-to-globulin ratio; ALB: Albumin; LMR: Lymphocyte-to-monocyte ratio; LYC: Lymphocyte count; SII: Systemic immune-inflammation index; NLR: Neutrophil-to-lymphocyte ratio; PLR: Platelet-to-lymphocyte ratio; PLT: Platelet count; PNI: Prognostic nutritional index.
Figure 3 Construction of the nutritional immune-inflammatory status score using the LASSO Cox regression model.
A: Heatmap of the correlations of nutritional-immune-inflammatory related biomarkers; B: LASSO coefficient profiles of the eight features; C: Optimal parameter (lambda) selection in the LASSO model is achieved through ten-fold cross-validation based on minimum criteria, with red points indicating partial likelihood values, gray lines representing standard error (SE), and vertical dashed lines marking the optimal value at 1 standard error (1-s.e.); D-E: The receiver operating characteristic (ROC) curves for predicting OS at 1-, 3-, and 5 years in the training set (D) and the validation set (E). BMI: Body mass index; PLT: Platelet count; LYC: Lymphocyte count; ALB: Albumin; NLR: Neutrophil-to-lymphocyte ratio; PLR: Platelet-to-lymphocyte ratio; LMR: Lymphocyte-to-monocyte ratio; SII: Systemic immune-inflammation index; PNI: Prognostic nutritional index; AGR: Albumin-to-globulin ratio; HALP: Hemoglobin albumin lymphocyte platelet score; AUC: Area under curve.
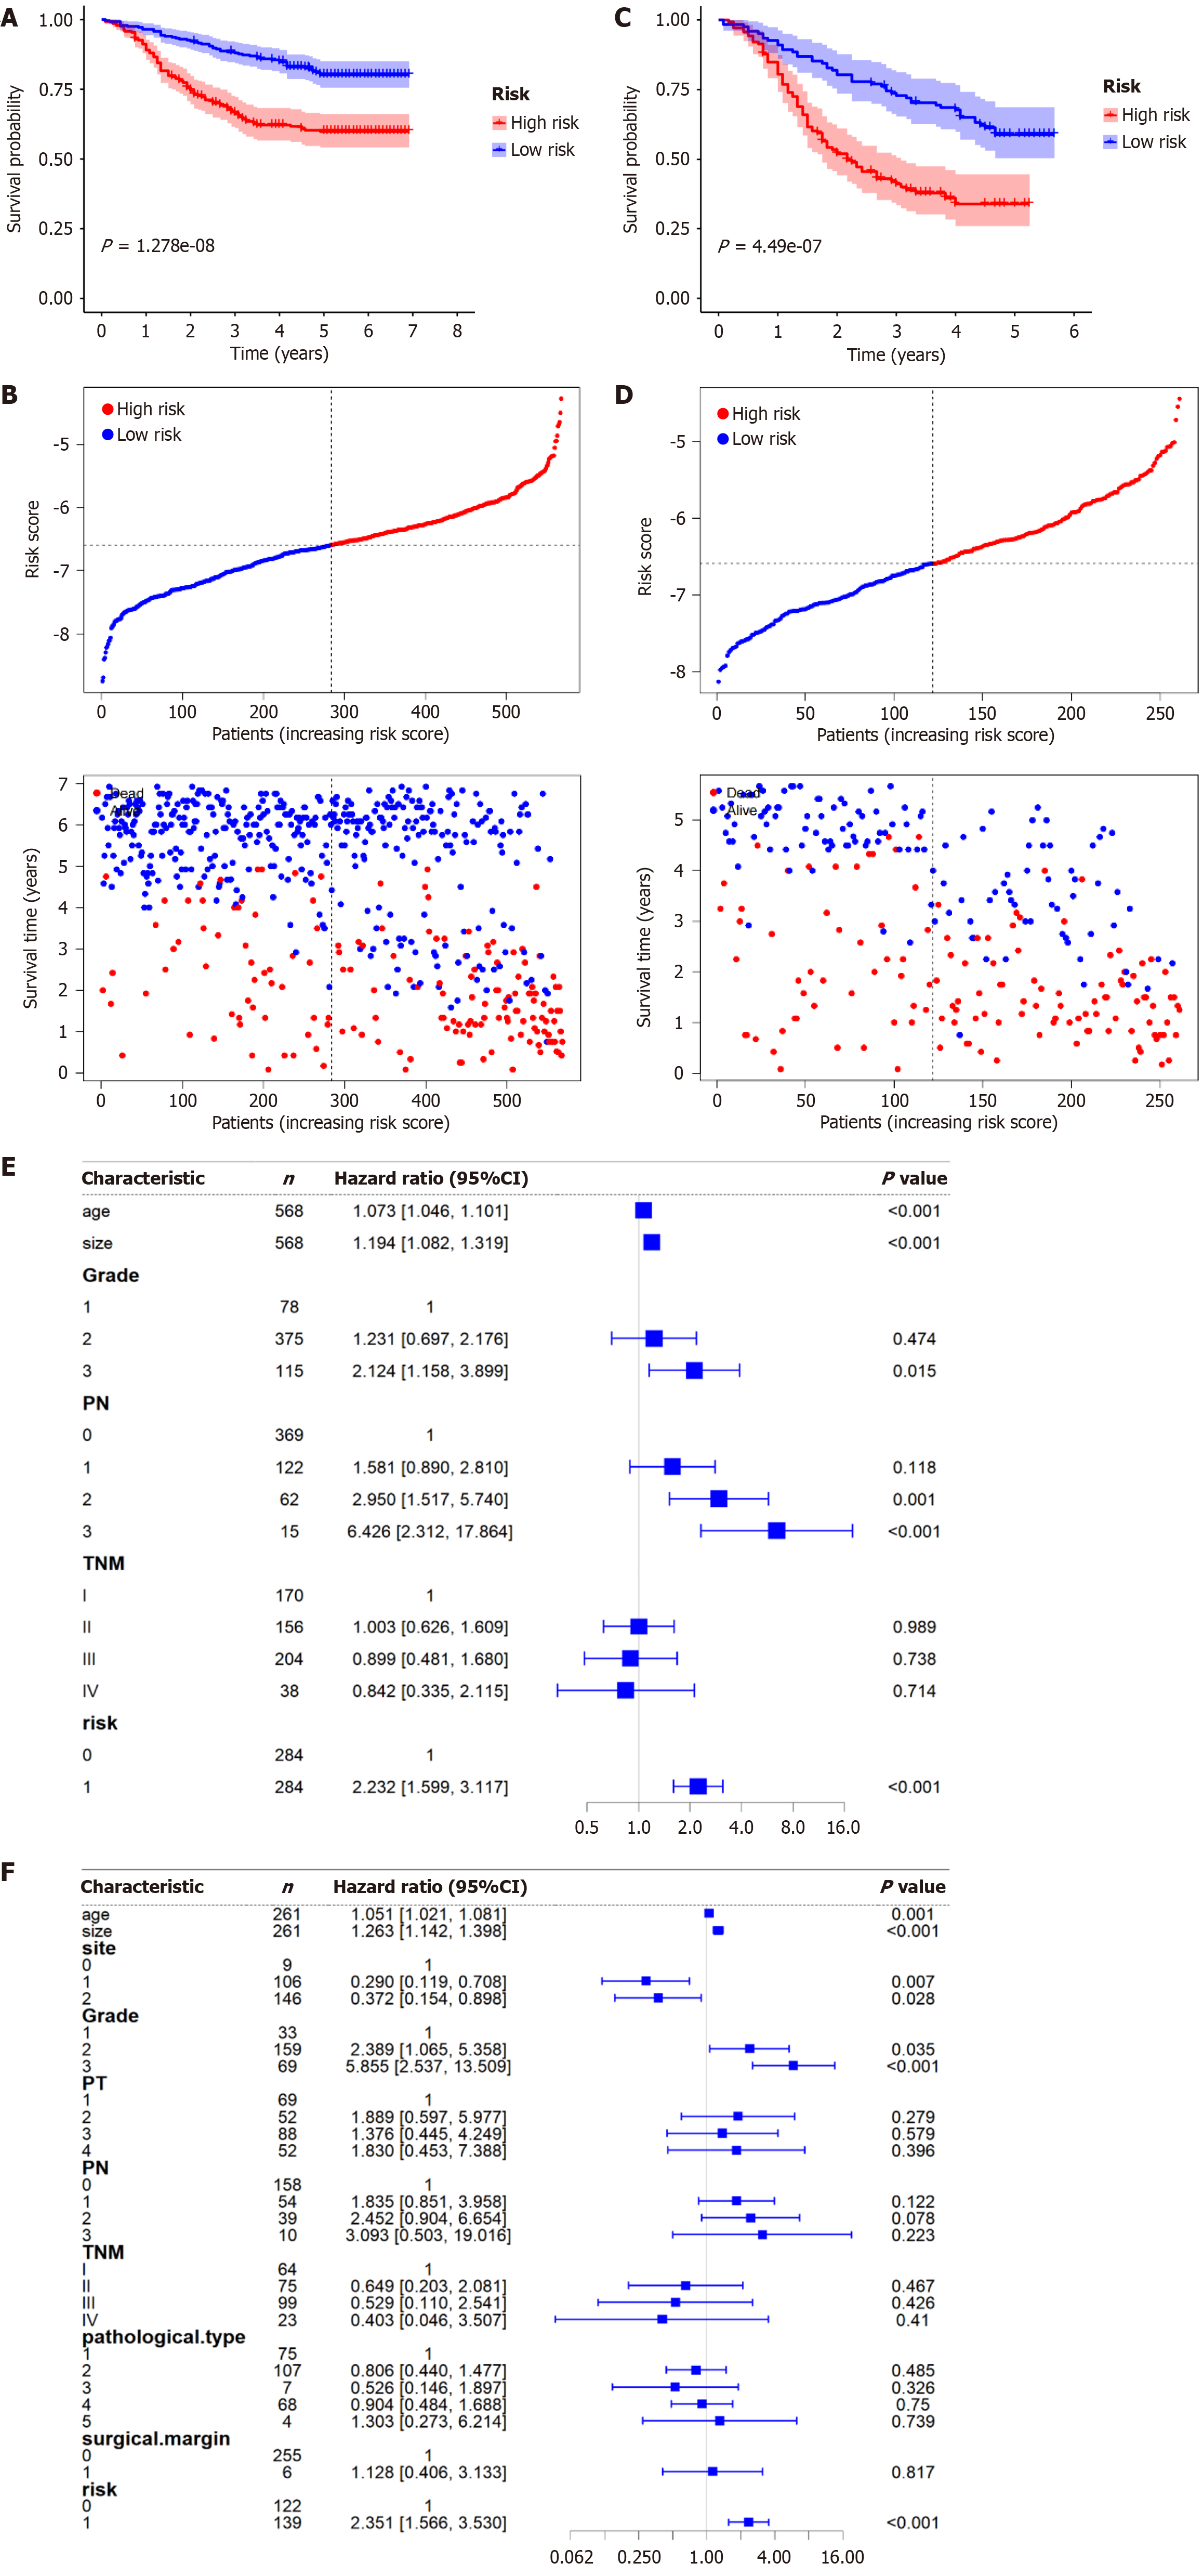
Figure 4 Prognostic implications of the nutritional immune-inflammatory status score.
A and B: The Kaplan-Meier curves of overall survival (OS; A) and the distribution of survival status (B) for patients in the low- and high-risk groups based on the nutritional immune-inflammatory status (NIIS) score in the training set; C and D: The Kaplan-Meier curves of OS (C) and the distribution of survival status (D) for patients in the low- and high-risk groups based on the NIIS score in the validation set; E: Forest plot of multivariable Cox regression analysis of OS in the training set; F: Forest plot of multivariable Cox regression analysis of OS in the validation set. 95%CI: 95% confidence intervals.
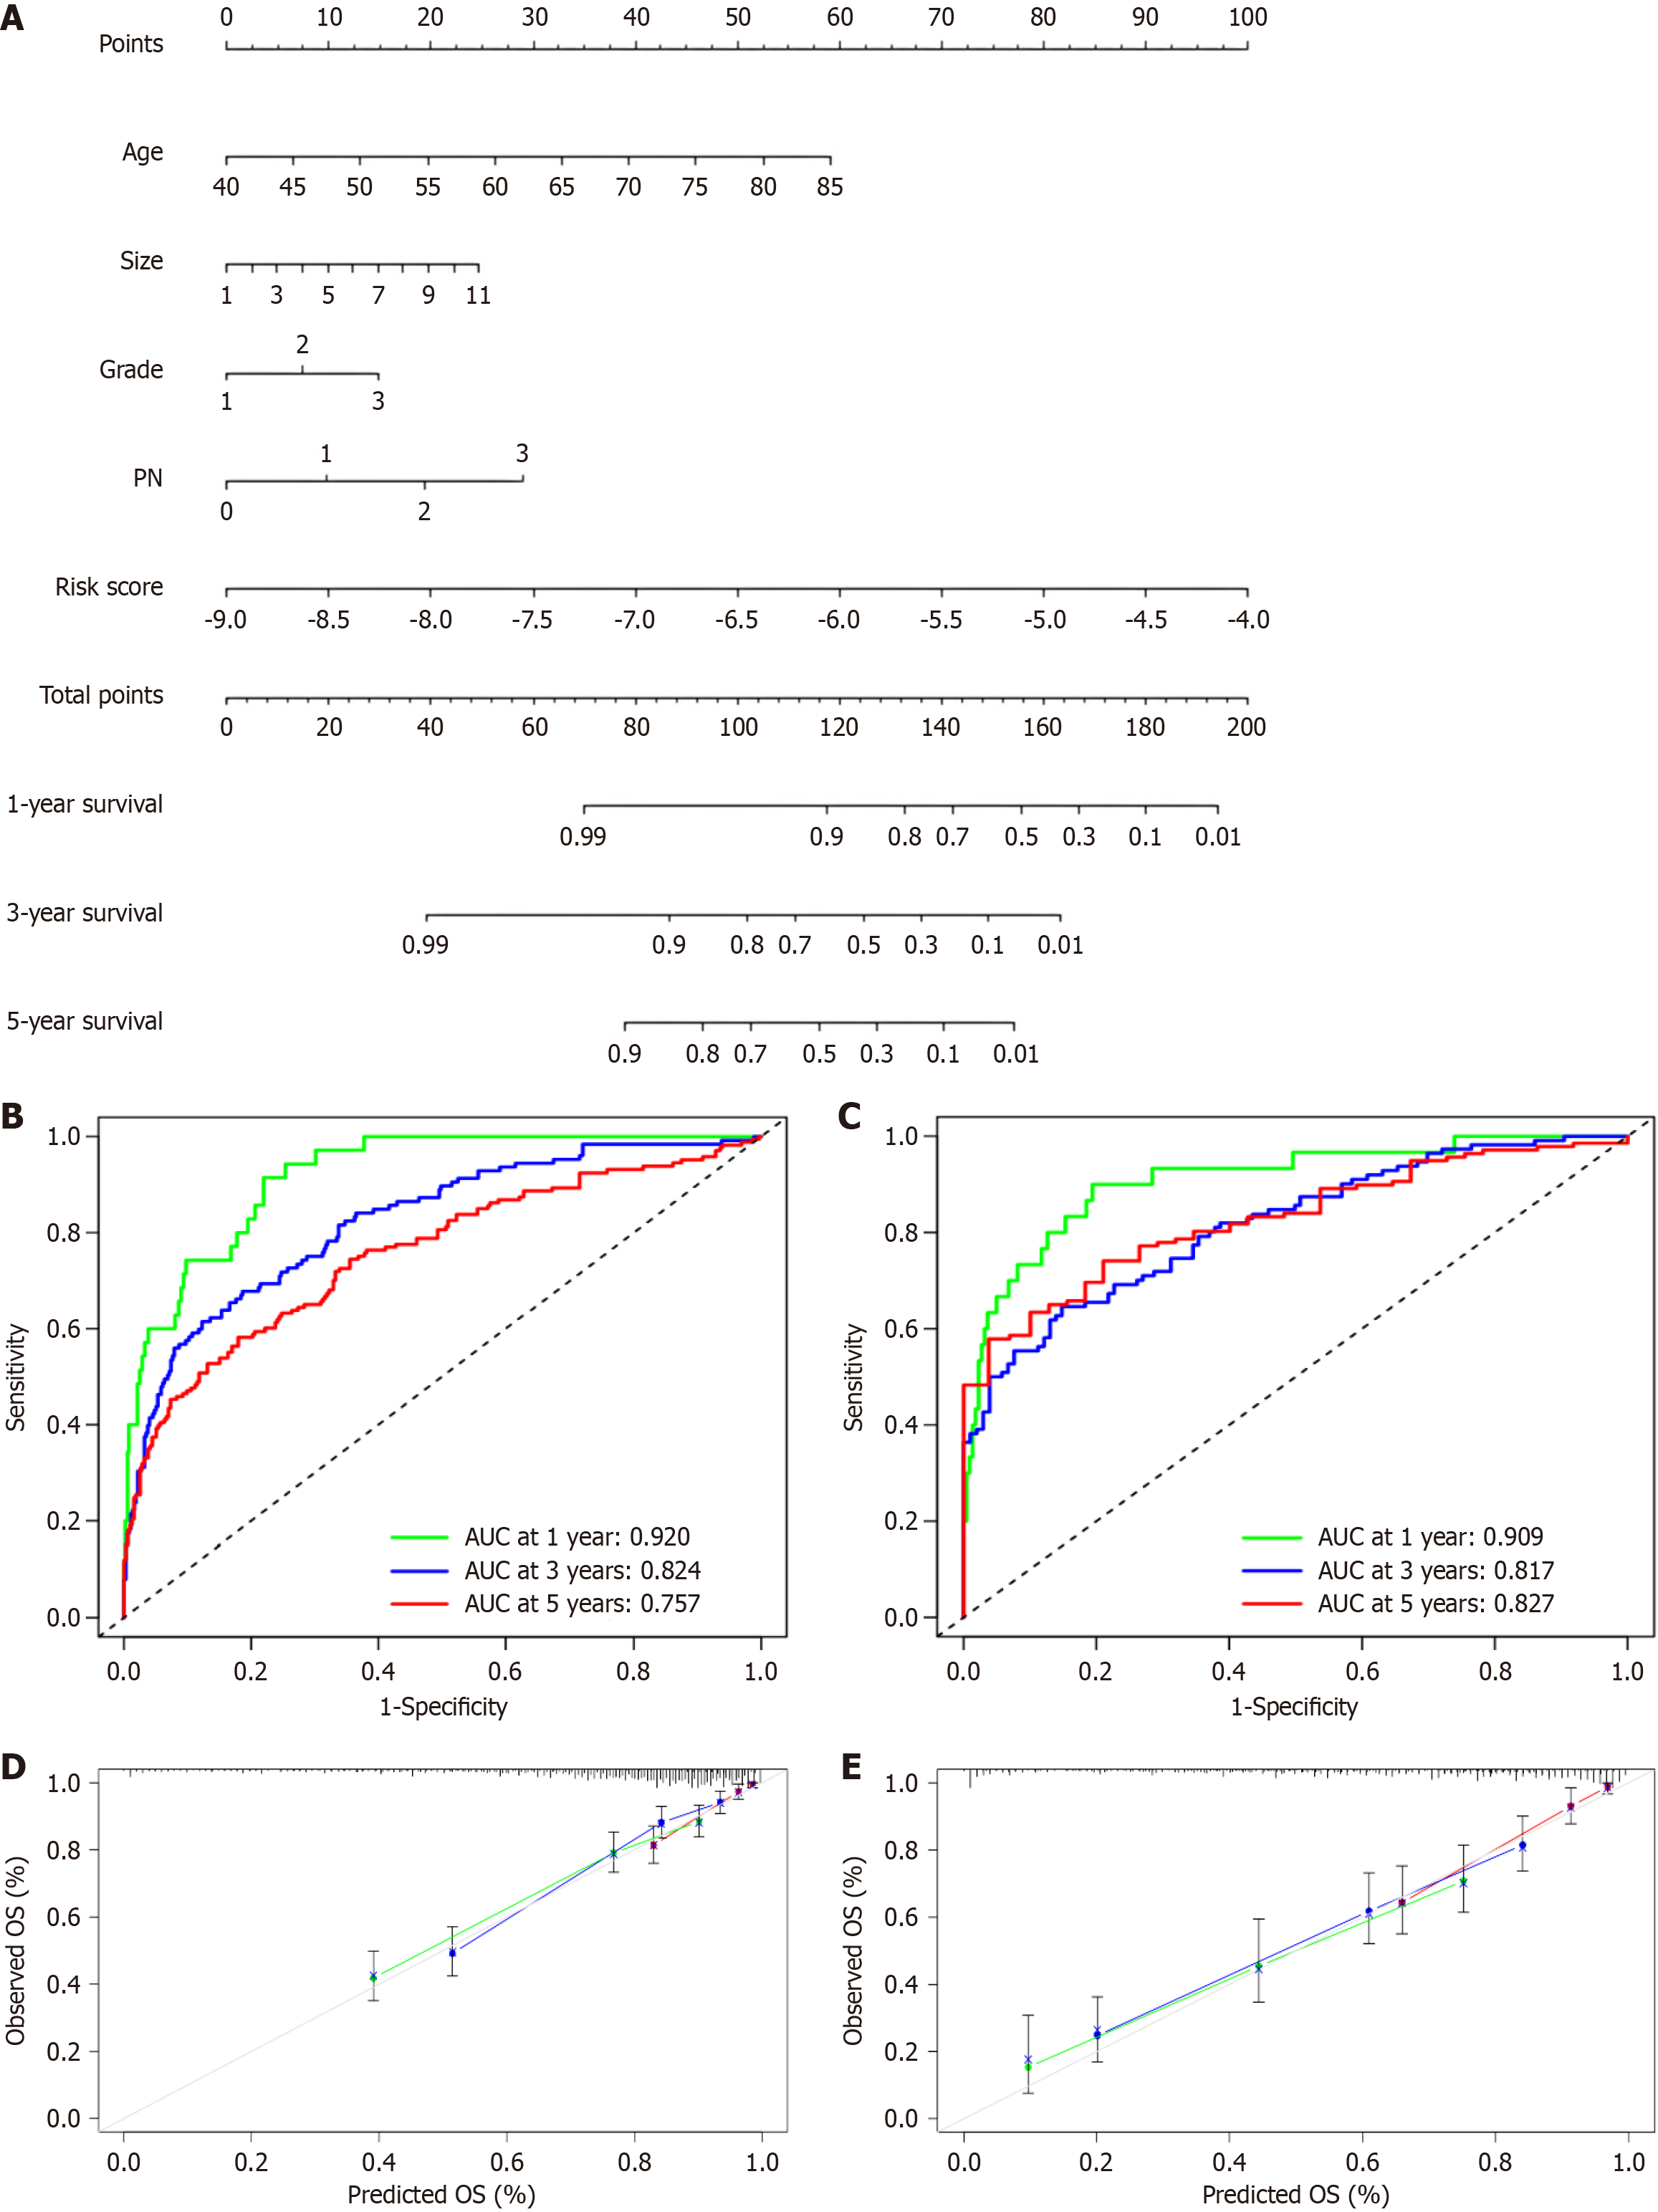
Figure 5 Development and validation of nutritional immune-inflammatory status-nomograms.
A: Nomograms incorporating the nutritional immune-inflammatory status (NIIS) score and other clinicopathological parameters for overall survival (OS); B: NIIS-nomogram receiver operating characteristic (ROC) curve for predicting the 1-, 3-, and 5- years OS in the training set; C: NIIS-nomogram ROC curve for predicting the 1-, 3-, and 5- years OS in the validation set; D: NIIS-nomogram calibration curve: Predicted and observed 1-, 3-, and 5- years OS in the training set; E: NIIS-nomogram calibration curve: Predicted and observed 1-, 3-, and 5- years OS in the validation set. AUC: Area under curve; OS: Overall survival.
Figure 6 Decision curve analysis of overall survival prediction using the nutritional immune-inflammatory status-nomogram and rationality analysis of the nomogram model.
A-F: Decision curve analysis (DCA) of the nomogram, nutritional immune-inflammatory status (NIIS) score, size, age, grade, and pN stage for 1-year overall survival (OS; A); 3-year OS (C); and 5-year OS (E) in the training set. DCA of the nomogram, NIIS score, size, age, Grade, and pN stage for 1-year OS (B); 3-year OS (D); and 5-year OS (F) in the validation set.
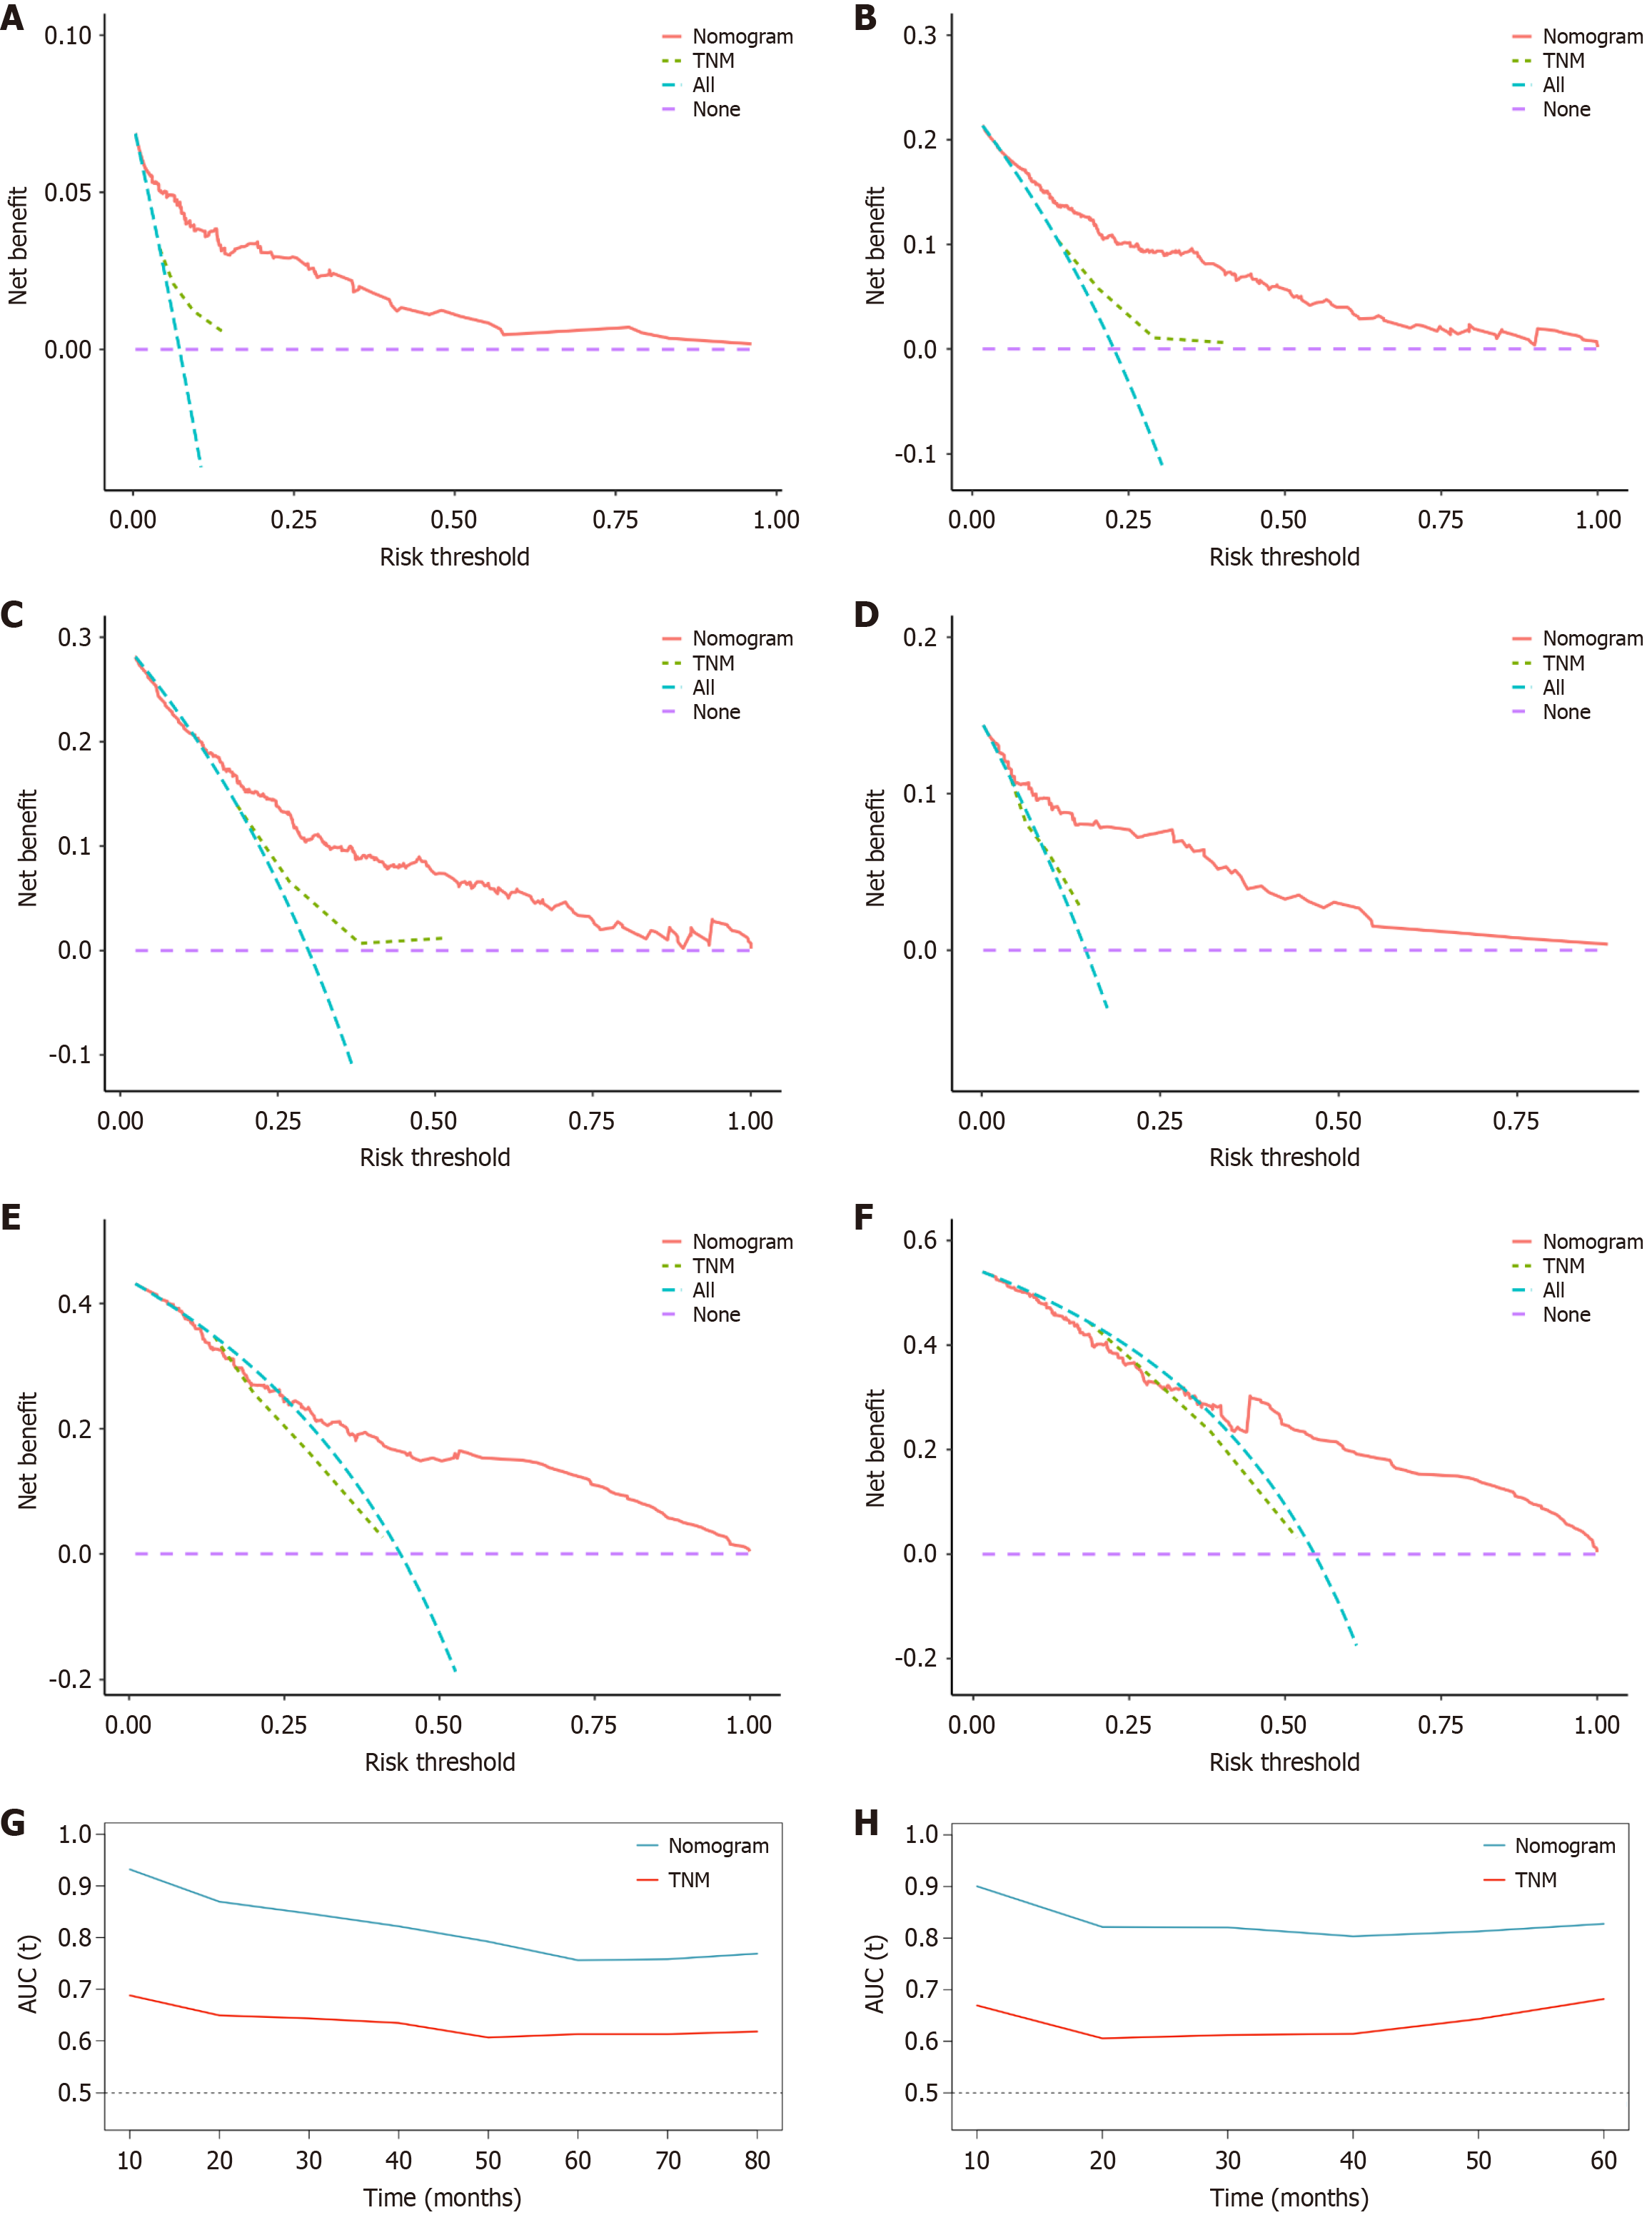
Figure 7 Decision curve analysis of overall survival prediction by nutritional immune-inflammatory status-nomogram and the UICC/TNM staging system A-C: Decision curve analysis (DCA) of the nomogram and the UICC/TNM staging system for 1-year overall survival (OS; A); 3-year OS (B); and 5-year OS (C) in the training set; D-F: DCA of the nomogram and the UICC/TNM staging system for 1-year OS (D); 3-year OS (E); and 5-year OS (F) in the validation set; G and H: Time-dependent area under curves of the nutritional immune-inflammatory status-nomogram and the UICC/TNM staging system for predicting OS in the training set (G) and validation set (H).
- Citation: Liu QW, Liu L, Hu JX, Hou JQ, He WB, Shu YS, Wang XL. Nomogram based on a novel nutritional immune-inflammatory status score to predict postoperative outcomes in esophageal squamous cell carcinoma. World J Gastroenterol 2025; 31(4): 101749
- URL: https://www.wjgnet.com/1007-9327/full/v31/i4/101749.htm
- DOI: https://dx.doi.org/10.3748/wjg.v31.i4.101749


