Copyright
©The Author(s) 2025.
World J Gastroenterol. Jan 21, 2025; 31(3): 102283
Published online Jan 21, 2025. doi: 10.3748/wjg.v31.i3.102283
Published online Jan 21, 2025. doi: 10.3748/wjg.v31.i3.102283
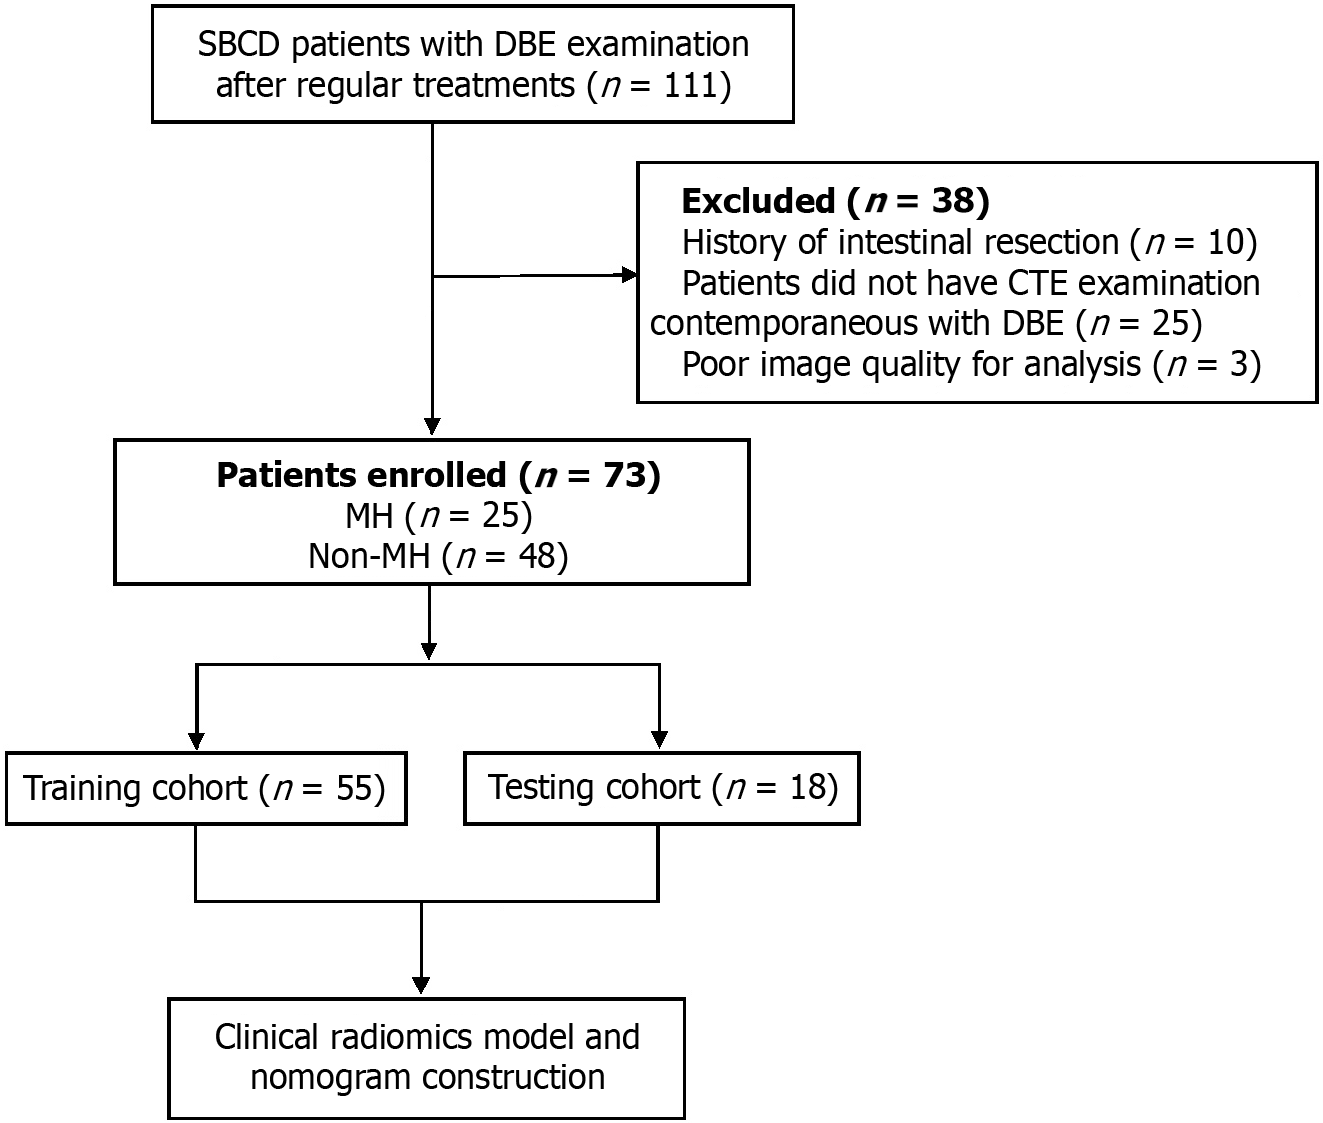
Figure 1 Flowchart of this study.
MH: Mucosal healing; SBCD: Small bowel in Crohn's disease; CTE: Computed tomography enterography; DBE: Double-balloon endoscopy.
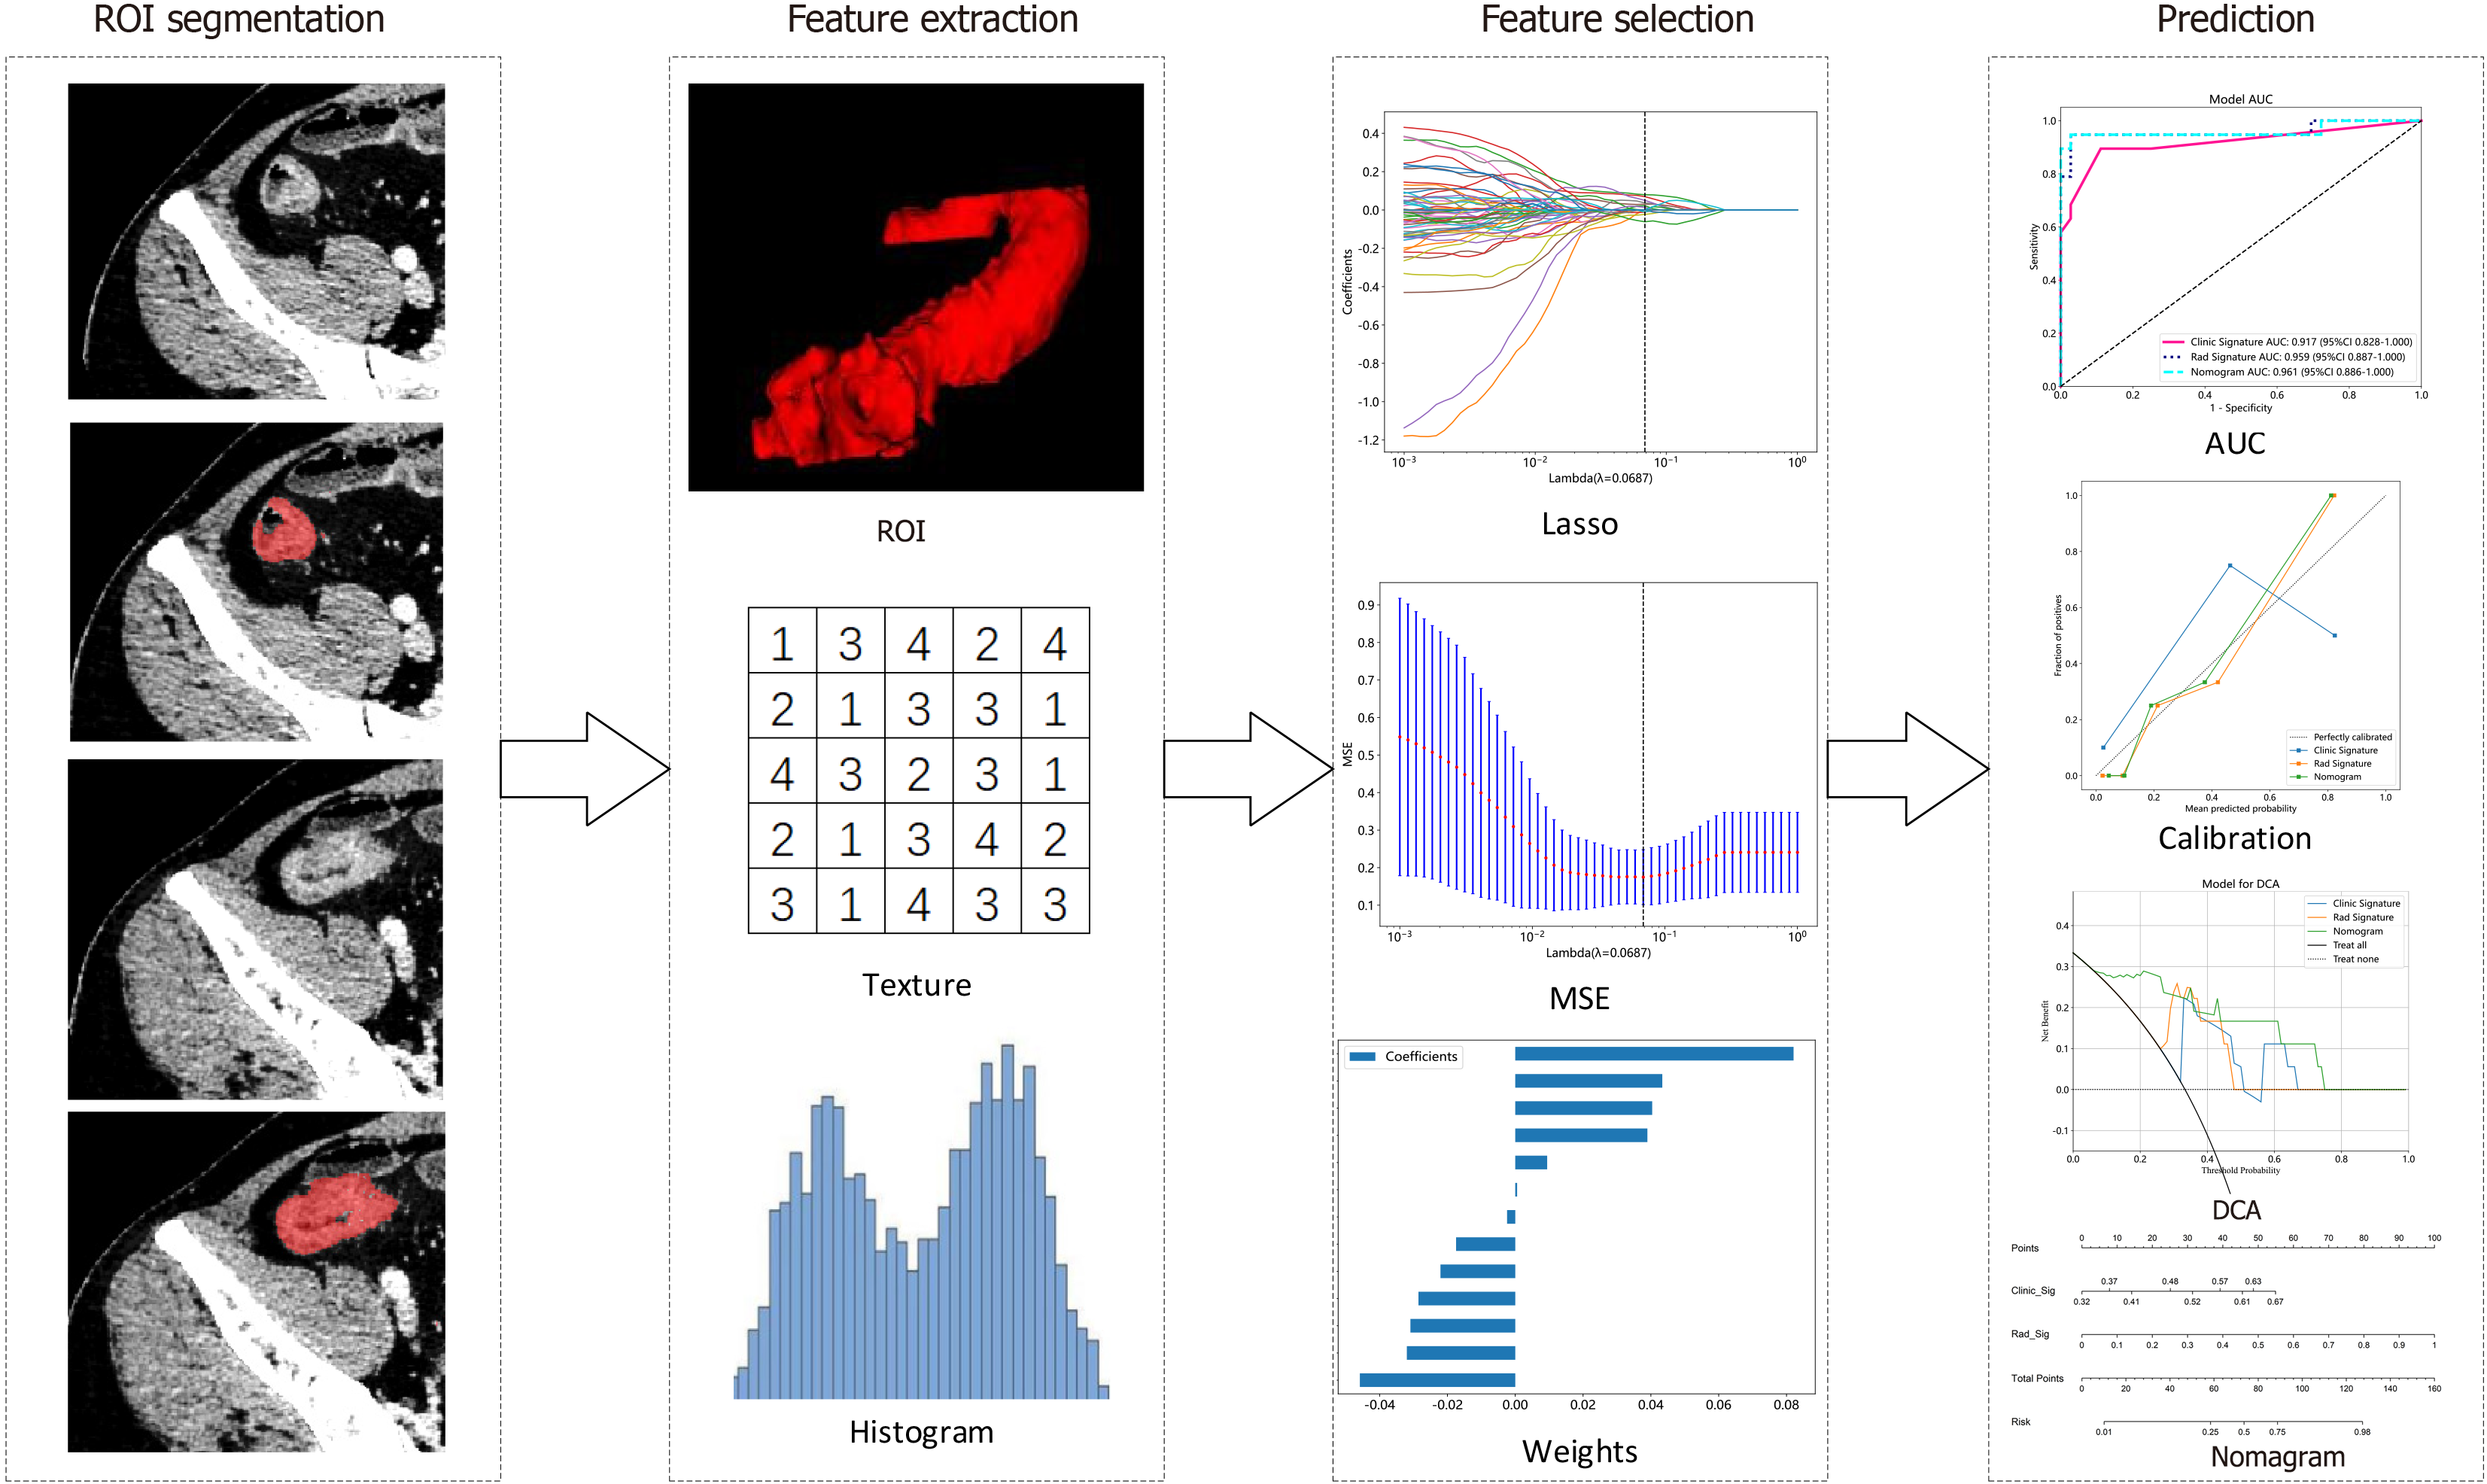
Figure 2 Workflow of the radiomic analysis in this study.
AUC: Area under the receiver operator characteristics curve; DCA: Decision curve analyses; LASSO: Least absolute shrinkage and selection operator; MSE: Mean standard error; ROI: Region of interest.
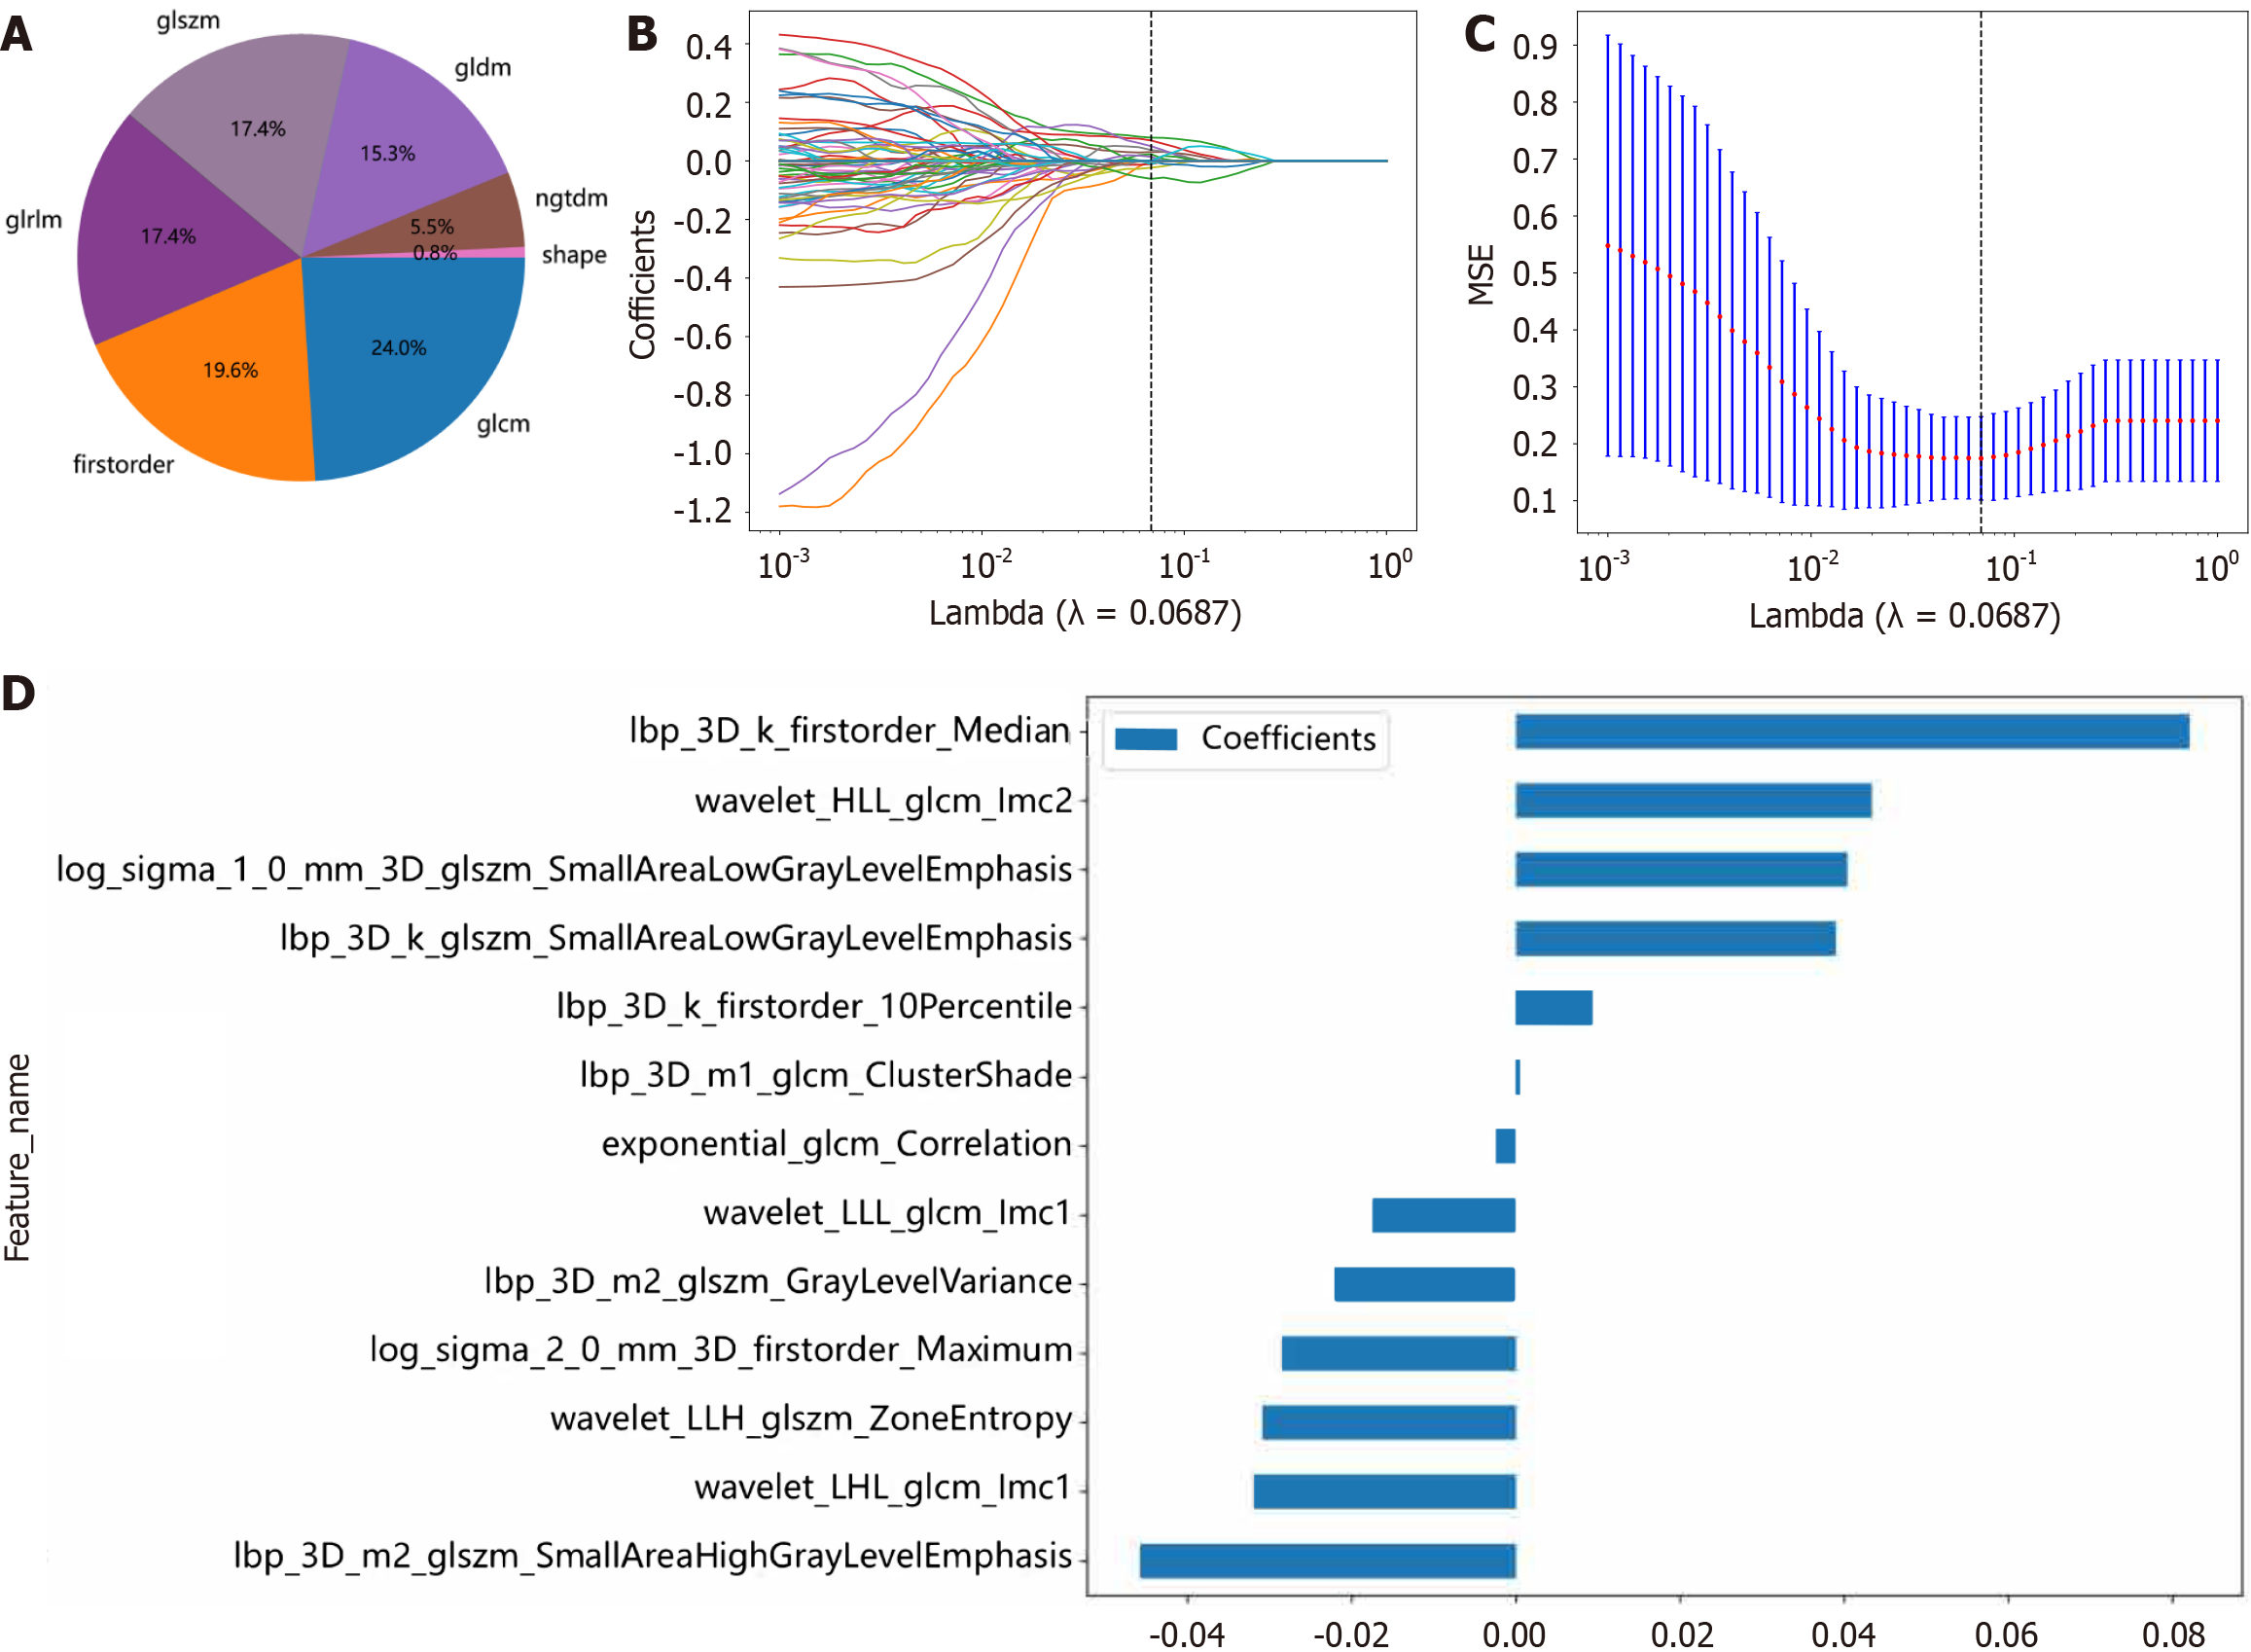
Figure 3 Radiomic feature selection via the least absolute shrinkage and selection operator regression model.
A: The proportional distribution of radiomic features; B: least absolute shrinkage and selection operator coefficient profiles; C: Mean standard error of 10-fold validation; D: Histogram of the coefficients of the selected radiomic features. MSE: Mean standard error.
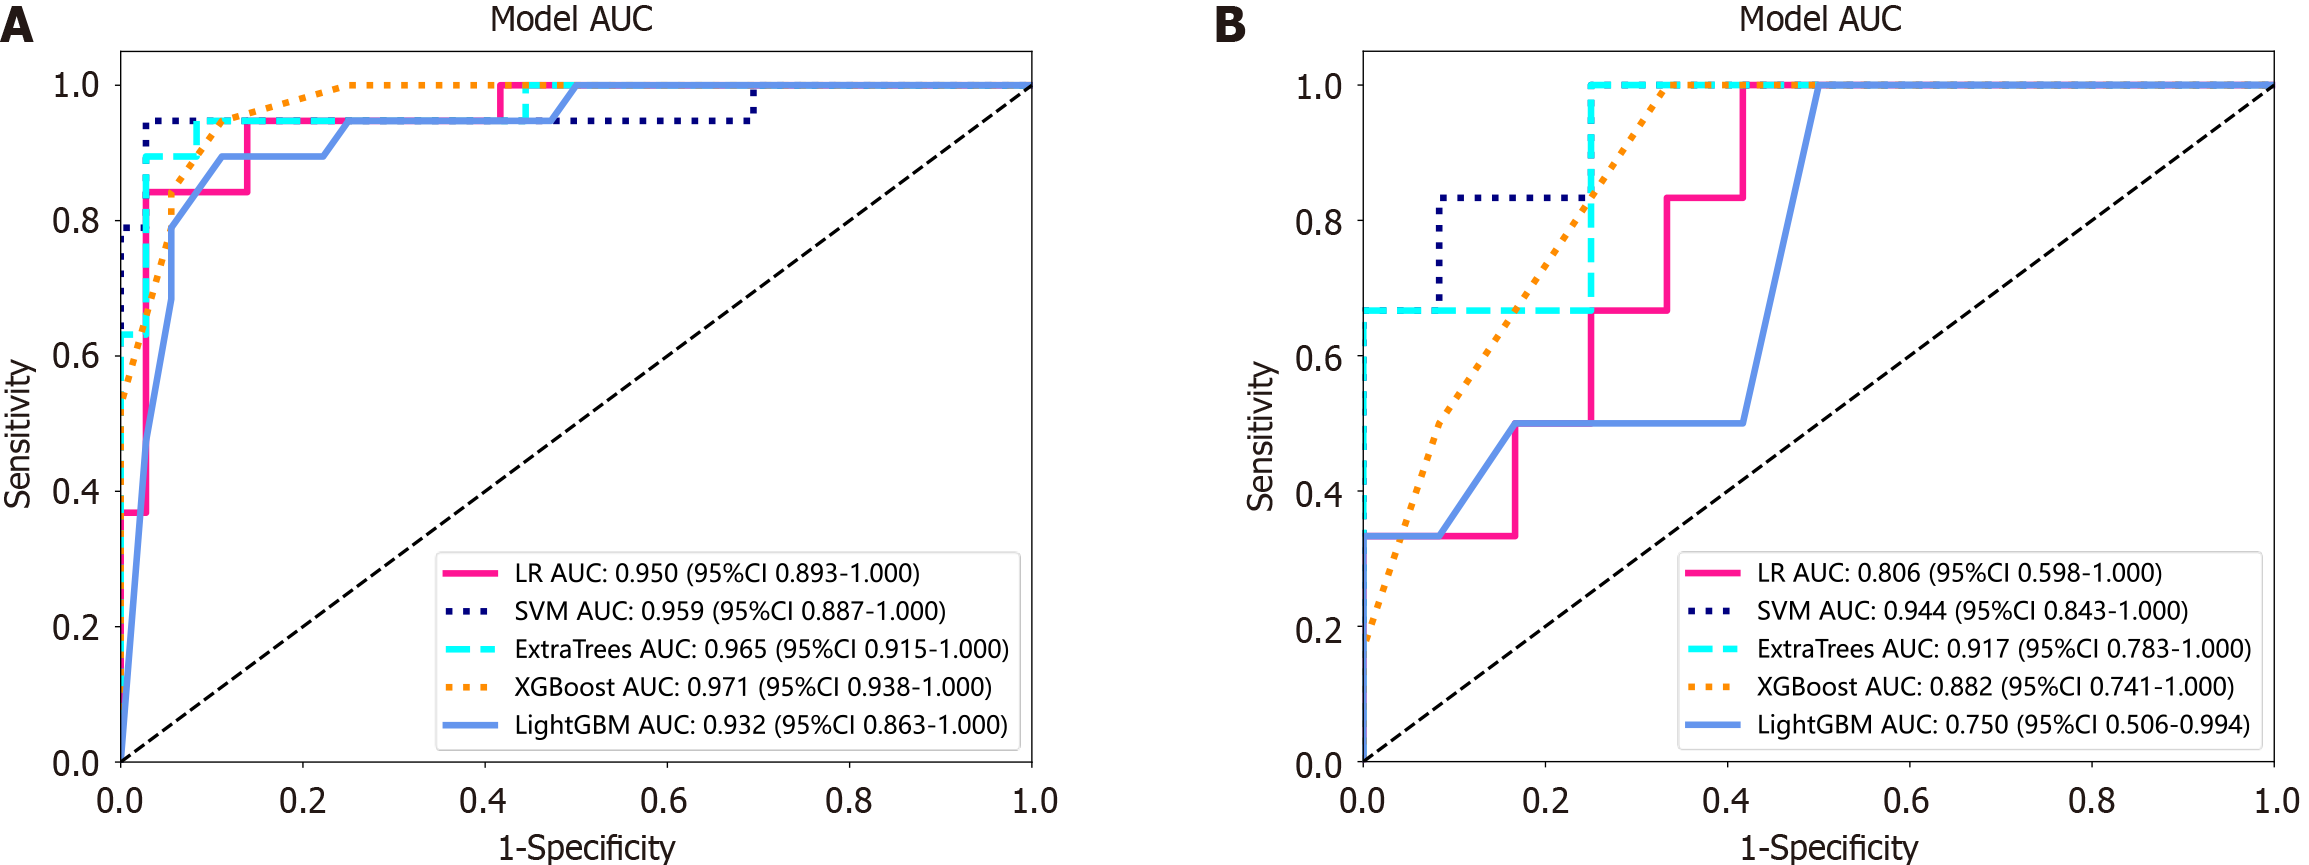
Figure 4 Receiver operating characteristic curves of the radiomic signature based on different machine learning models.
A: Receiver operating characteristic (ROC) curves in the training cohort; B: ROC curves in the test cohort. AUC: Area under the receiver operating characteristic curve; LR; Logistic regression; SVM: Support vector machine; ExtraTrees: Extremely randomized trees; XGBoost: Extreme gradient boosting; LightGBM: Light gradient boosting machine; 95%CI: 95% confidence interval.
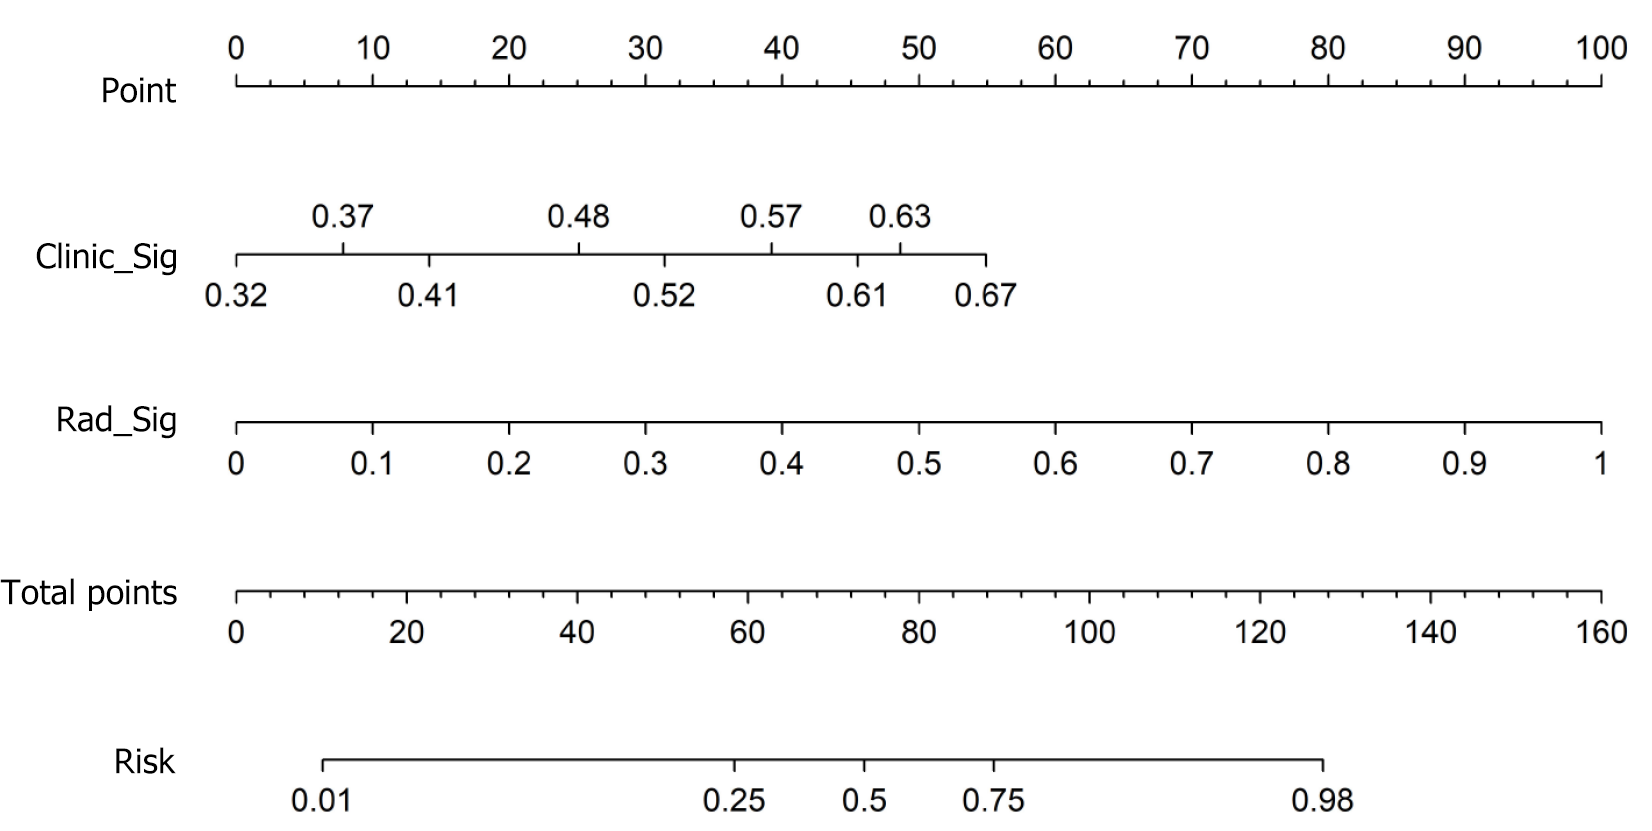
Figure 5 Radiomic-clinical nomogram for assessing mucosal healing in small bowel in Crohn's disease patients.
Clinic_Sig: Clinical signature; Rad_Sig: Radiomic signature.
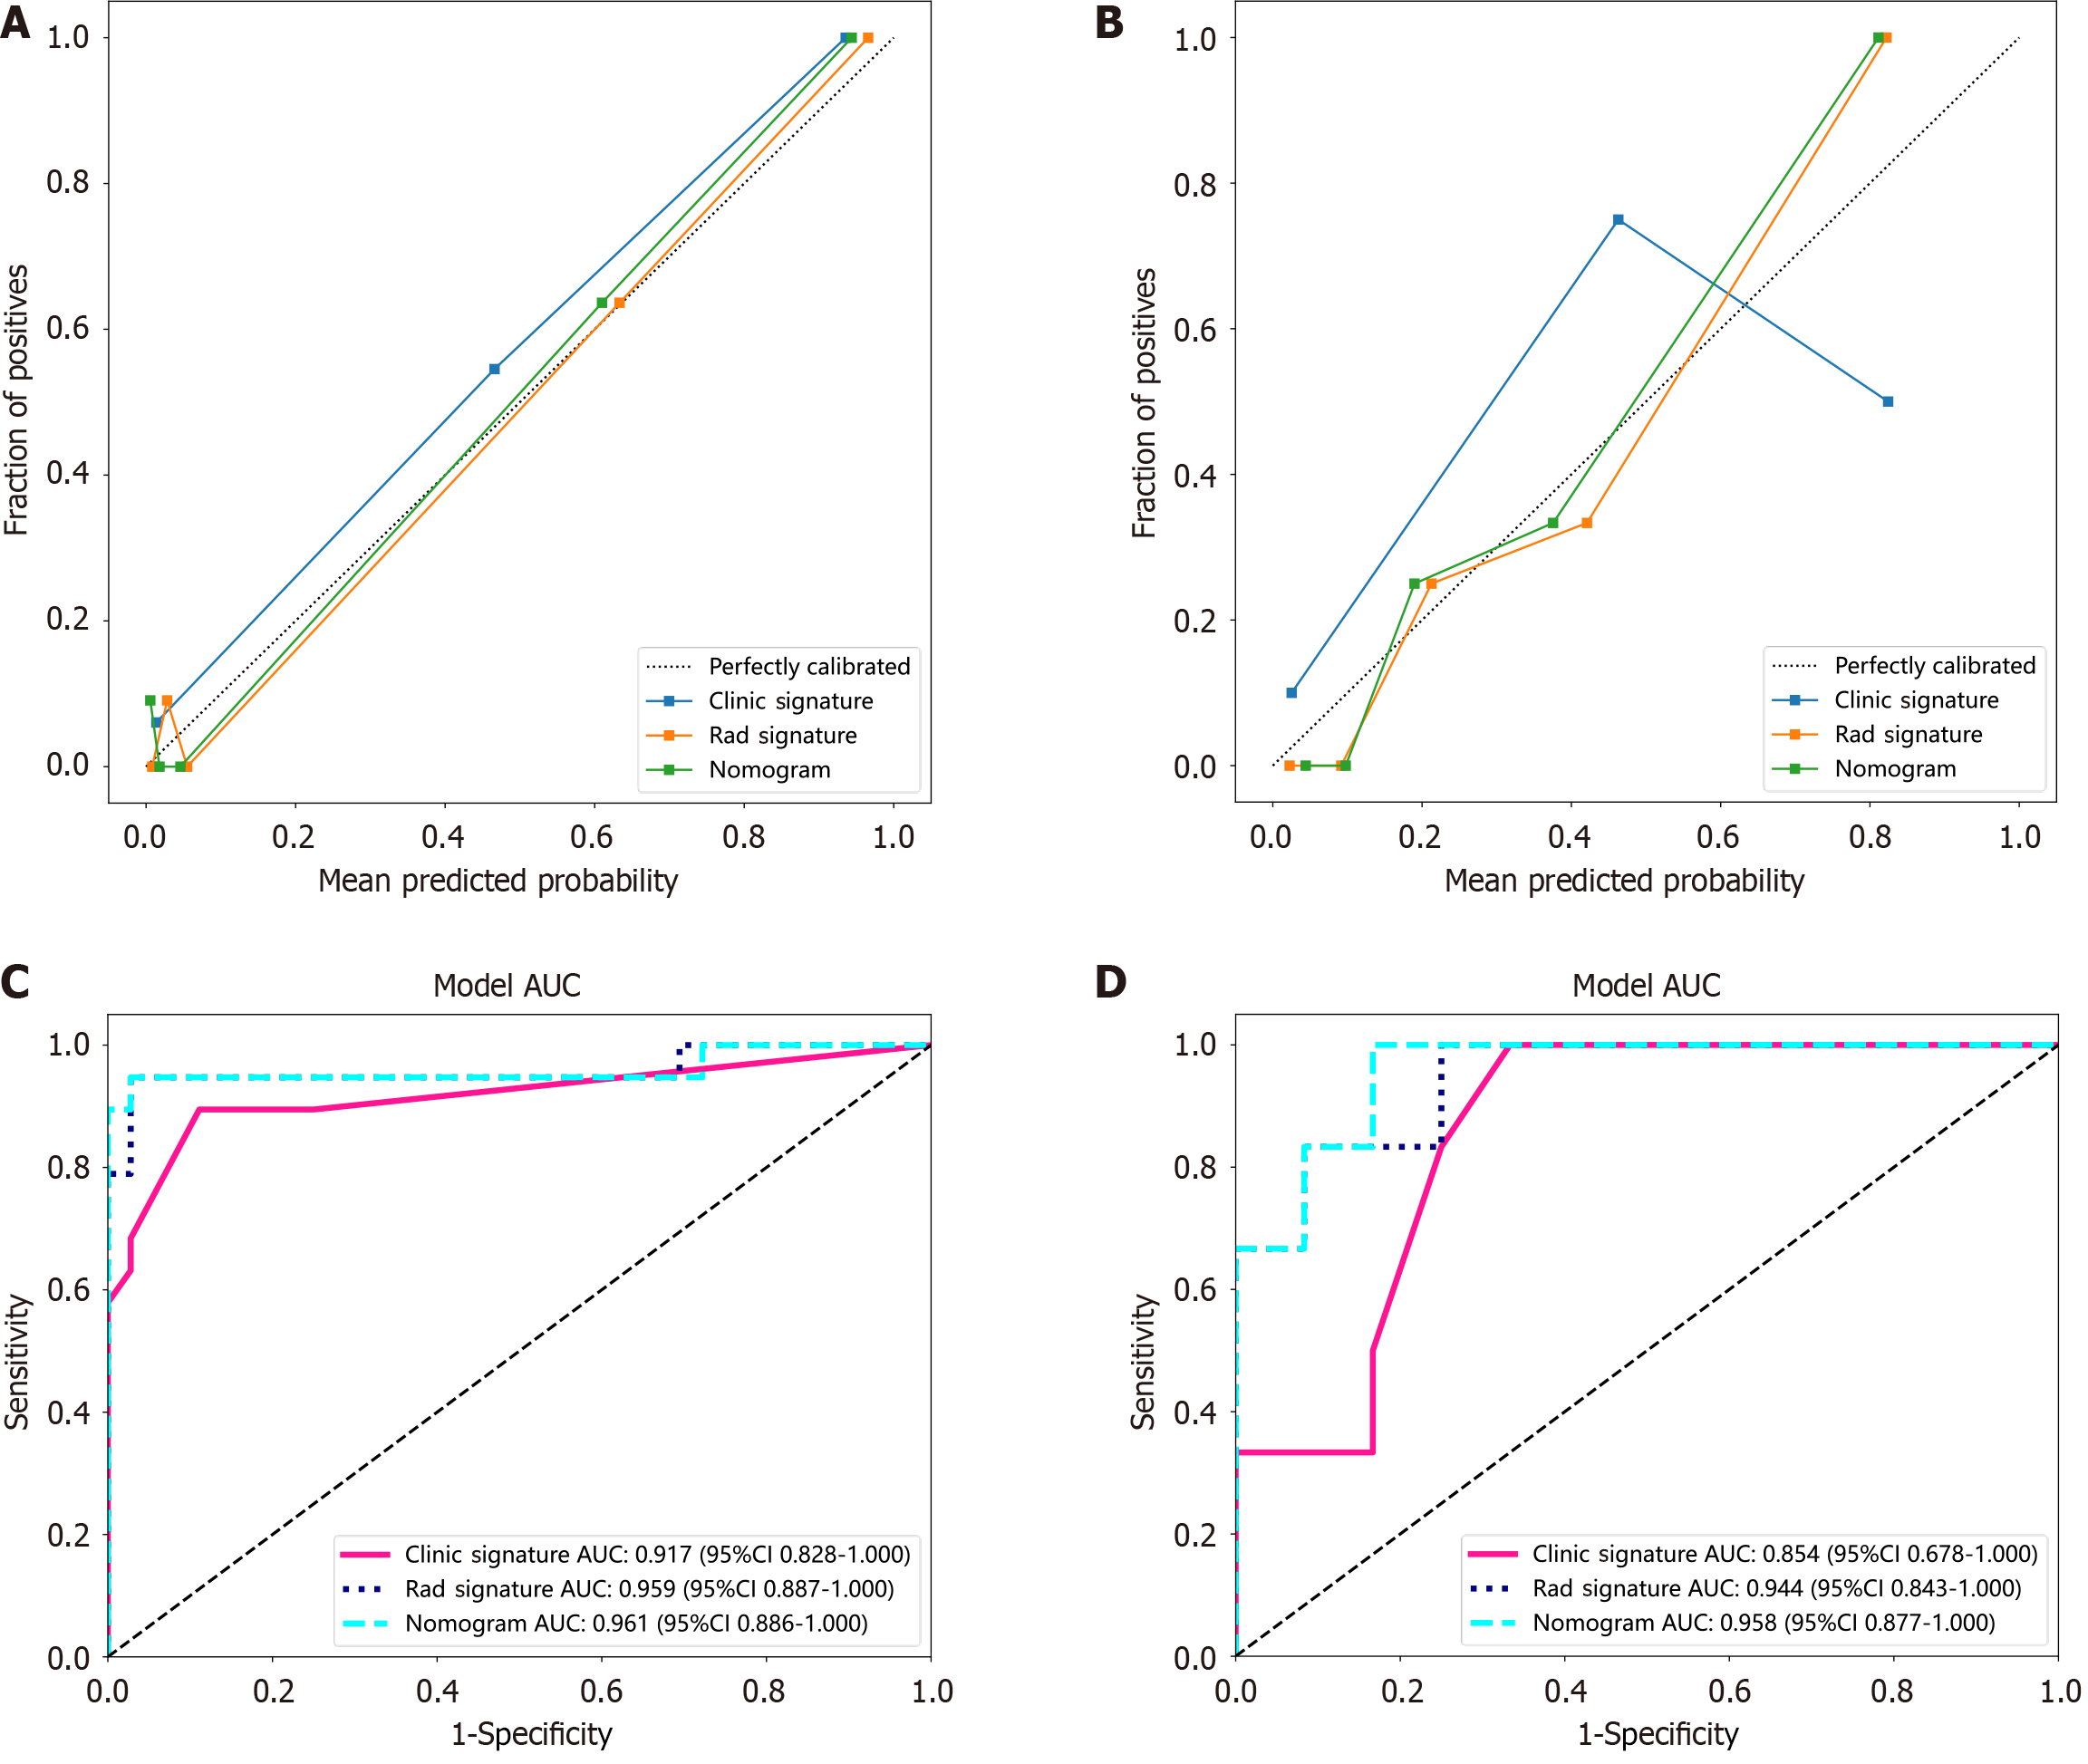
Figure 6 Calibration curves and receiver operating characteristic curves for the training and test cohorts.
A and B: Calibration curves in the training (A) and test (B) cohorts; C and D: Receiver operating characteristic curves in the training (C) and test (D) cohorts. AUC: Area under the receiver operating characteristic curve; 95%CI: 95% confidence interval.
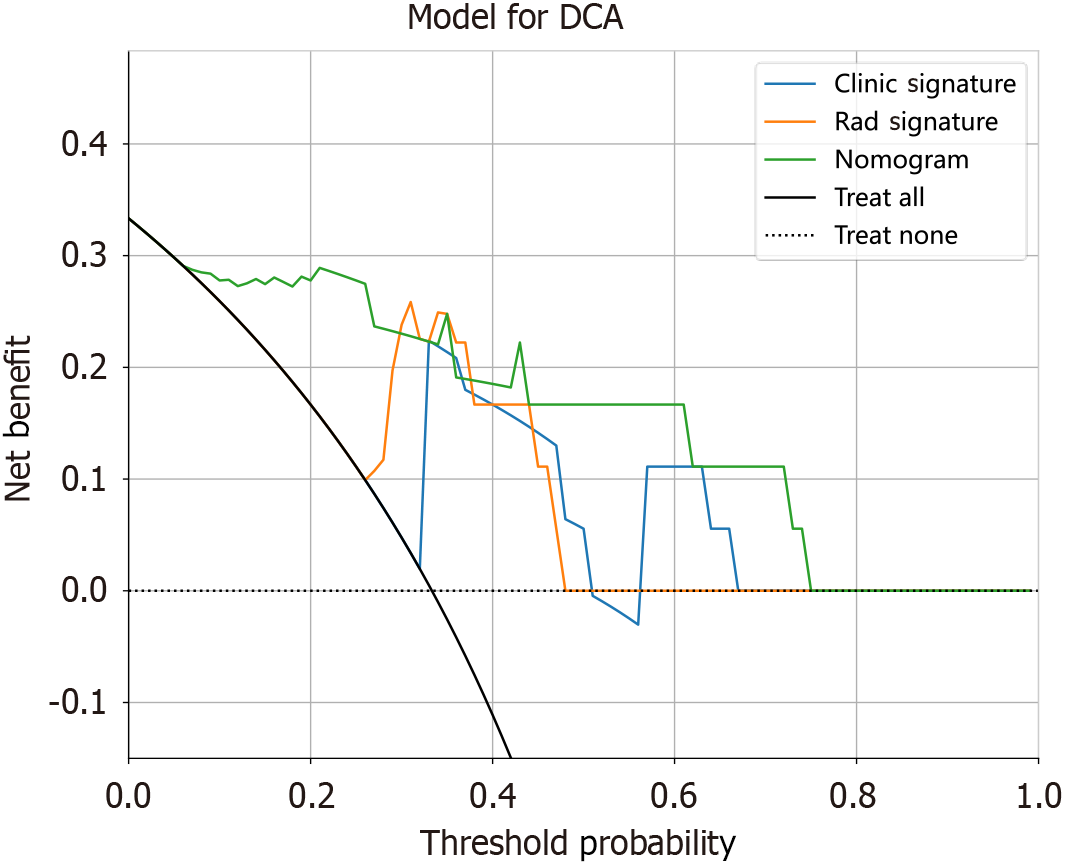
Figure 7 Decision curve analyses of the clinical, radiomic, and nomogram models in the test cohort.
DCA: Decision curve analysis.
- Citation: Ding H, Fang YY, Fan WJ, Zhang CY, Wang SF, Hu J, Han W, Mei Q. Computed tomography enterography-based radiomics for assessing mucosal healing in patients with small bowel Crohn's disease. World J Gastroenterol 2025; 31(3): 102283
- URL: https://www.wjgnet.com/1007-9327/full/v31/i3/102283.htm
- DOI: https://dx.doi.org/10.3748/wjg.v31.i3.102283


