Copyright
©The Author(s) 2025.
World J Gastroenterol. May 7, 2025; 31(17): 105281
Published online May 7, 2025. doi: 10.3748/wjg.v31.i17.105281
Published online May 7, 2025. doi: 10.3748/wjg.v31.i17.105281
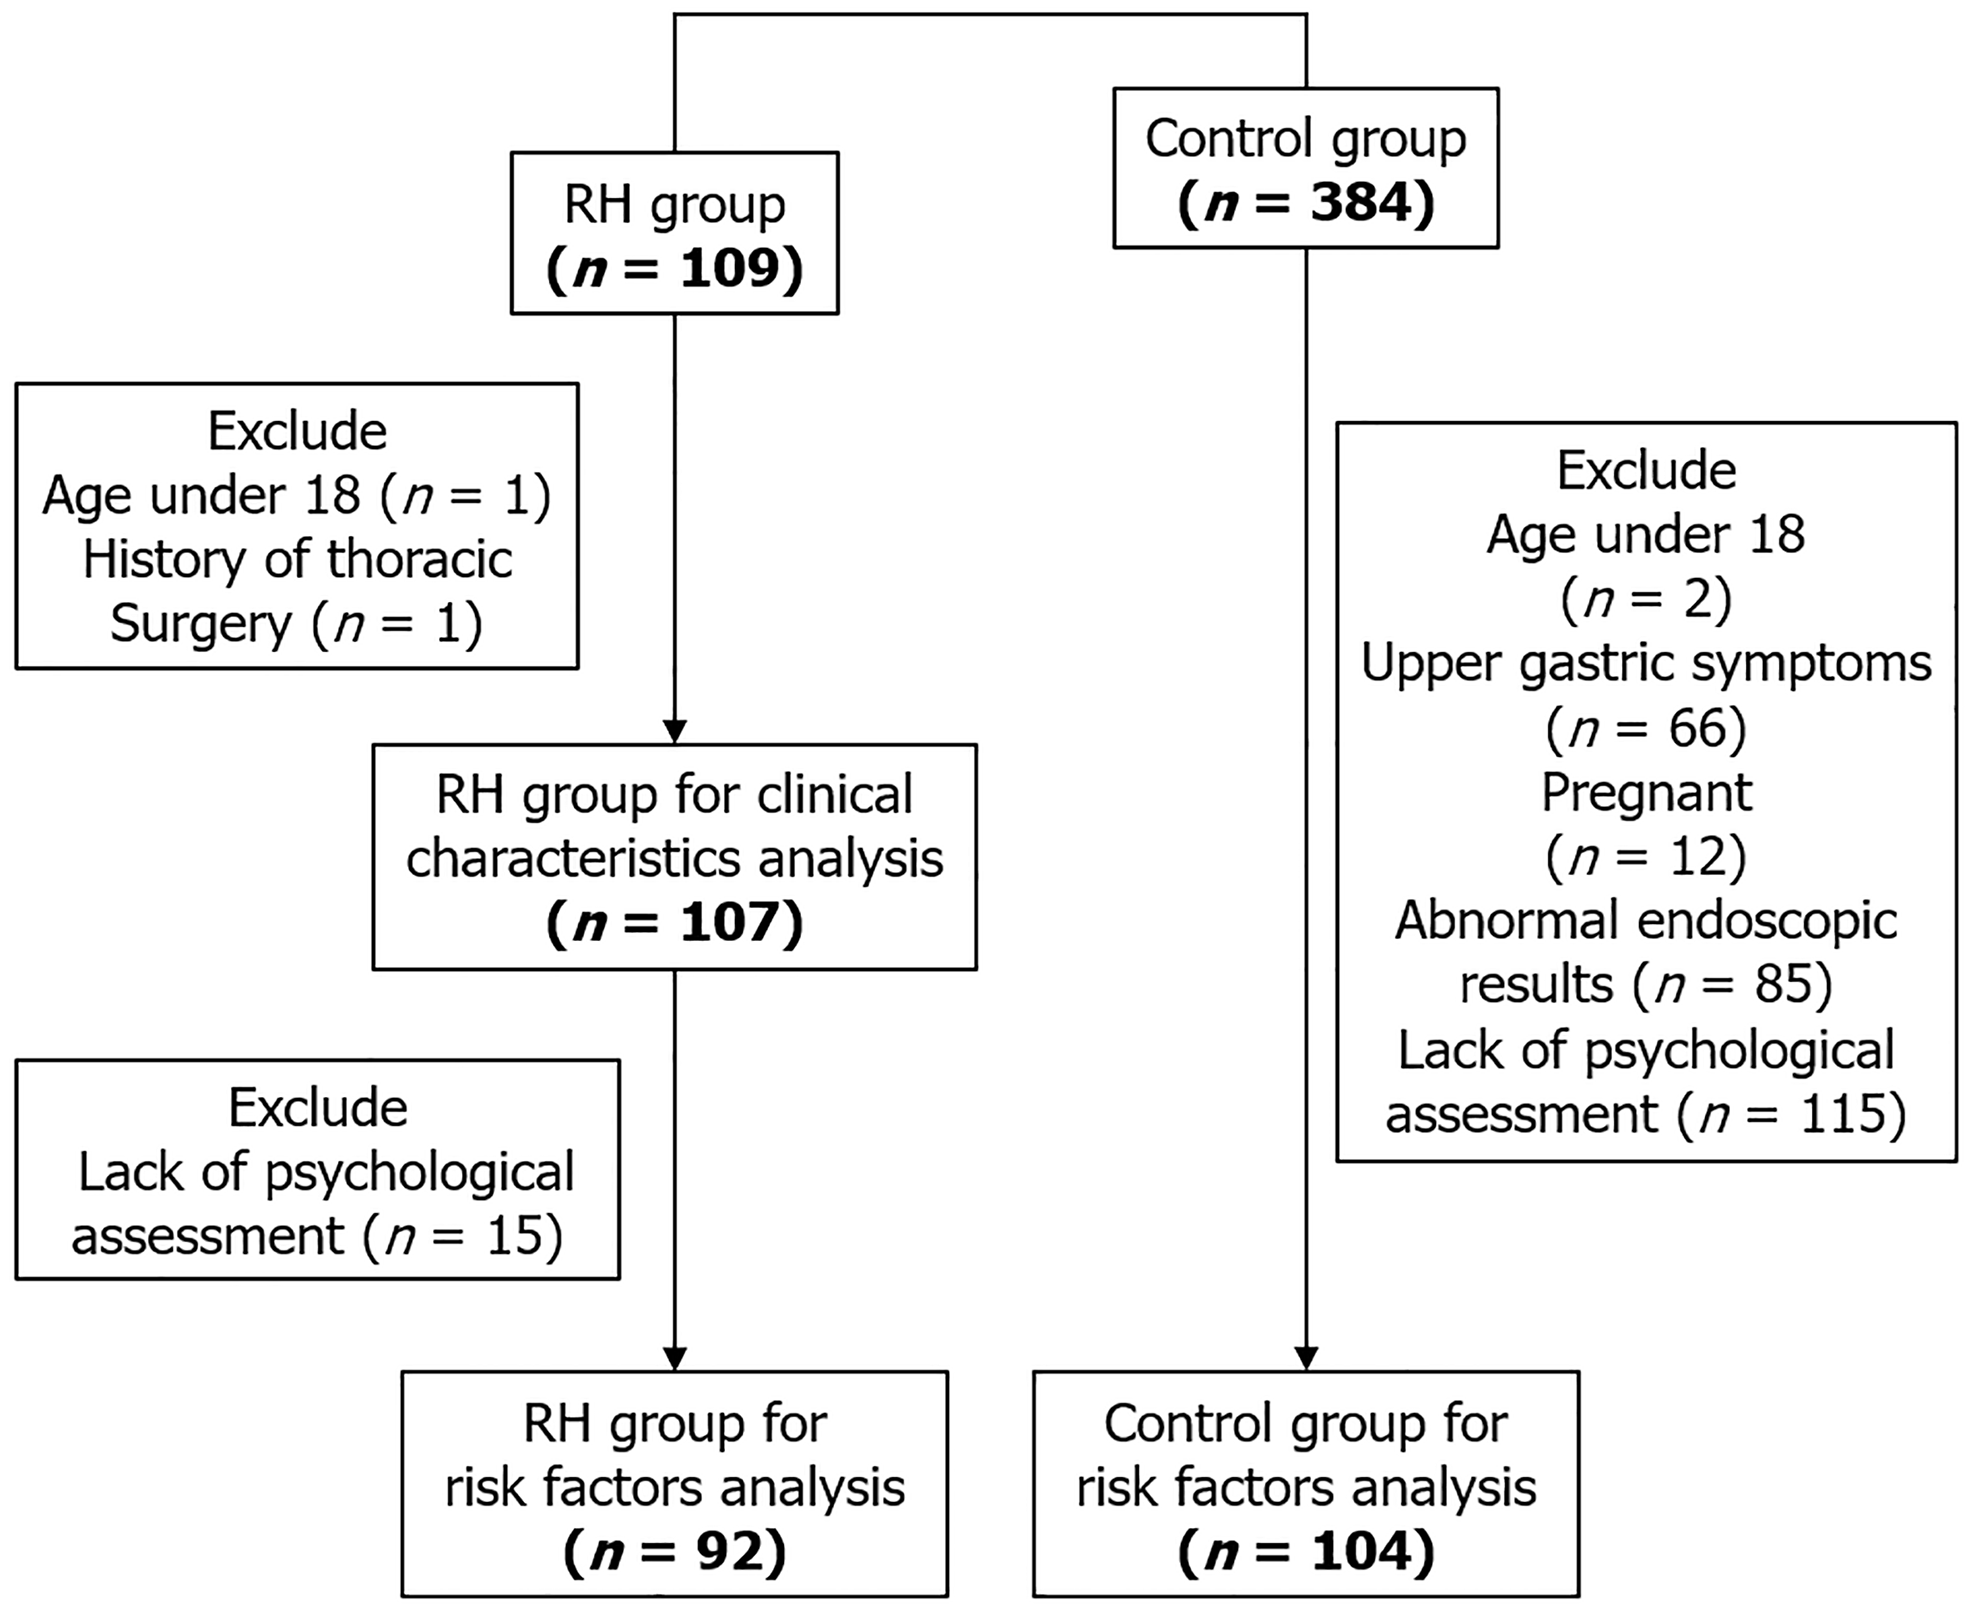
Figure 1 Schematic flow diagram of study design.
RH: Reflux hypersensitivity.
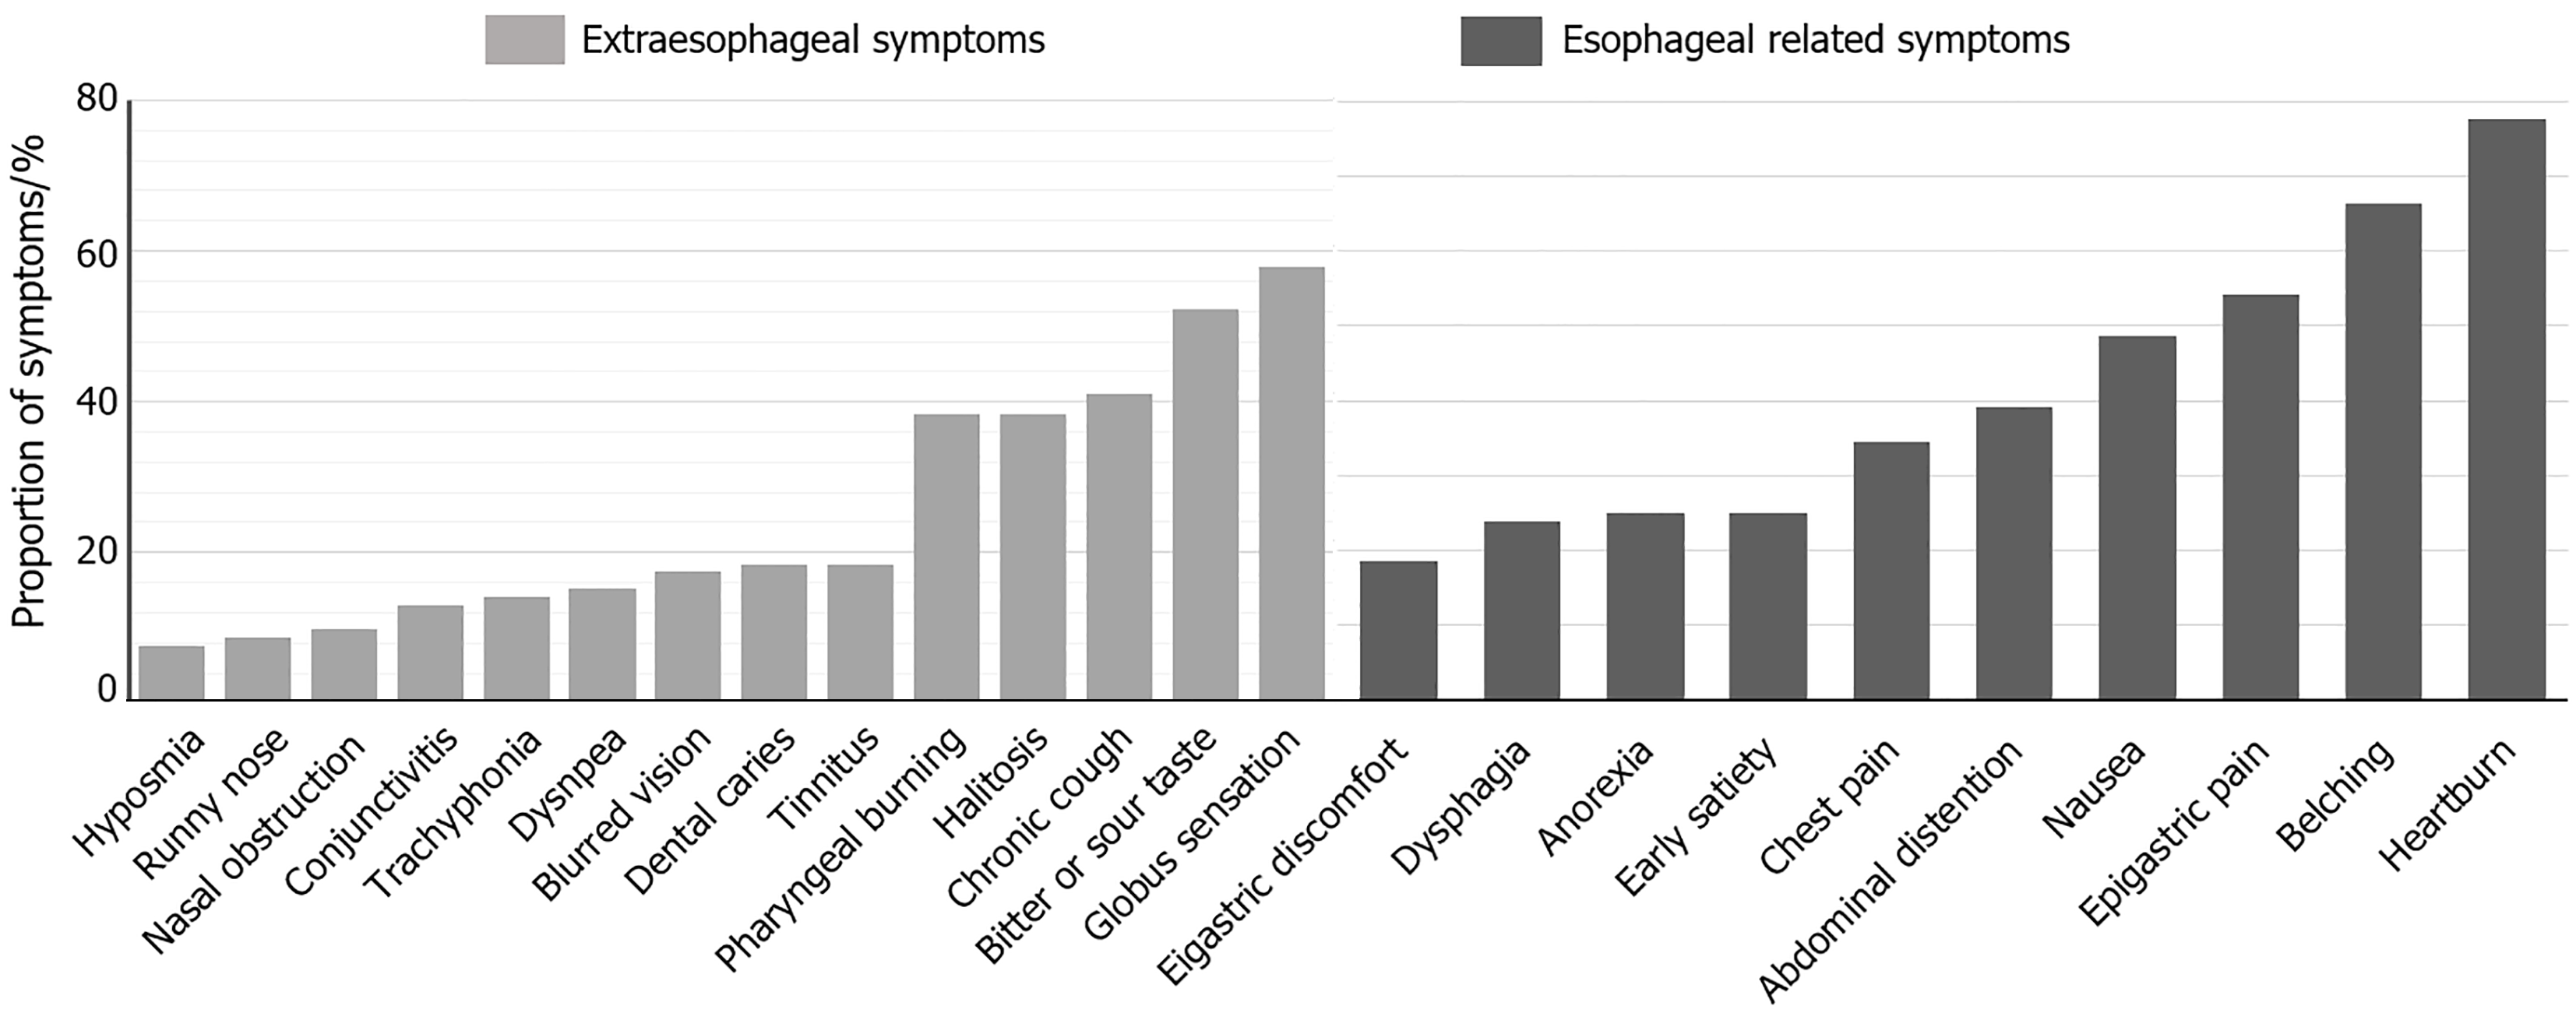
Figure 2 Proportion of extraesophageal symptoms and esophageal related symptoms in reflux hypersensitivity patients.
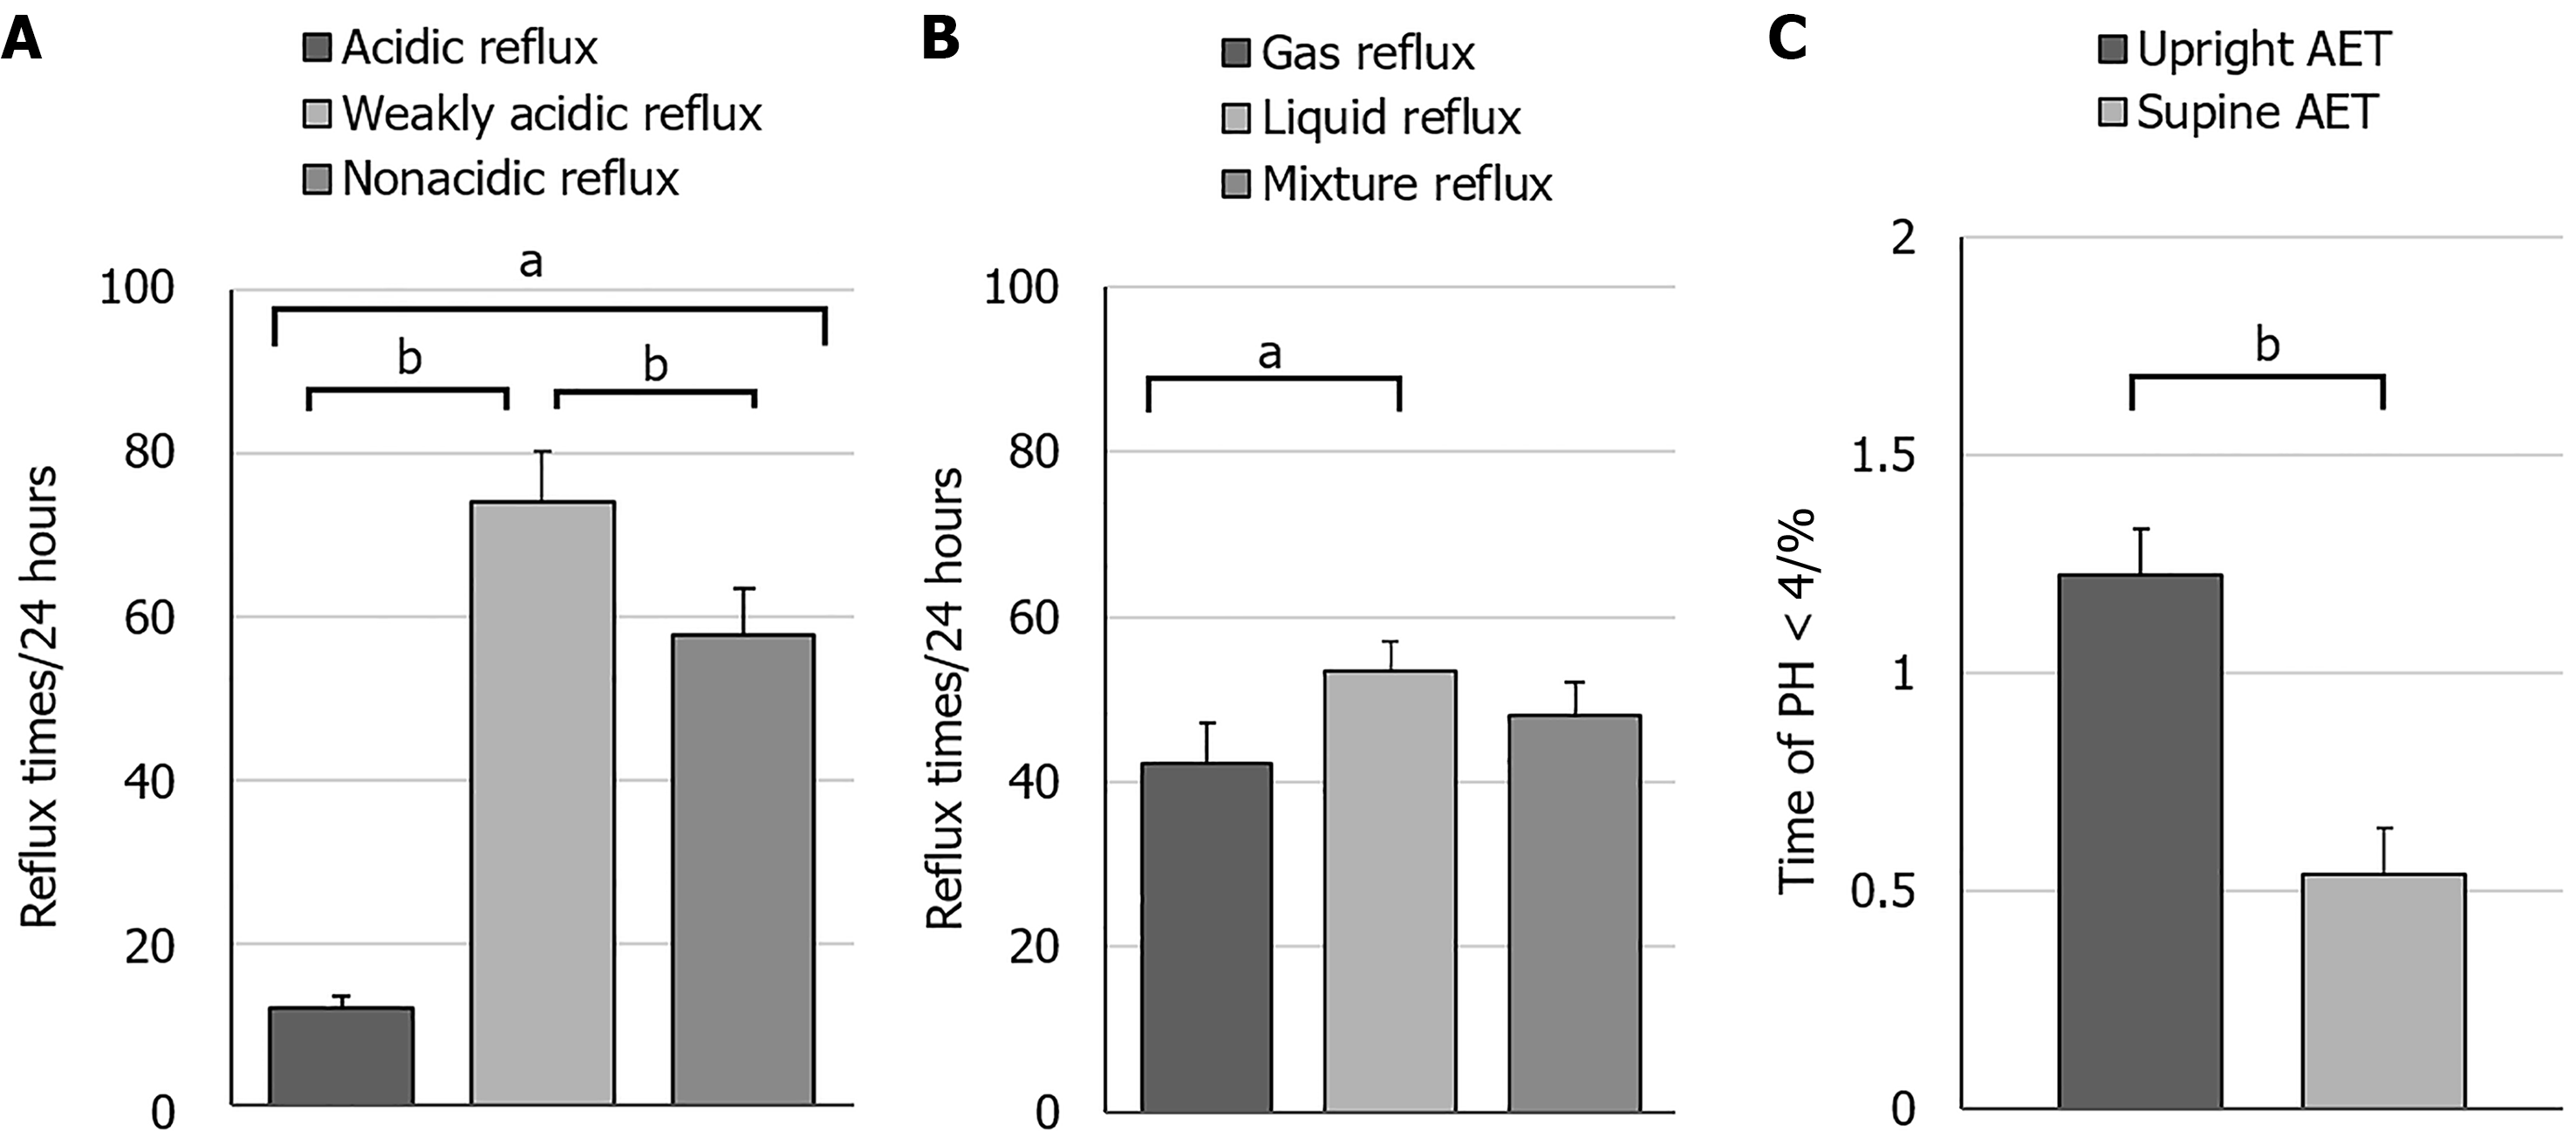
Figure 3 Comparison of reflux parameters for a continuous 24-hour period.
A: pH of the reflux; B: Physical state of the reflux; C: Position during acidic reflux. aP < 0.05; bP < 0.0001. AET: Acid exposure time.
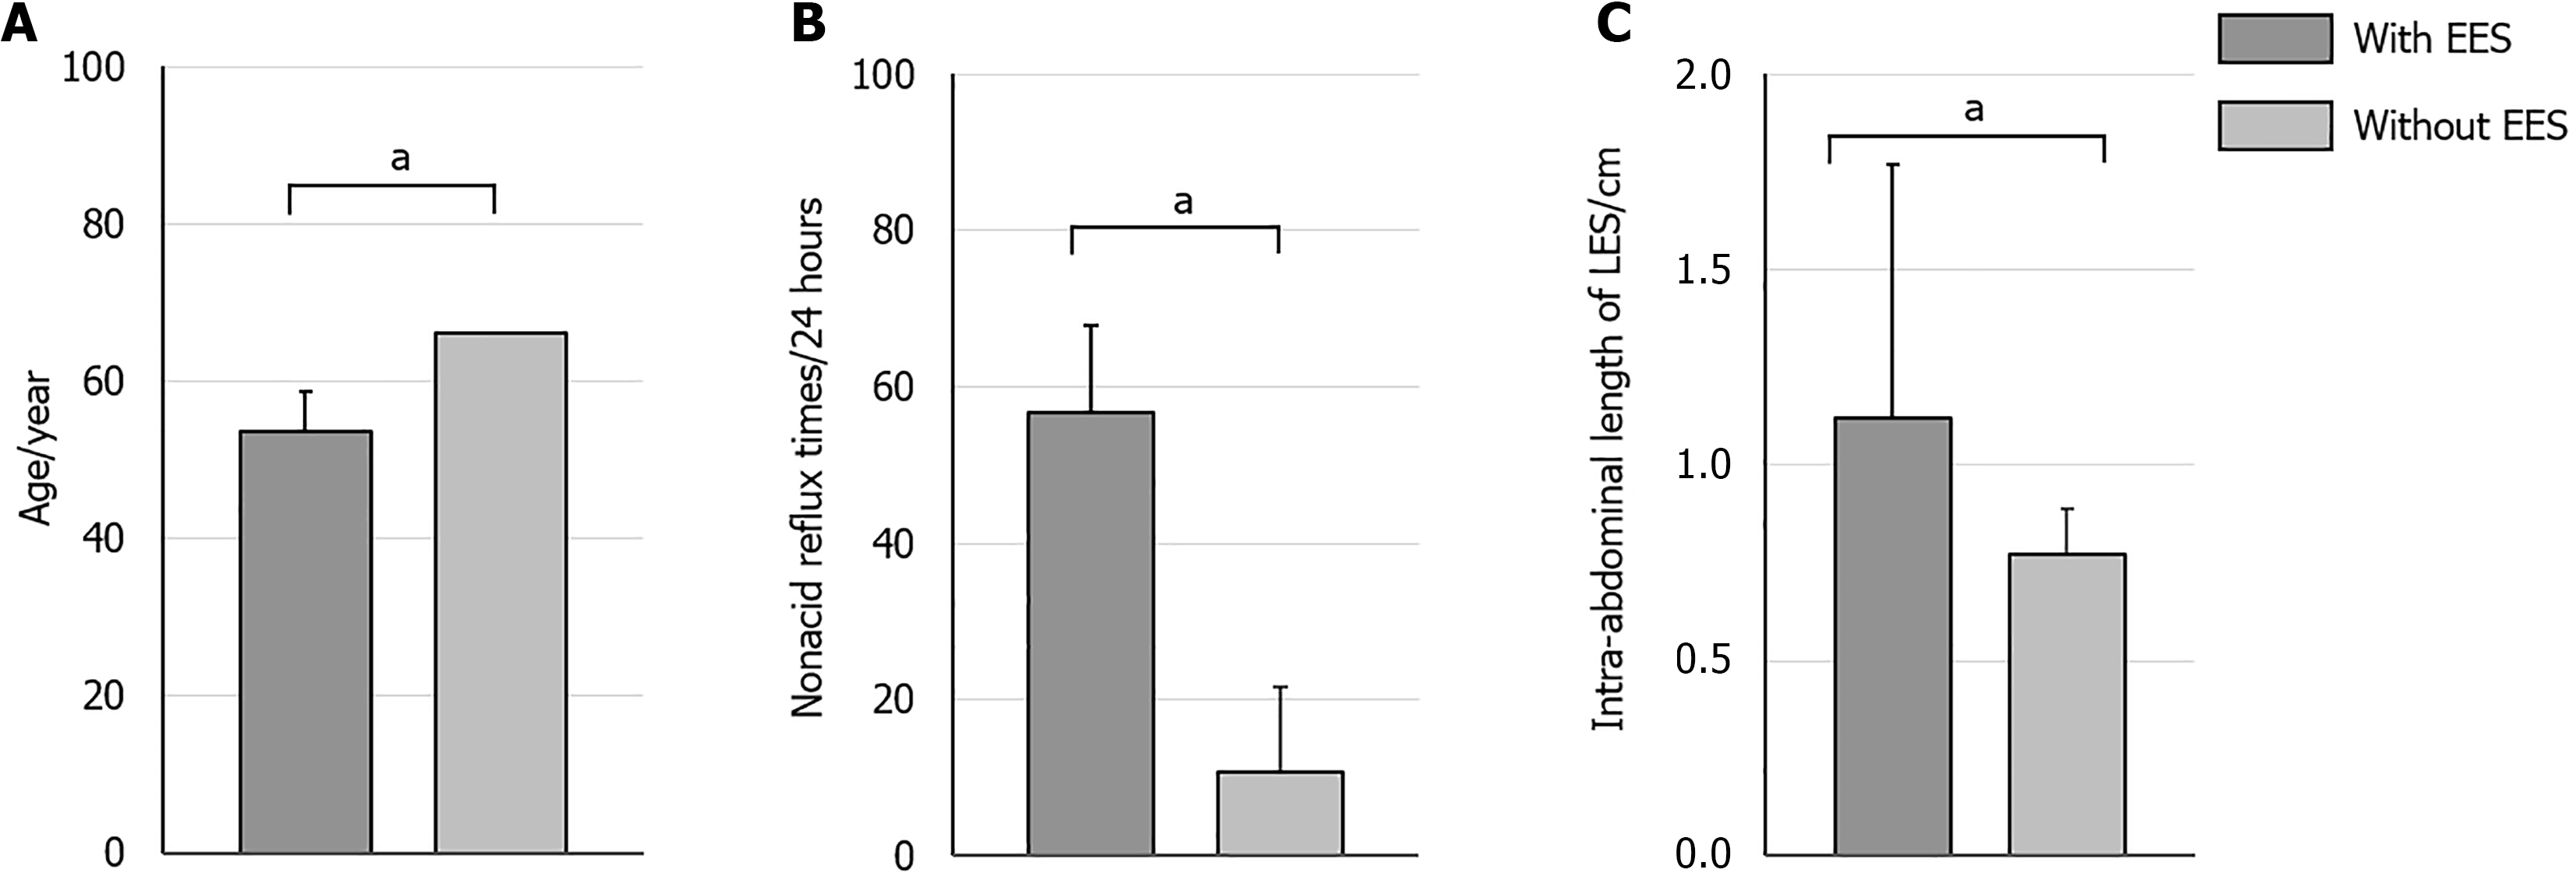
Figure 4 Comparison of parameters between patients with extraesophageal symptoms and without extraesophageal symptoms.
A: Age; B: Nonacidic reflux time; C: Intraabdominal length of the lower esophageal sphincter. aP < 0.05. EES: Extraesophageal symptoms; LES: Lower esophageal sphincter.
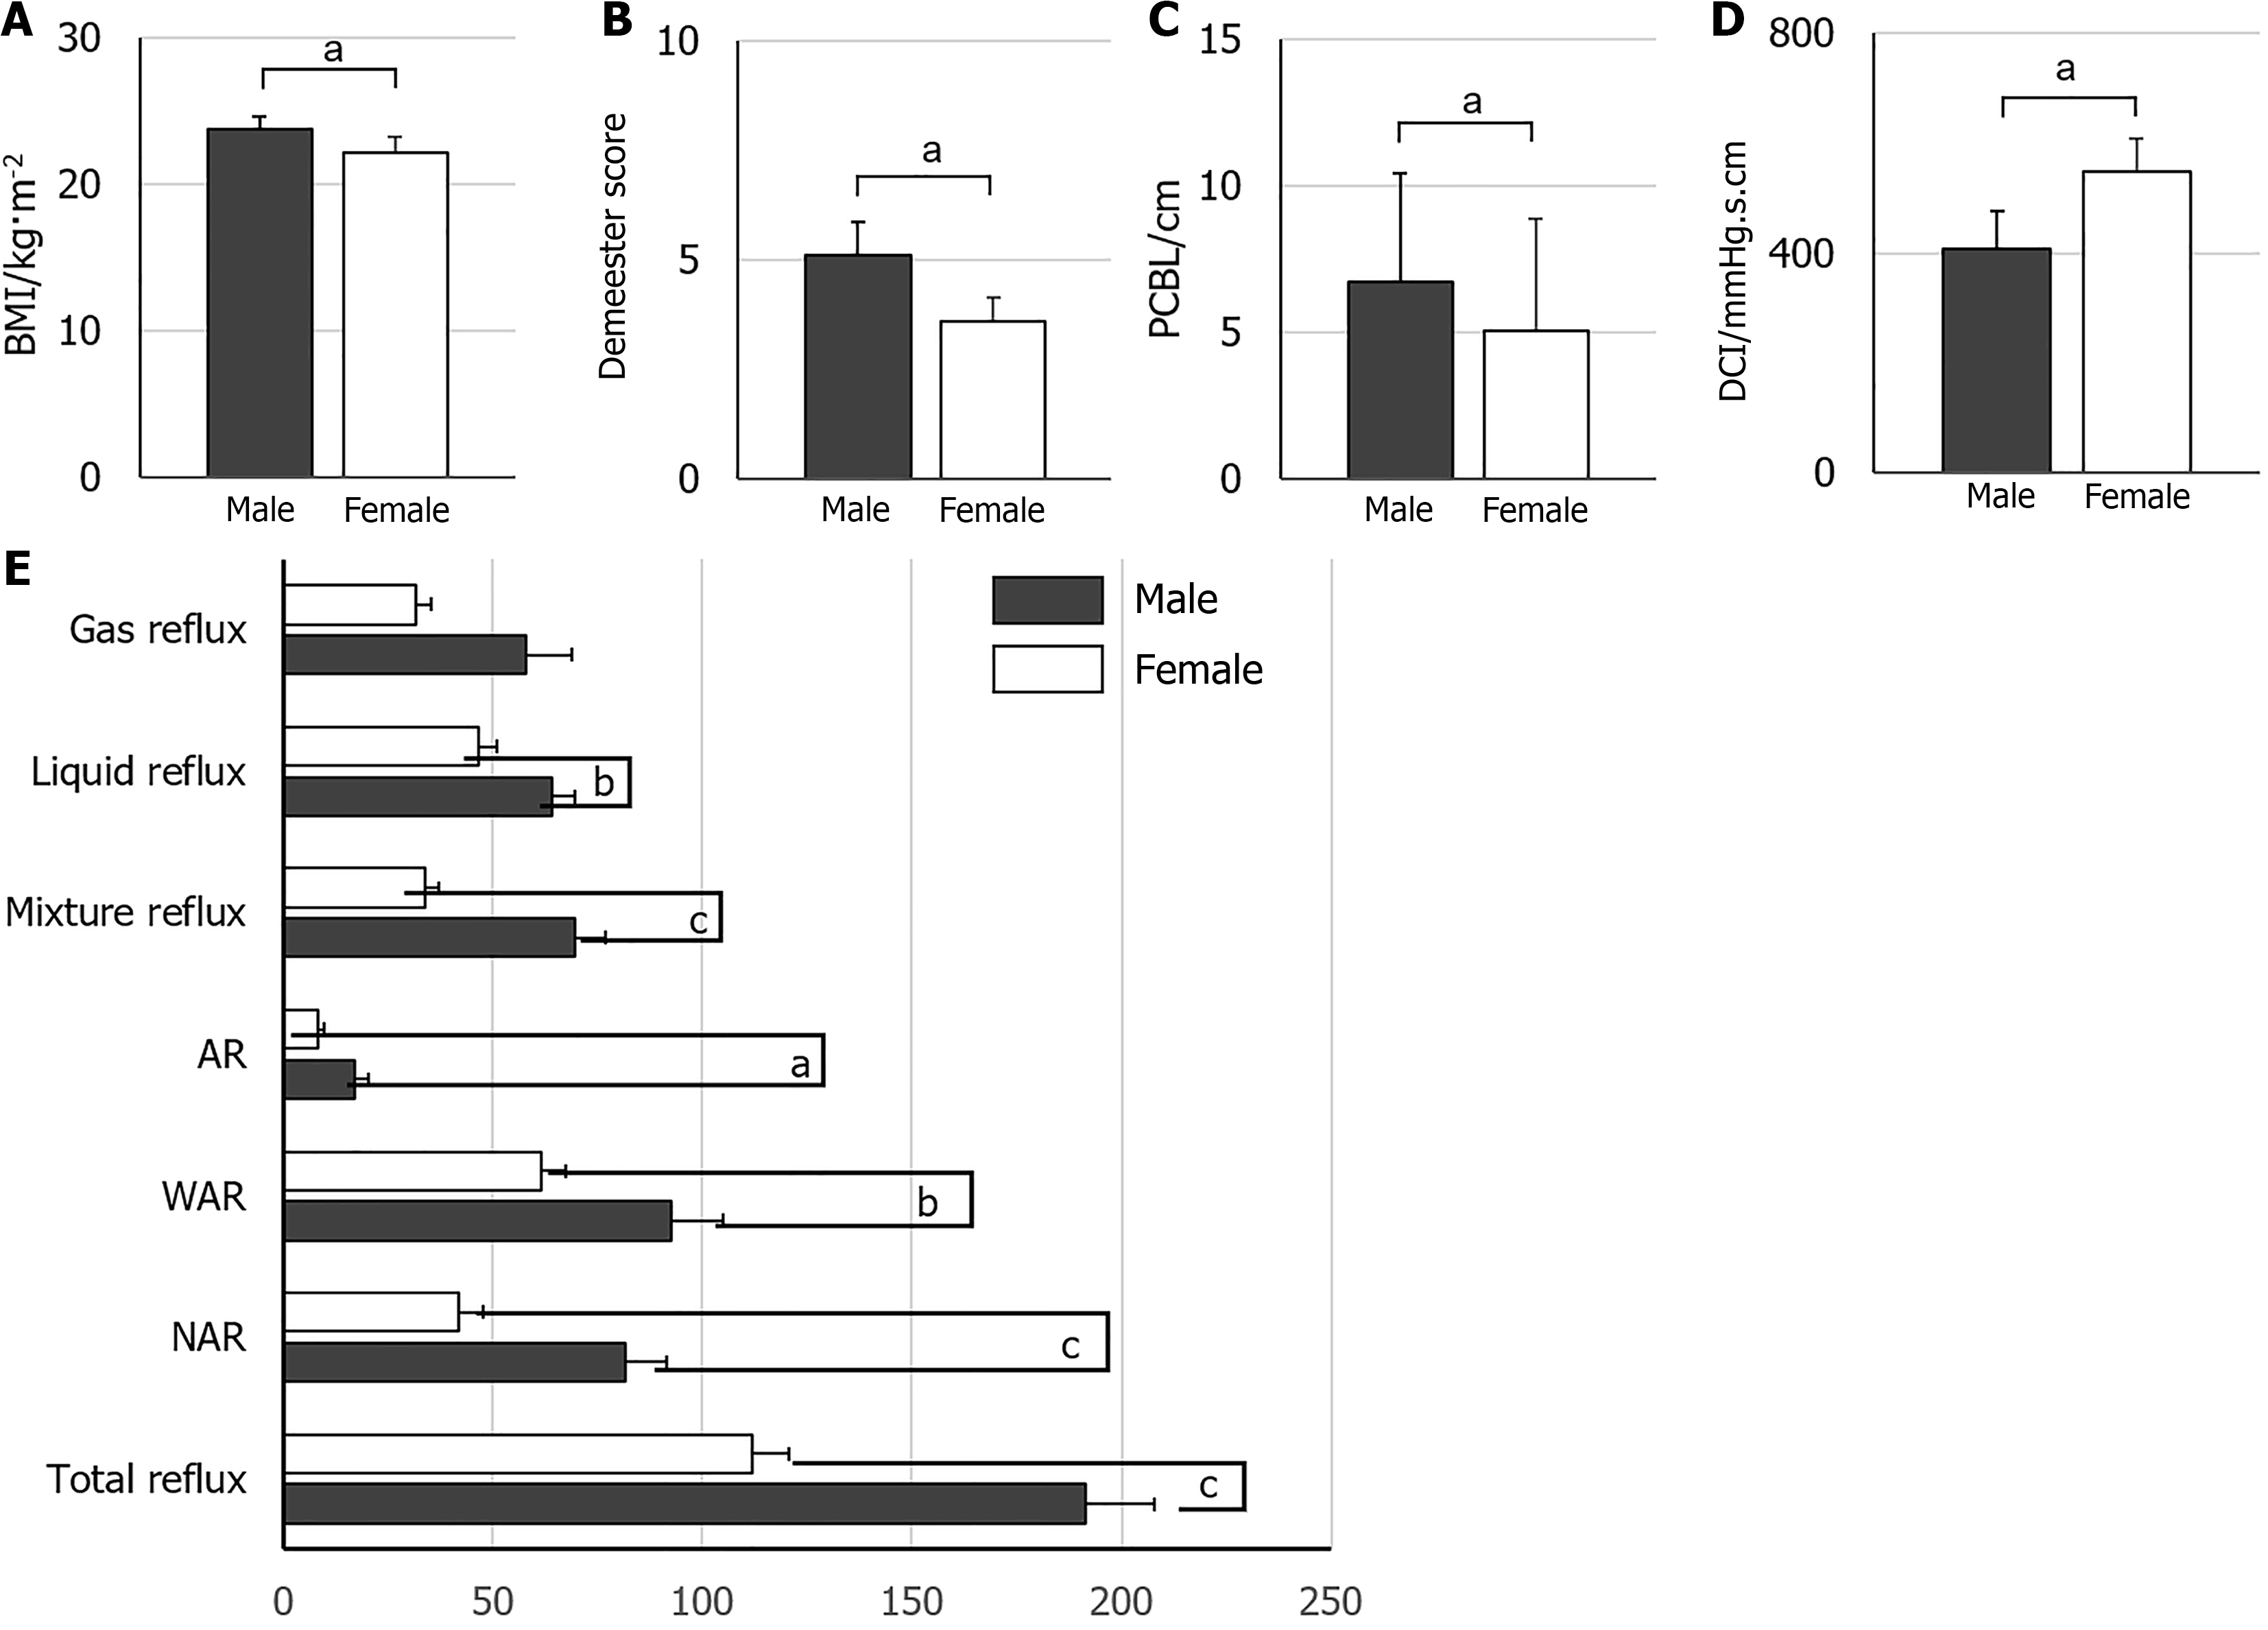
Figure 5 Comparison of parameters based on gender.
A: Body mass index; B: Demeester score; C: Peristaltic contraction break length; D: Distal contractile integral; E: Times of different reflux events. aP < 0.05; bP < 0.01; cP < 0.001. BMI: Body mass index; PCBL: Peristaltic contraction break length; DCI: Distal contractile integral; AR: Acidic reflux; WAR: Weakly acidic reflux; NAR: Nonacidic reflux.
- Citation: Wu YP, Zhou JX, Wu HB, Wu DP, Qin LZ, Qin B, Xu XY, Yehya SAA, Cheng Y. Clinical characteristics and risk factors of esophageal reflux hypersensitivity: A multicenter study. World J Gastroenterol 2025; 31(17): 105281
- URL: https://www.wjgnet.com/1007-9327/full/v31/i17/105281.htm
- DOI: https://dx.doi.org/10.3748/wjg.v31.i17.105281


