Copyright
©The Author(s) 2025.
World J Gastroenterol. Apr 14, 2025; 31(14): 104117
Published online Apr 14, 2025. doi: 10.3748/wjg.v31.i14.104117
Published online Apr 14, 2025. doi: 10.3748/wjg.v31.i14.104117
Figure 1 Establishment of a cellular senescence model and aggravation of steatosis in senescent cells.
A: HepG2 and AML12 cells were treated with hydrogen peroxide (H2O2) (400 μM) for 6 hours and stained for β-galactosidase (× 400); B: HepG2 and AML12 cells were irradiated with 8 Gy of X-rays and stained for β-galactosidase (× 400); C-F: Protein expression levels of P16, P21, and P53 and corresponding quantitative results, and mRNA levels of P16, P21, and P53 in HepG2 and AML12 cells after cellular senescence was established; G: Cellular levels of triglycerides (TGs) and Oil Red O staining (× 400) of AML12 cells treated with H2O2 (400 μM) for 6 hours and stimulated with different concentrations of palmitic acid (PA) (100 μM, 200 μM, or 300 μM) for 24 hours; H: Cellular levels of TGs and Oil Red O staining (× 400) of AML12 cells irradiated with 8 Gy of X-rays and stimulated with different concentrations of PA (100 μM, 200 μM, or 300 μM) for 24 hours; I: Cellular levels of TGs and Oil Red O staining (× 400) of AML12 cells irradiated with 8 Gy of X-rays and stimulated with different concentrations of free fatty acids (0.6 mmol/L, 0.8 mmol/L, or 1 mmol/L) for 24 hours. Protein levels and mRNA levels were normalized to glyceraldehyde-3-phosphate dehydrogenase. The data are presented as the means ± SDs. aP < 0.05. bP < 0.01. cP < 0.001. P calculated according to student’s t tests. H2O2: Hydrogen peroxide; NC: Negative control; BSA: Bovine serum albumin; SA-β-Gal: Senescence-associated β-galactosidase; PA: Palmitic acid; FFA: Free fatty acids; GAPDH: Glyceraldehyde-3-phosphate dehydrogenase.
Figure 2 Establishment of a mouse aging model and aggravation of hepatic steatosis after senescence.
A: Β-Galactosidase staining (× 200) of liver sections from 3-month-old telomerase RNA component knockout mice (Terc-/-) or wild-type (WT) mice; B: Protein expression levels of P16, P21, and P53 and corresponding quantitative results, and mRNA levels of P16, P21, and P53 in 3-month-old Terc-/- or WT mice; C: Weights, liver weights, serum levels of alanine aminotransferase (ALT), aspartate aminotransferase (AST), triglycerides (TGs), and total cholesterol (TC) and hepatic levels of TGs and TC in 3-month-old Terc-/- or WT mice; D: Hematoxylin-eosin (HE) and Oil Red O staining (× 200) of the liver sections; E-H: The 3-month-old Terc-/- or WT mice were fed a high-fat diet or standard chow diet (SCD) for 8 weeks to establish a model of metabolic dysfunction-associated steatotic liver disease; Weights and changes in weight (E); Glucose tolerance test and associated area under the curve. Insulin tolerance test and associated area under the curve (F); Liver weights, liver-to-body weight ratios, serum levels of ALT, AST, TGs, and TC, and hepatic levels of TGs and TC (G); HE and Oil Red O staining (× 200) of the liver sections (H); I-K: Three-month-old Terc-/- or WT mice were fed a methionine/choline-deficient diet or SCD for 6 weeks to establish a model of metabolic dysfunction-associated steatohepatitis; Weights and changes in weight (I); Liver weights, liver-to-body weight ratio, serum levels of ALT, AST, TGs, and TC, and hepatic levels of TGs (J); HE and Oil Red O staining (× 200) of the liver sections. Protein levels and mRNA levels were normalized to those of glyceraldehyde-3-phosphate dehydrogenase (K). The data are presented as the means ± SDs. aP < 0.05. bP < 0.01. cP < 0.001. P as determined via student’s t tests and one-way analysis of variance with Tukey’s correction. WT: Wild-type; HE: Hematoxylin-eosin; MCD: Methionine-choline-deficient diet; ALT: Alanine aminotransferase; AST: Aspartate aminotransferase; TG: Triglycerides; TC: Total cholesterol; SCD: Standard chow diet; HFD: High-fat diet; GTT: Glucose tolerance test; ITT: Insulin tolerance test; AUC: Area under the curve; GAPDH: Glyceraldehyde-3-phosphate dehydrogenase.
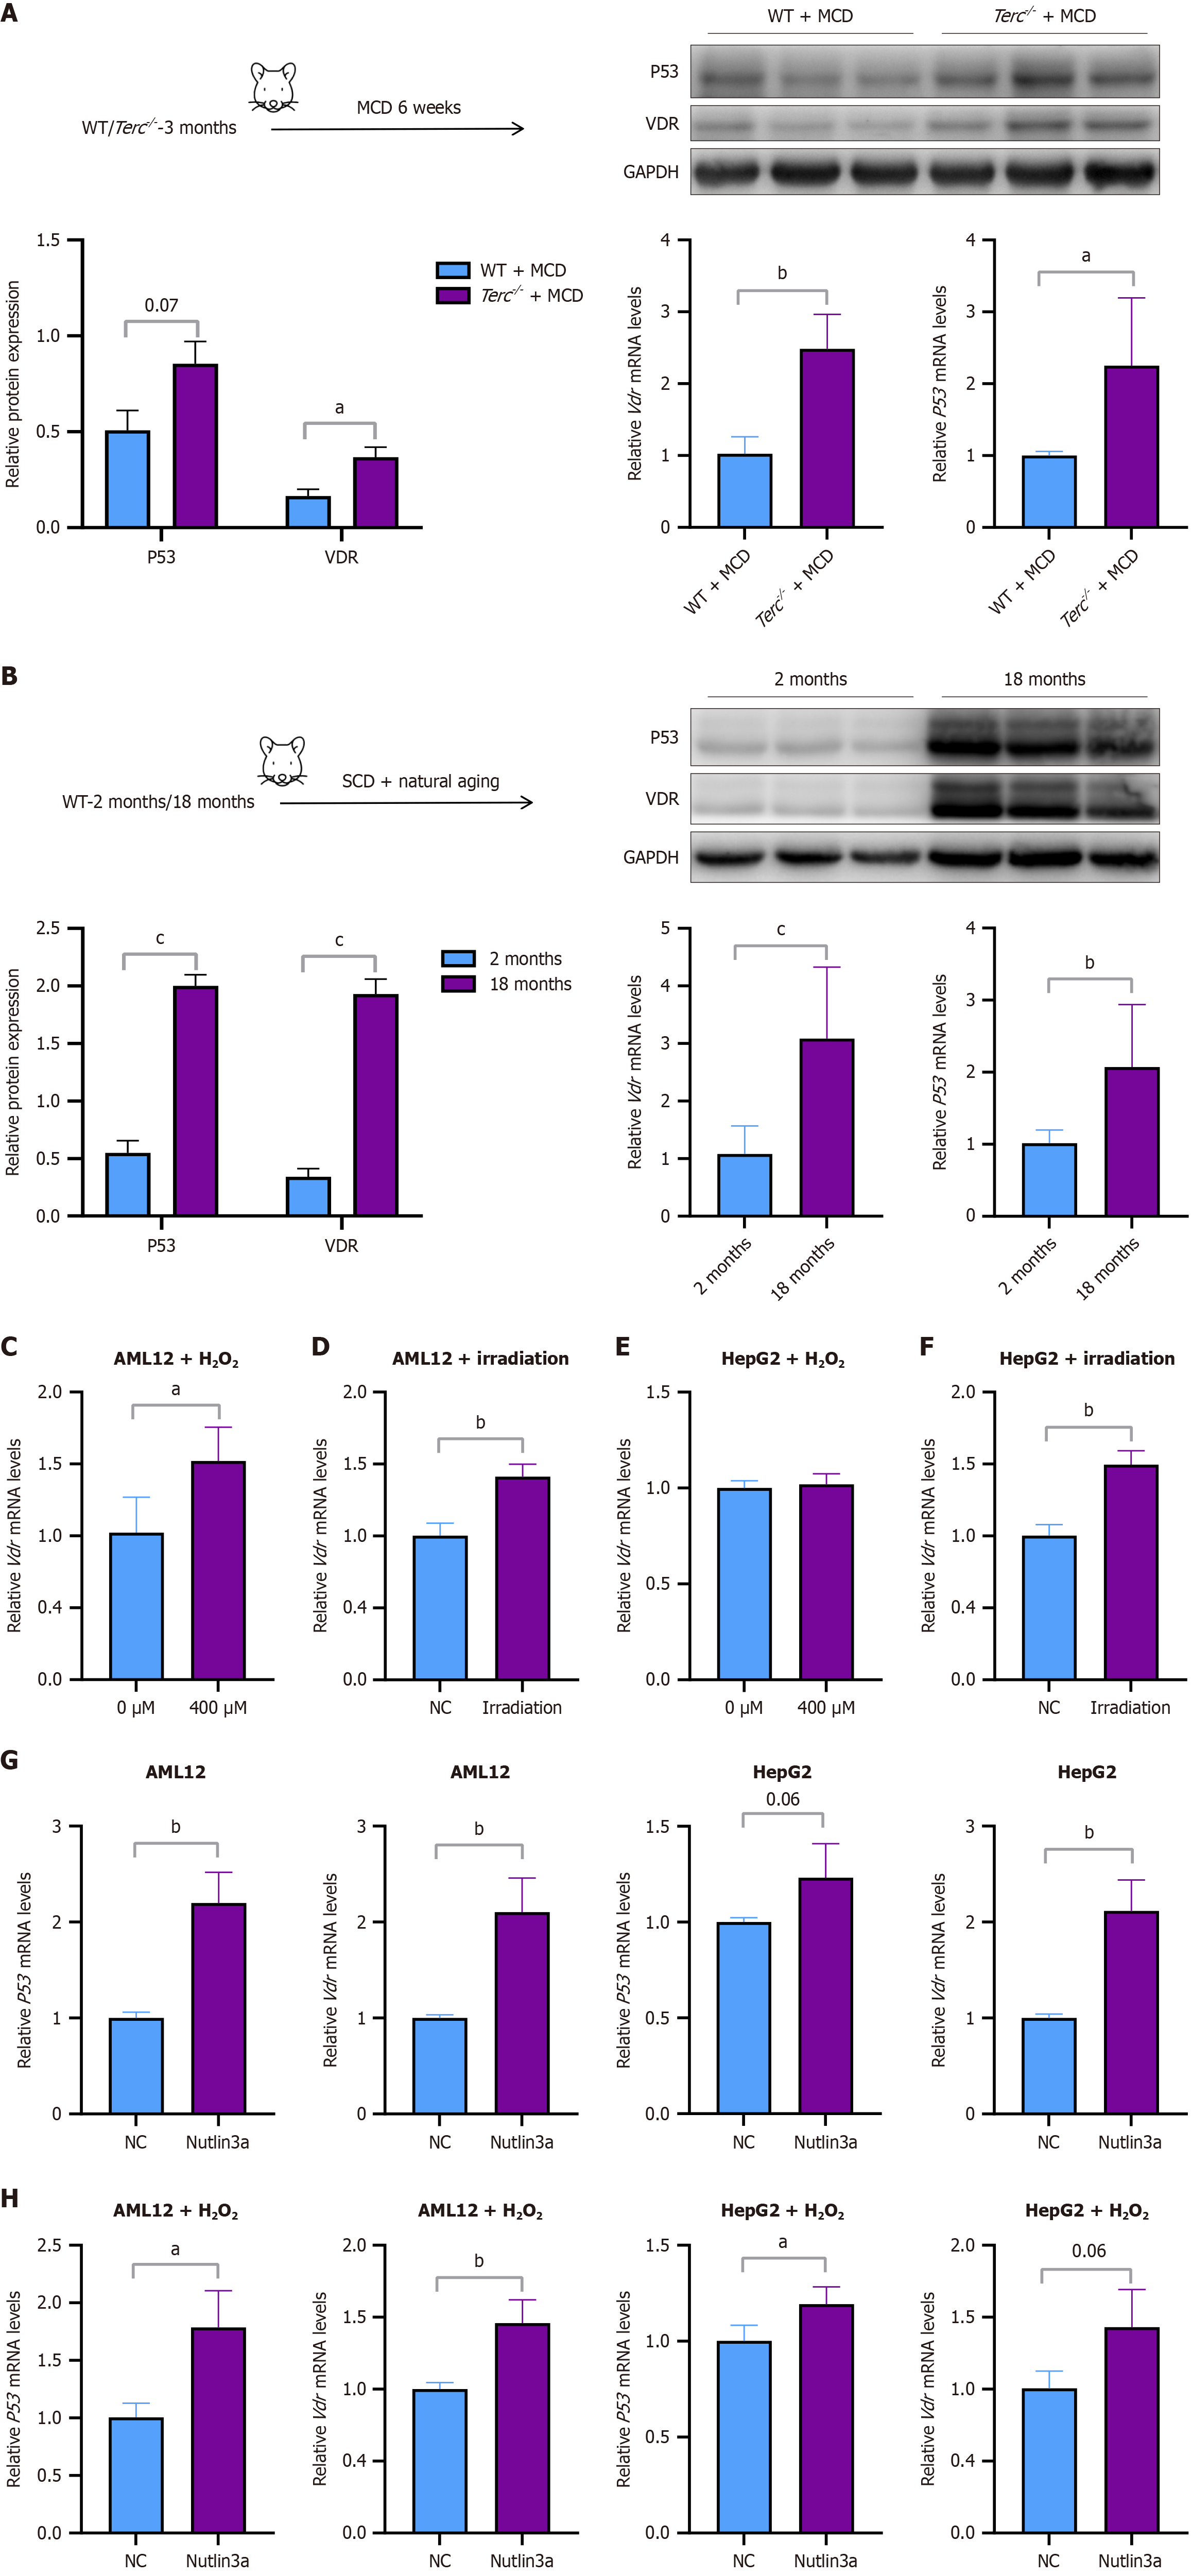
Figure 3 Vitamin D receptor expression in the liver increased after senescence.
A: Three-month-old telomerase RNA component knockout mice (Terc-/-) or wild-type (WT) mice were fed a methionine/choline-deficient diet for 6 weeks. The protein expression levels of P53 and vitamin D receptor (VDR) and the corresponding quantitative results, and the mRNA levels of P53 and VDR are shown; B: Two-month-old WT mice and 18-month-old WT mice were fed a standard chow diet. Protein expression levels of P53 and VDR and corresponding quantitative results, and mRNA levels of P53 and VDR; C-F: MRNA levels of VDR in AML12 or HepG2 cells after senescence was established; AML12 cells were treated with hydrogen peroxide (H2O2) (400 μM) for 6 hours (C); AML12 cells were irradiated with 8 Gy of X-rays (D); HepG2 cells were treated with H2O2 (400 μM) for 6 hours (E); HepG2 cells were irradiated with 8 Gy of X-rays (F); G: MRNA levels of P53 and VDR in AML12 or HepG2 cells treated with Nutlin-3a (10 μM) for 48 hours; H: MRNA levels of P53 and VDR in senescent AML12 or HepG2 cells treated with Nutlin-3a (10 μM) for 48 hours. Protein and mRNA levels were normalized to those of glyceraldehyde-3-phosphate dehydrogenase. The data are presented as the means ± SDs. aP < 0.05. bP < 0.01. cP < 0.001. P calculated according to student’s t tests. WT: Wild-type; MCD: Methionine-choline-deficient diet; H2O2: Hydrogen peroxide; VDR: Vitamin D receptor; GAPDH: Glyceraldehyde-3-phosphate dehydrogenase; NC: Negative control.
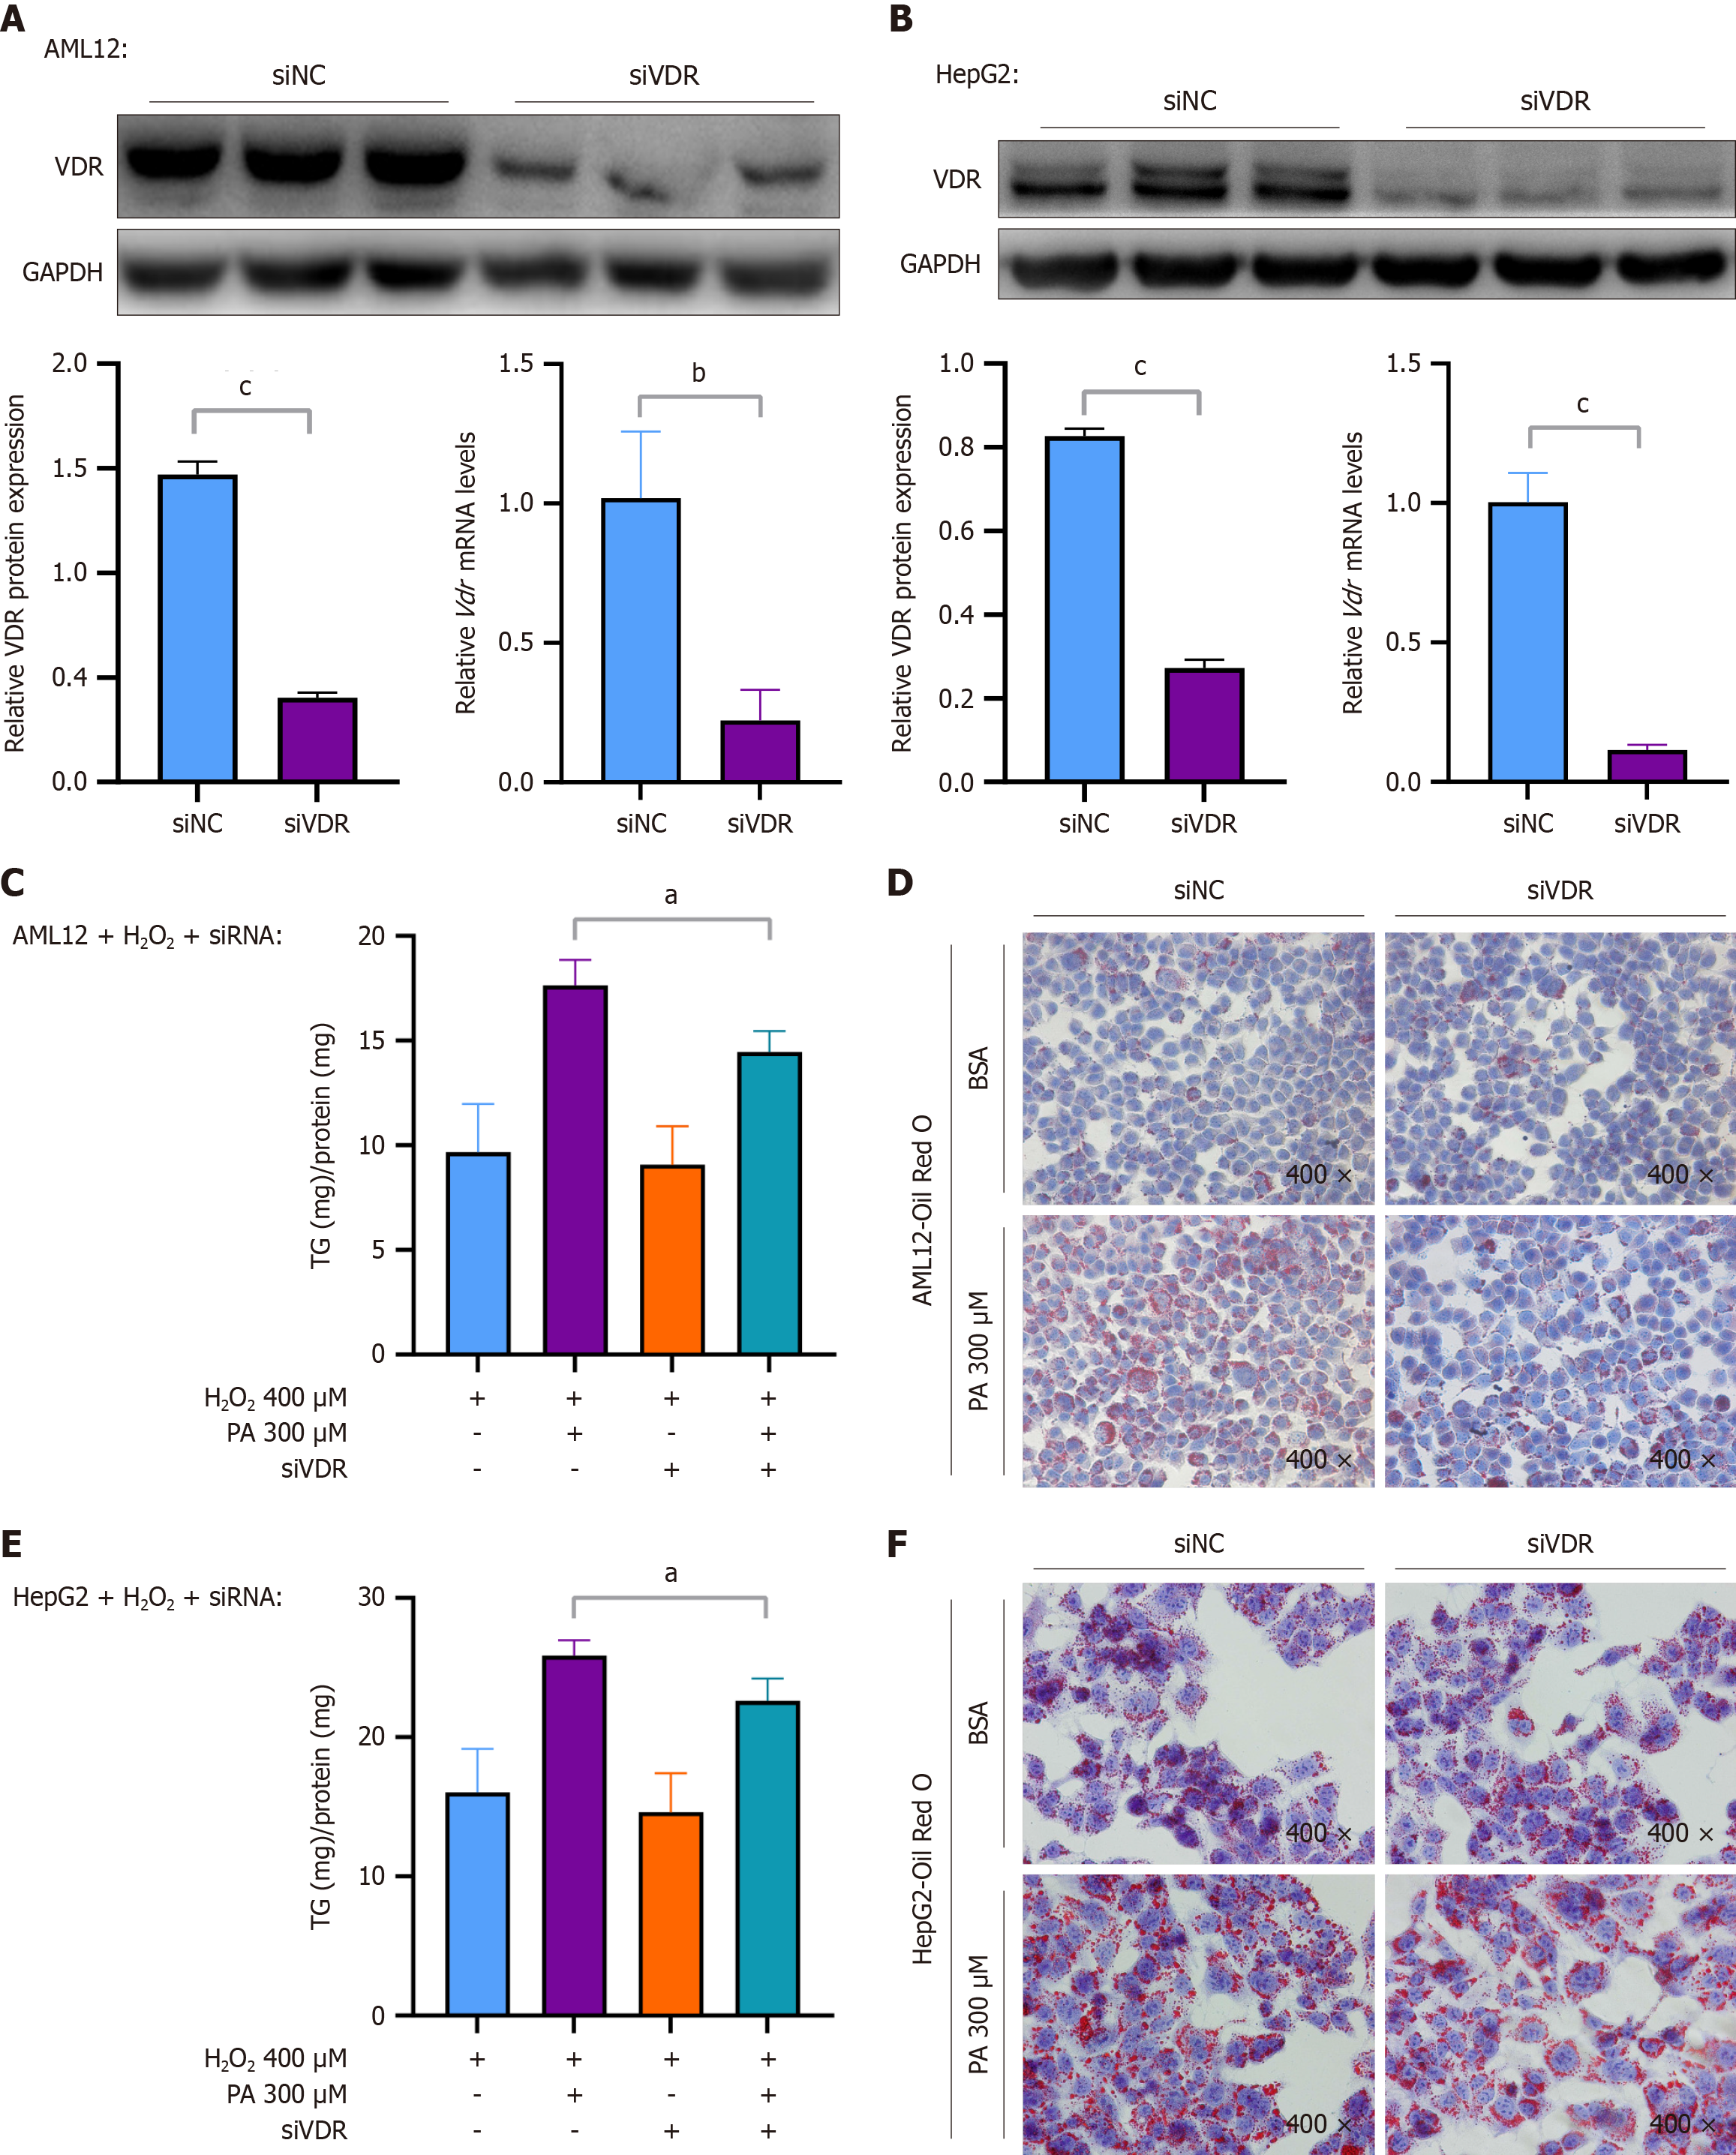
Figure 4 Downregulation of vitamin D receptor alleviated palmitic acid-induced steatosis when cellular senescence was induced.
A: Protein expression level of the vitamin D receptor (VDR) and corresponding quantitative results, and mRNA level of VDR in AML12 cells transfected with the small interfering-negative control (siNC) or the VDR knockdown construct small interfering-VDR (siVDR); B: Protein expression level of VDR and corresponding quantitative results, and mRNA level of VDR in HepG2 cells treated with siNC or siVDR; C and D: Cellular levels of triglycerides and Oil Red O staining (× 400) of AML12 cells treated with hydrogen peroxide (H2O2) (400 μM) for 6 hours, transfected with siNC or siVDR, and stimulated with palmitic acid (PA) (300 μM) for 24 hours; E and F: Cellular levels of triglycerides and Oil Red O staining (× 400) of HepG2 cells treated with H2O2 (400 μM) for 6 hours, transfected with siNC or siVDR, and stimulated with PA (300 μM) for 24 hours. Protein levels and mRNA levels were normalized to those of glyceraldehyde-3-phosphate dehydrogenase. The data are presented as the means ± SDs. aP < 0.05. bP < 0.01. cP < 0.001. P calculated as determined via student’s t tests and one-way analysis of variance with Tukey’s correction. VDR: Vitamin D receptor; GAPDH: Glyceraldehyde-3-phosphate dehydrogenase; si-NC: Small interfering-negative control; si-VDR: Small interfering-vitamin D receptor; H2O2: Hydrogen peroxide; BSA: Bovine serum albumin; PA: Palmitic acid.
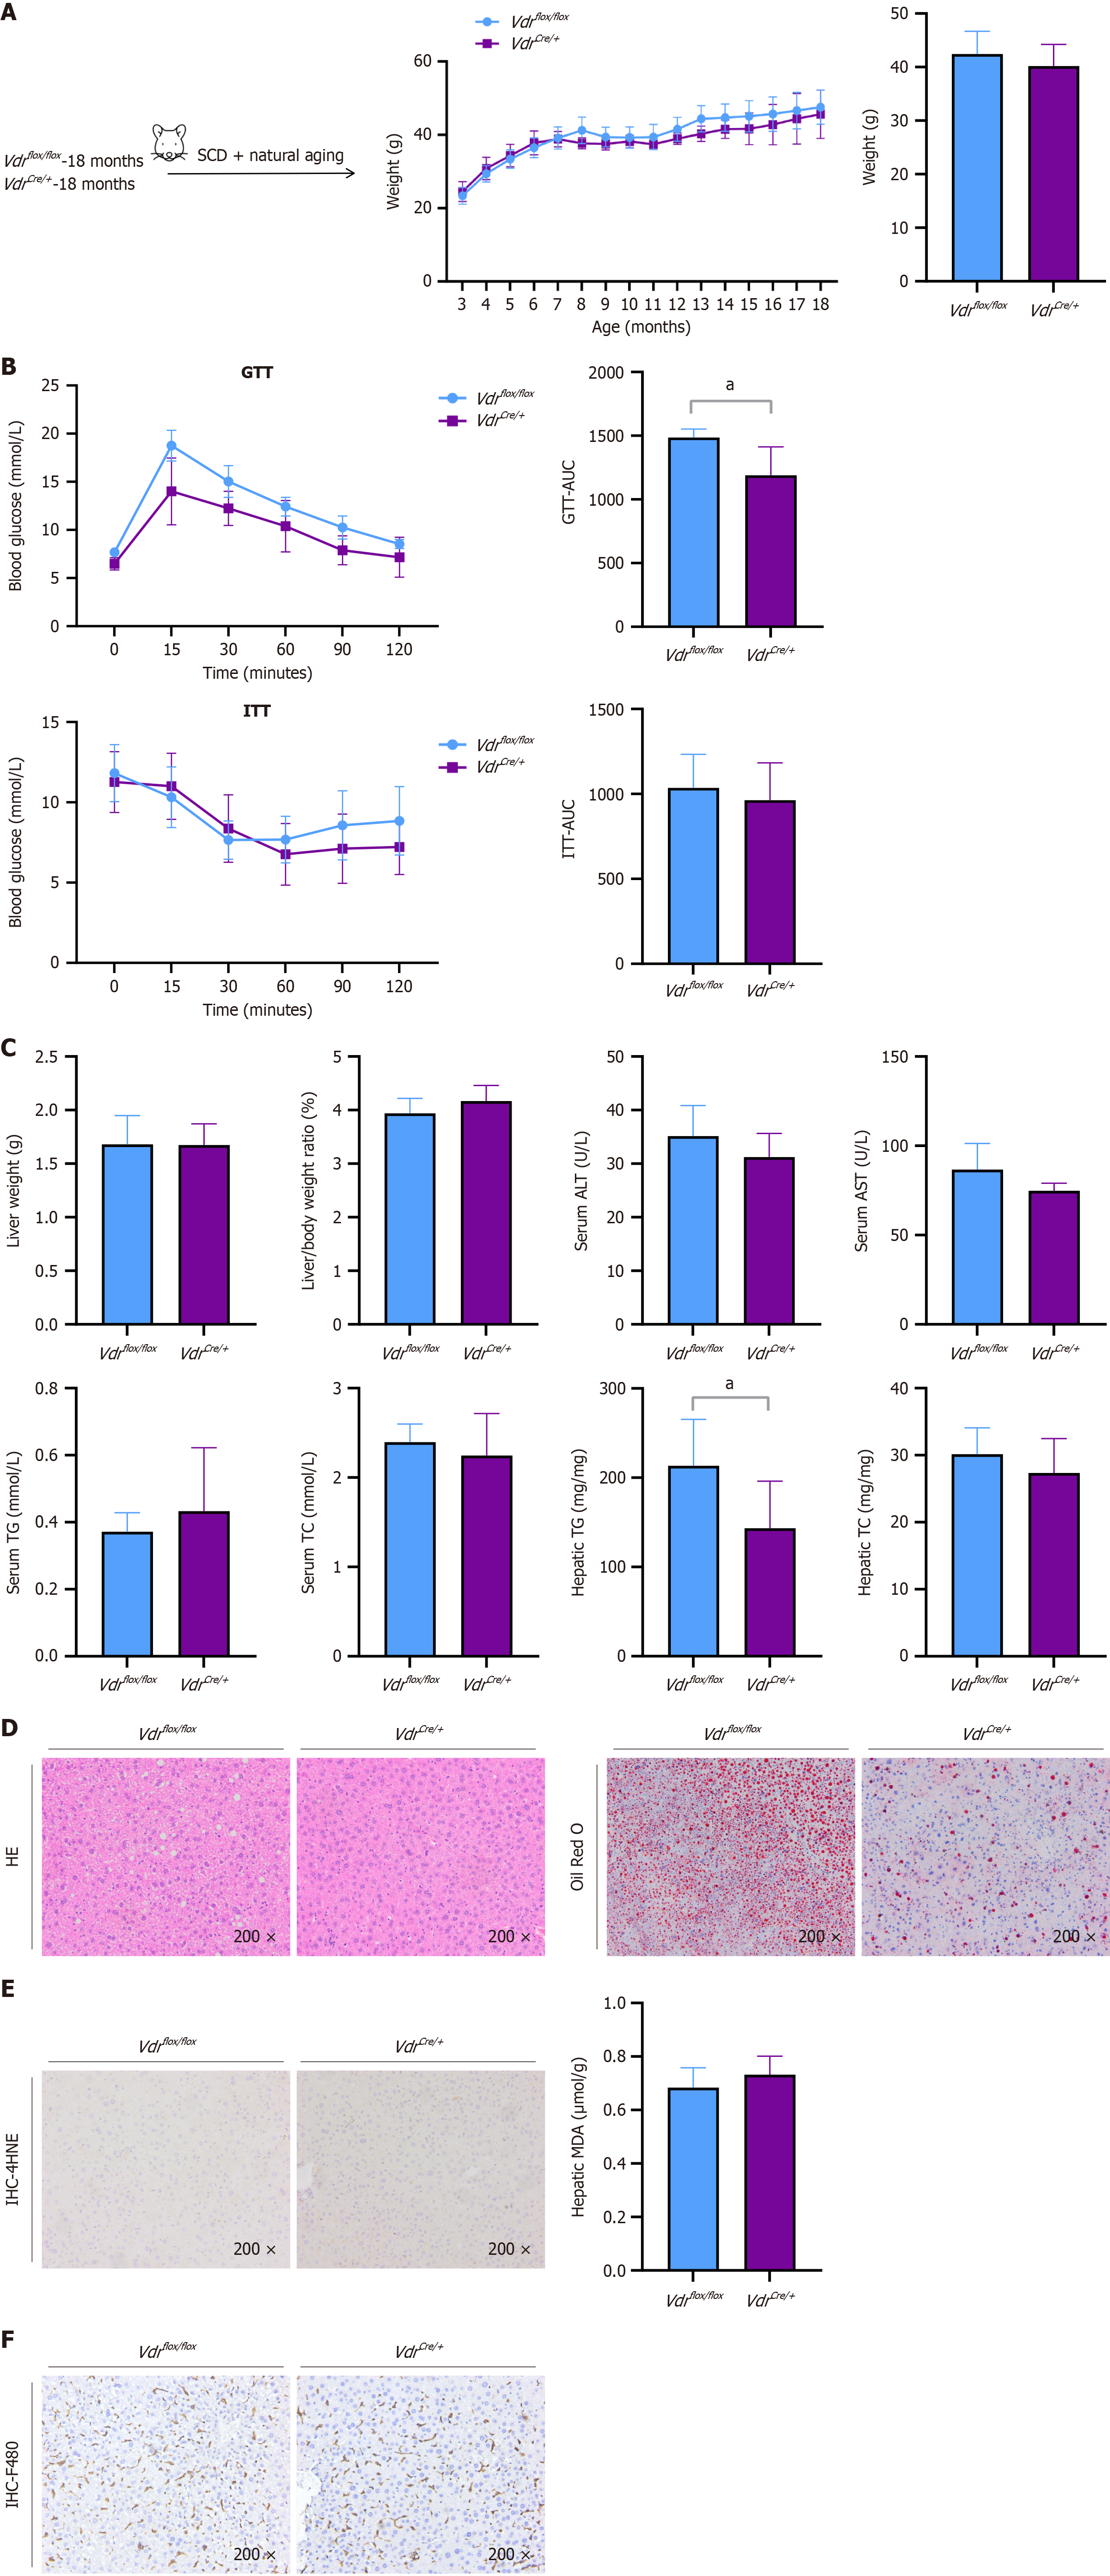
Figure 5 The hepatic-specific knockout of vitamin D receptor ameliorated hepatic steatosis associated with senescence.
Eighteen-month-old vitamin D receptor (VDR)flox/flox mice and 18-month-old VDRCre/+ mice were fed a standard chow diet. A: Weights and changes in weight; B: Glucose tolerance test and associated area under the curve (AUC). Insulin tolerance test and associated AUC; C: Liver weights, liver-to-body weight ratio; serum levels of alanine aminotransferase, aspartate aminotransferase, triglycerides (TGs), and total cholesterol (TC), and hepatic levels of TGs and TC; D: Hematoxylin-eosin and Oil Red O staining (× 200) of the liver sections; E: Immunohistochemical (IEC) staining (× 200) for VDR in liver sections and hepatic levels of malondialdehyde; F: IHC staining (× 200) for F480 in liver sections. The data are presented as the means ± SDs. aP < 0.05. P calculated according to student’s t tests. SCD: Standard chow diet; GTT: Glucose tolerance test; ITT: Insulin tolerance test; AUC: Area under the curve; ALT: Alanine aminotransferase; AST: Aspartate aminotransferase; TG: Triglycerides; TC: Total cholesterol; HE: Hematoxylin-eosin; MDA: Malondialdehyde; IEC: Immunohistochemical.
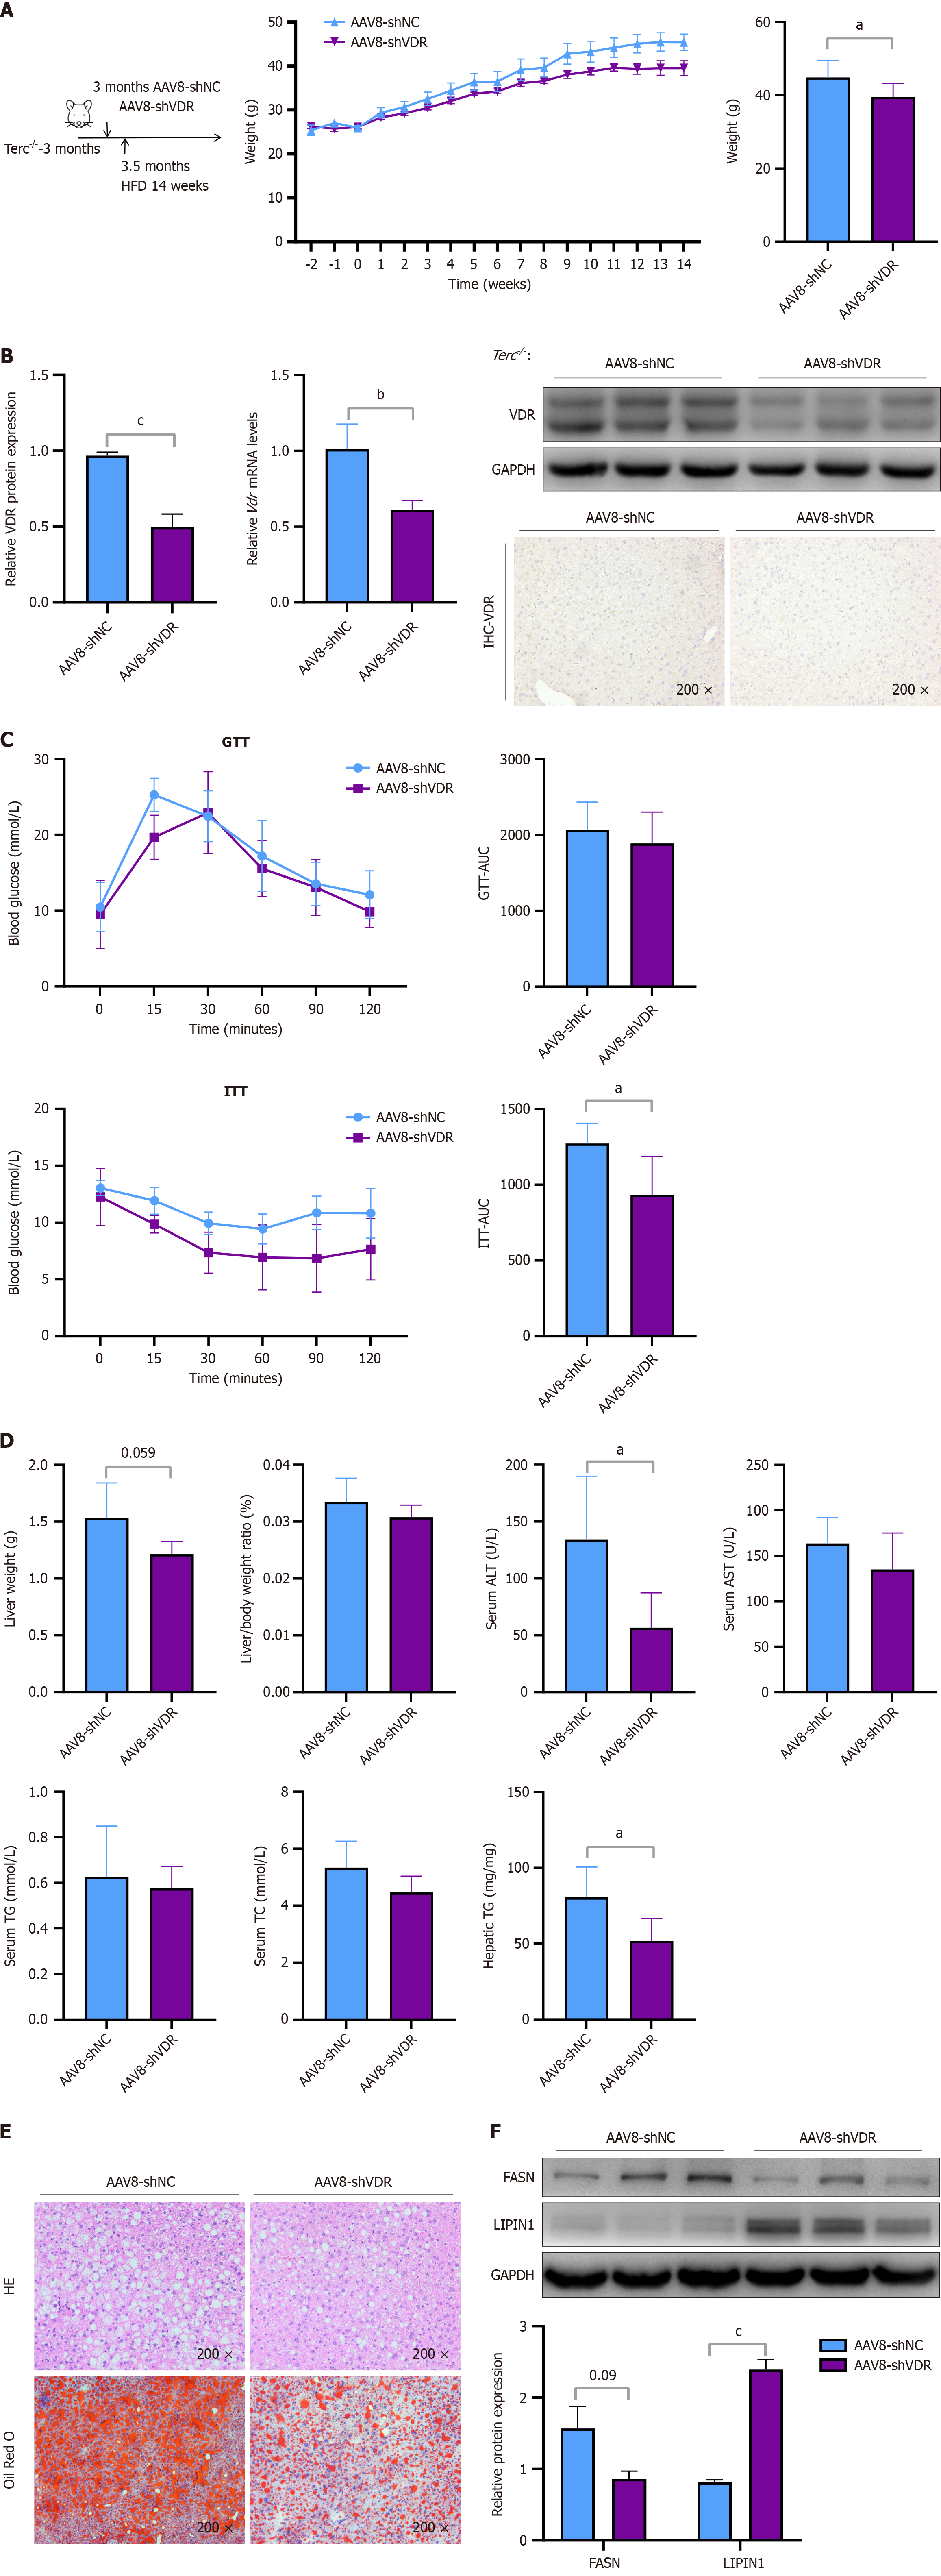
Figure 6 The hepatic-specific downregulation of vitamin D receptor ameliorated hepatic steatosis in telomerase RNA component knockout mice mice.
Telomerase RNA component knockout mice were injected with adeno-associated virus 8 (AAV8)-short hairpin (sh)-negative control (NC) or AAV8-sh-vitamin D receptor (VDR) at 3 months of age. Two weeks after the injection, these mice were fed a high-fat diet for 14 weeks. A: Weights and changes in weight; B: The protein expression level of VDR and corresponding quantitative results, the mRNA level of VDR, and immunohistochemical staining (× 200) for VDR in liver sections; C: Glucose tolerance test and associated area under the curve (AUC). Insulin tolerance test and associated AUC; D: Liver weights, liver-to-body weight ratio, serum levels of alanine aminotransferase, aspartate aminotransferase, triglycerides (TGs), and total cholesterol, and hepatic levels of TGs; E: Hematoxylin-eosin and Oil Red O staining (× 200) of the liver sections; F: The protein expression levels of FASN and LIPIN1 and corresponding quantitative results. Protein levels and mRNA levels were normalized to those of glyceraldehyde-3-phosphate dehydrogenase. The data are presented as the means ± SDs. aP < 0.05. bP < 0.01. cP < 0.001. P calculated according to student’s t tests. AAV8: Adeno-associated virus 8; shNC: Short hairpin-negative control; shVDR: Short hairpin vitamin D receptor; HE: Hematoxylin-eosin; VDR: Vitamin D receptor; GAPDH: Glyceraldehyde-3-phosphate dehydrogenase; GTT: Glucose tolerance test; ITT: Insulin tolerance test; AUC: Area under the curve; ALT: Alanine aminotransferase; AST: Aspartate aminotransferase; TG: Triglycerides; TC: Total cholesterol.
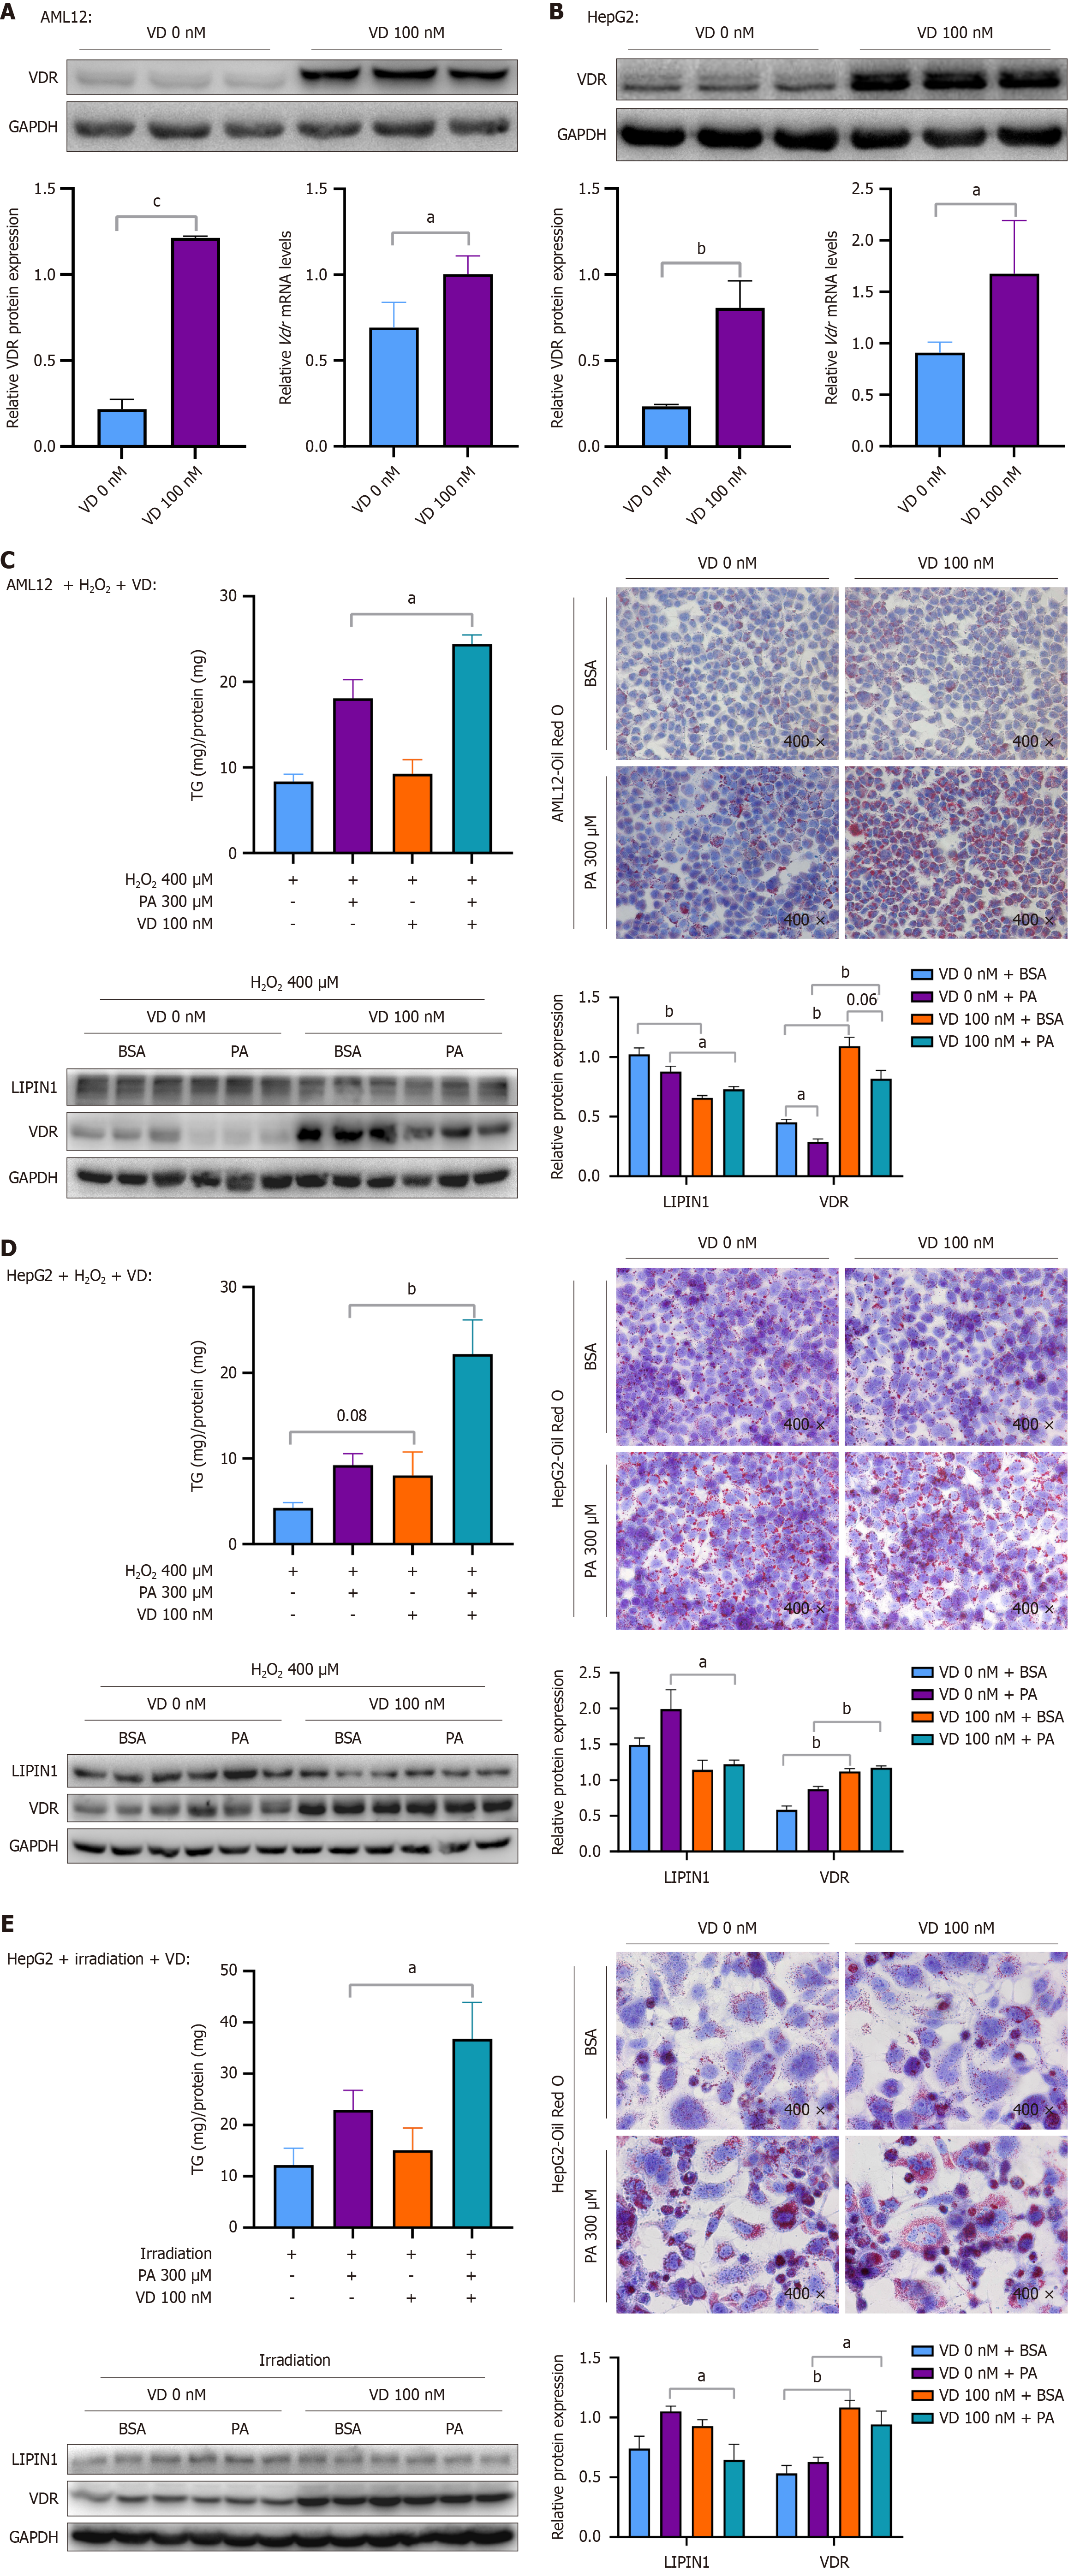
Figure 7 The upregulation of vitamin D receptor aggravated palmitic acid-induced steatosis when cellular senescence was induced.
A: Protein expression level of vitamin D receptor (VDR) and corresponding quantitative results, and mRNA level of VDR in AML12 cells treated with vitamin D (VD) (100 nM) for 12 hours; B: Protein expression level of VDR and corresponding quantitative results, and mRNA level of VDR in HepG2 cells treated with VD (100 nM) for 12 hours; C-E: Cellular levels of triglycerides, Oil Red O staining (× 400), and protein expression levels of VDR and LIPIN1 and corresponding quantitative results after cellular senescence was induced and cells were treated with VD and palmitic acid (PA). AML12 cells were treated with hydrogen peroxide (H2O2) (400 μM) for 6 hours, treated with VD (100 nM) for 12 hours, and then costimulated with VD (100 nM) and PA (300 μM) for 24 hours (C); HepG2 cells were treated with H2O2 (400 μM) for 6 hours, treated with VD (100 nM) for 12 hours, and then costimulated with VD (100 nM) and PA (300 μM) for 24 hours (D); HepG2 cells were irradiated with 8 Gy of X-rays, treated with VD (100 nM) for 12 hours, and then costimulated with VD (100 nM) and PA (300 μM) for 24 hours (E). Protein and mRNA levels were normalized to those of glyceraldehyde-3-phosphate dehydrogenase. The data are presented as the means ± SDs. aP < 0.05. bP < 0.01. cP < 0.001. P calculated as determined via student’s t tests and one-way analysis of variance with Tukey’s correction. VDR: Vitamin D receptor; GAPDH: Glyceraldehyde-3-phosphate dehydrogenase; VD: Vitamin D; H2O2: Hydrogen peroxide; BSA: Bovine serum albumin; PA: Palmitic acid.
- Citation: Zhu F, Lin BR, Lin SH, Yu CH, Yang YM. Hepatic-specific vitamin D receptor downregulation alleviates aging-related metabolic dysfunction-associated steatotic liver disease. World J Gastroenterol 2025; 31(14): 104117
- URL: https://www.wjgnet.com/1007-9327/full/v31/i14/104117.htm
- DOI: https://dx.doi.org/10.3748/wjg.v31.i14.104117


