Copyright
©The Author(s) 2025.
World J Gastroenterol. Apr 7, 2025; 31(13): 102563
Published online Apr 7, 2025. doi: 10.3748/wjg.v31.i13.102563
Published online Apr 7, 2025. doi: 10.3748/wjg.v31.i13.102563
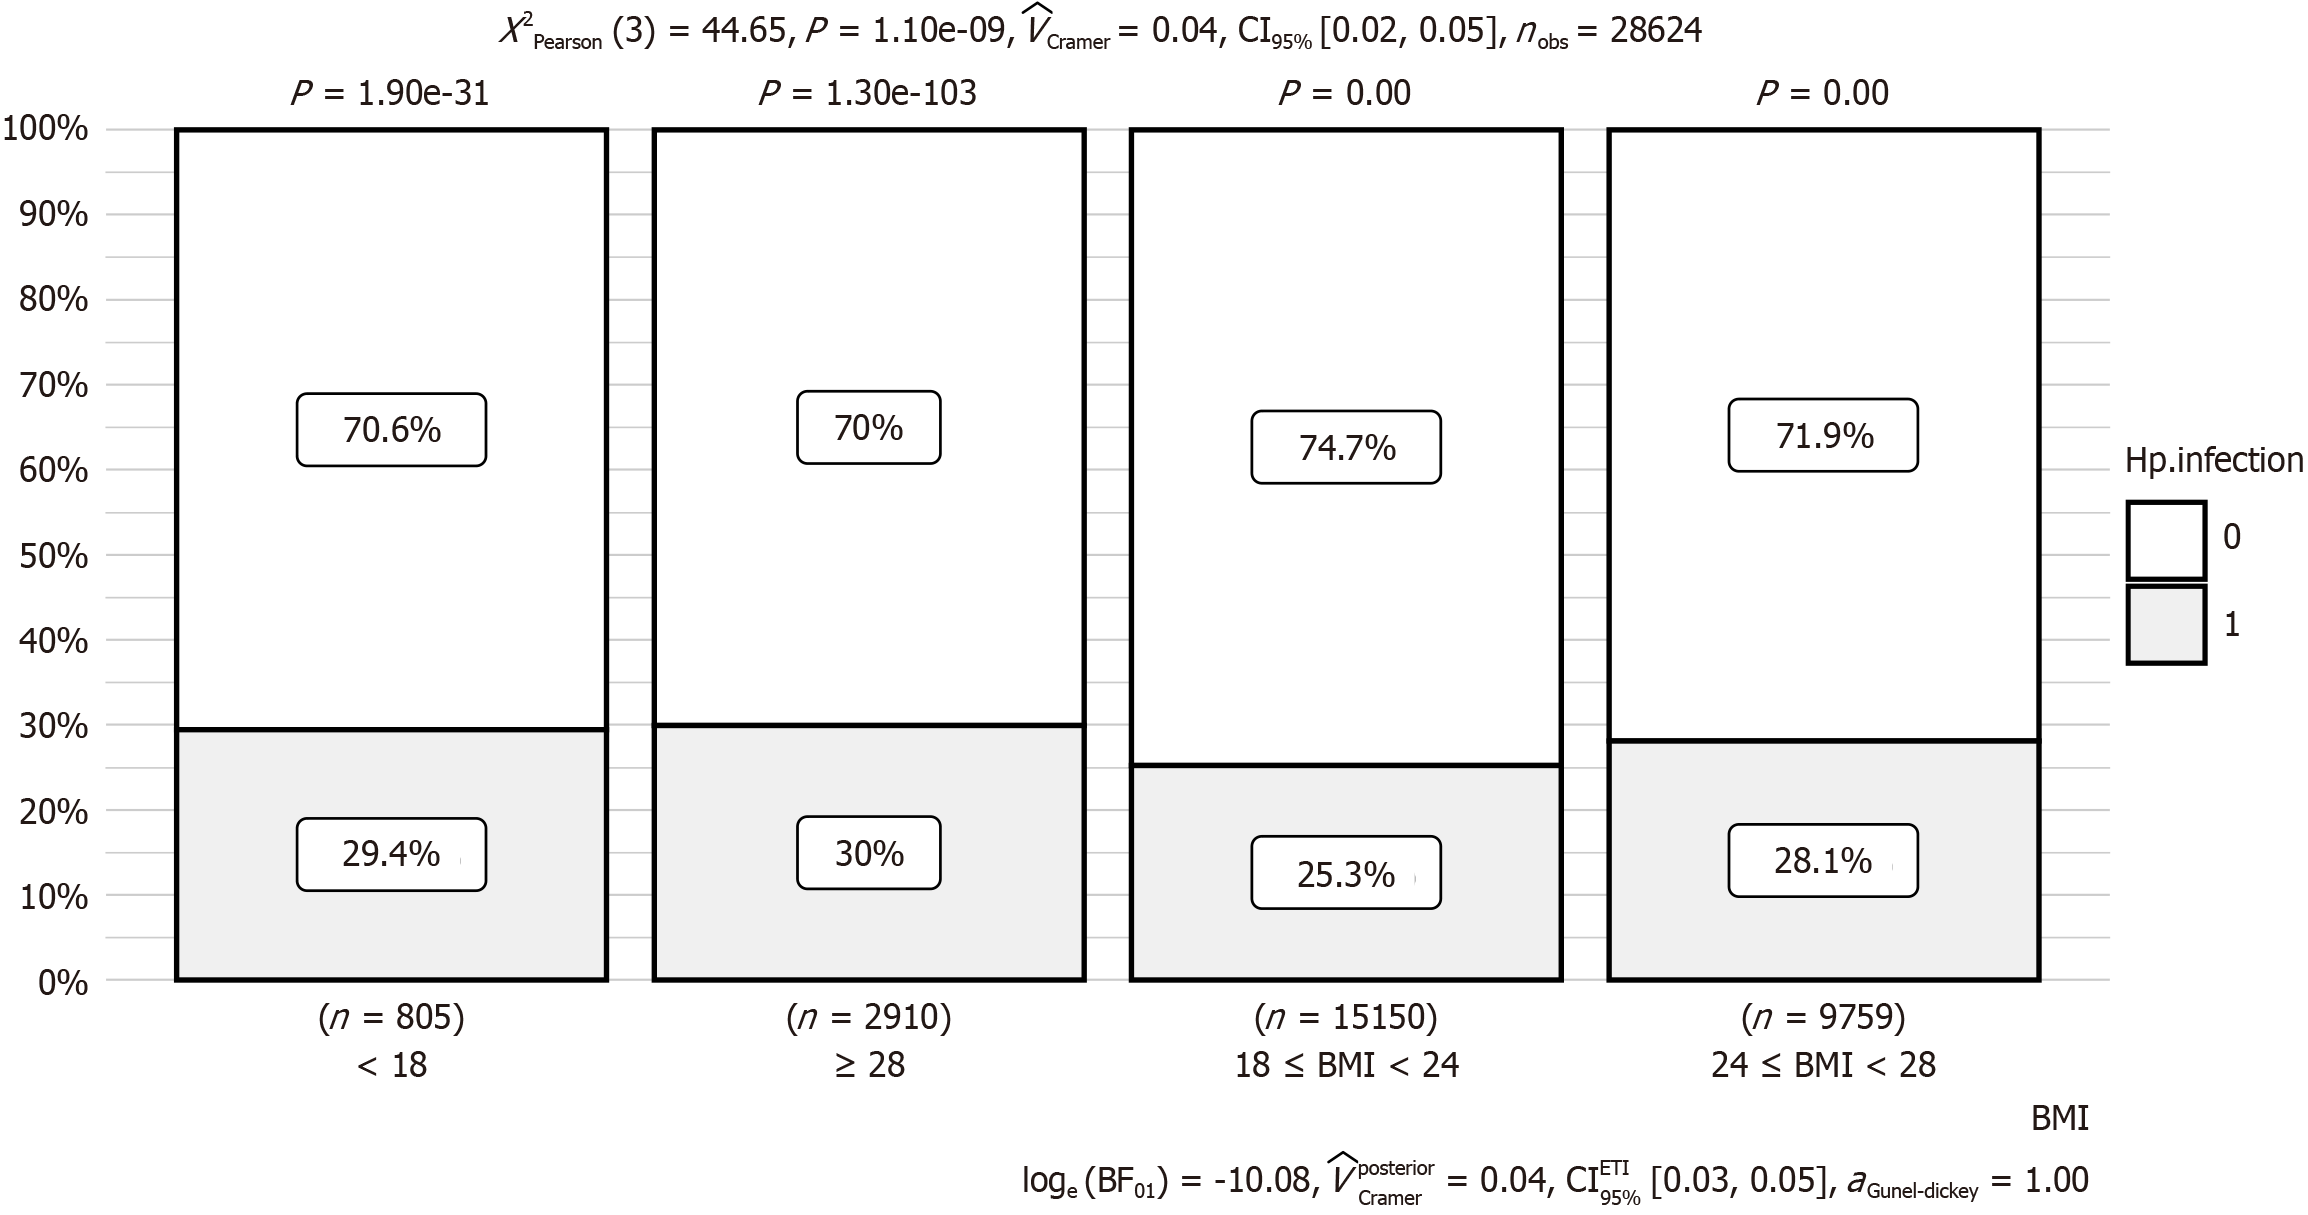
Figure 1 Associations between Helicobacter pylori infection and body mass index.
The χ2 test revealed significant differences in Helicobacter pylori infection rates across body mass index (BMI) groups [χ² (3) = 44.65, P < 0.001]. Cramer’s V = 0.04 (95%CI: 0.02-0.05) suggested a weak association. The Bayesian factor [log(BF01) = −10.08] strongly supported the alternative hypothesis. BMI categories: < 18 kg/m² (underweight), 18-23.9 kg/m² (normal weight), 24-27.9 kg/m² (overweight), ≥ 28 kg/m² (obese). Hp: Helicobacter pylori.
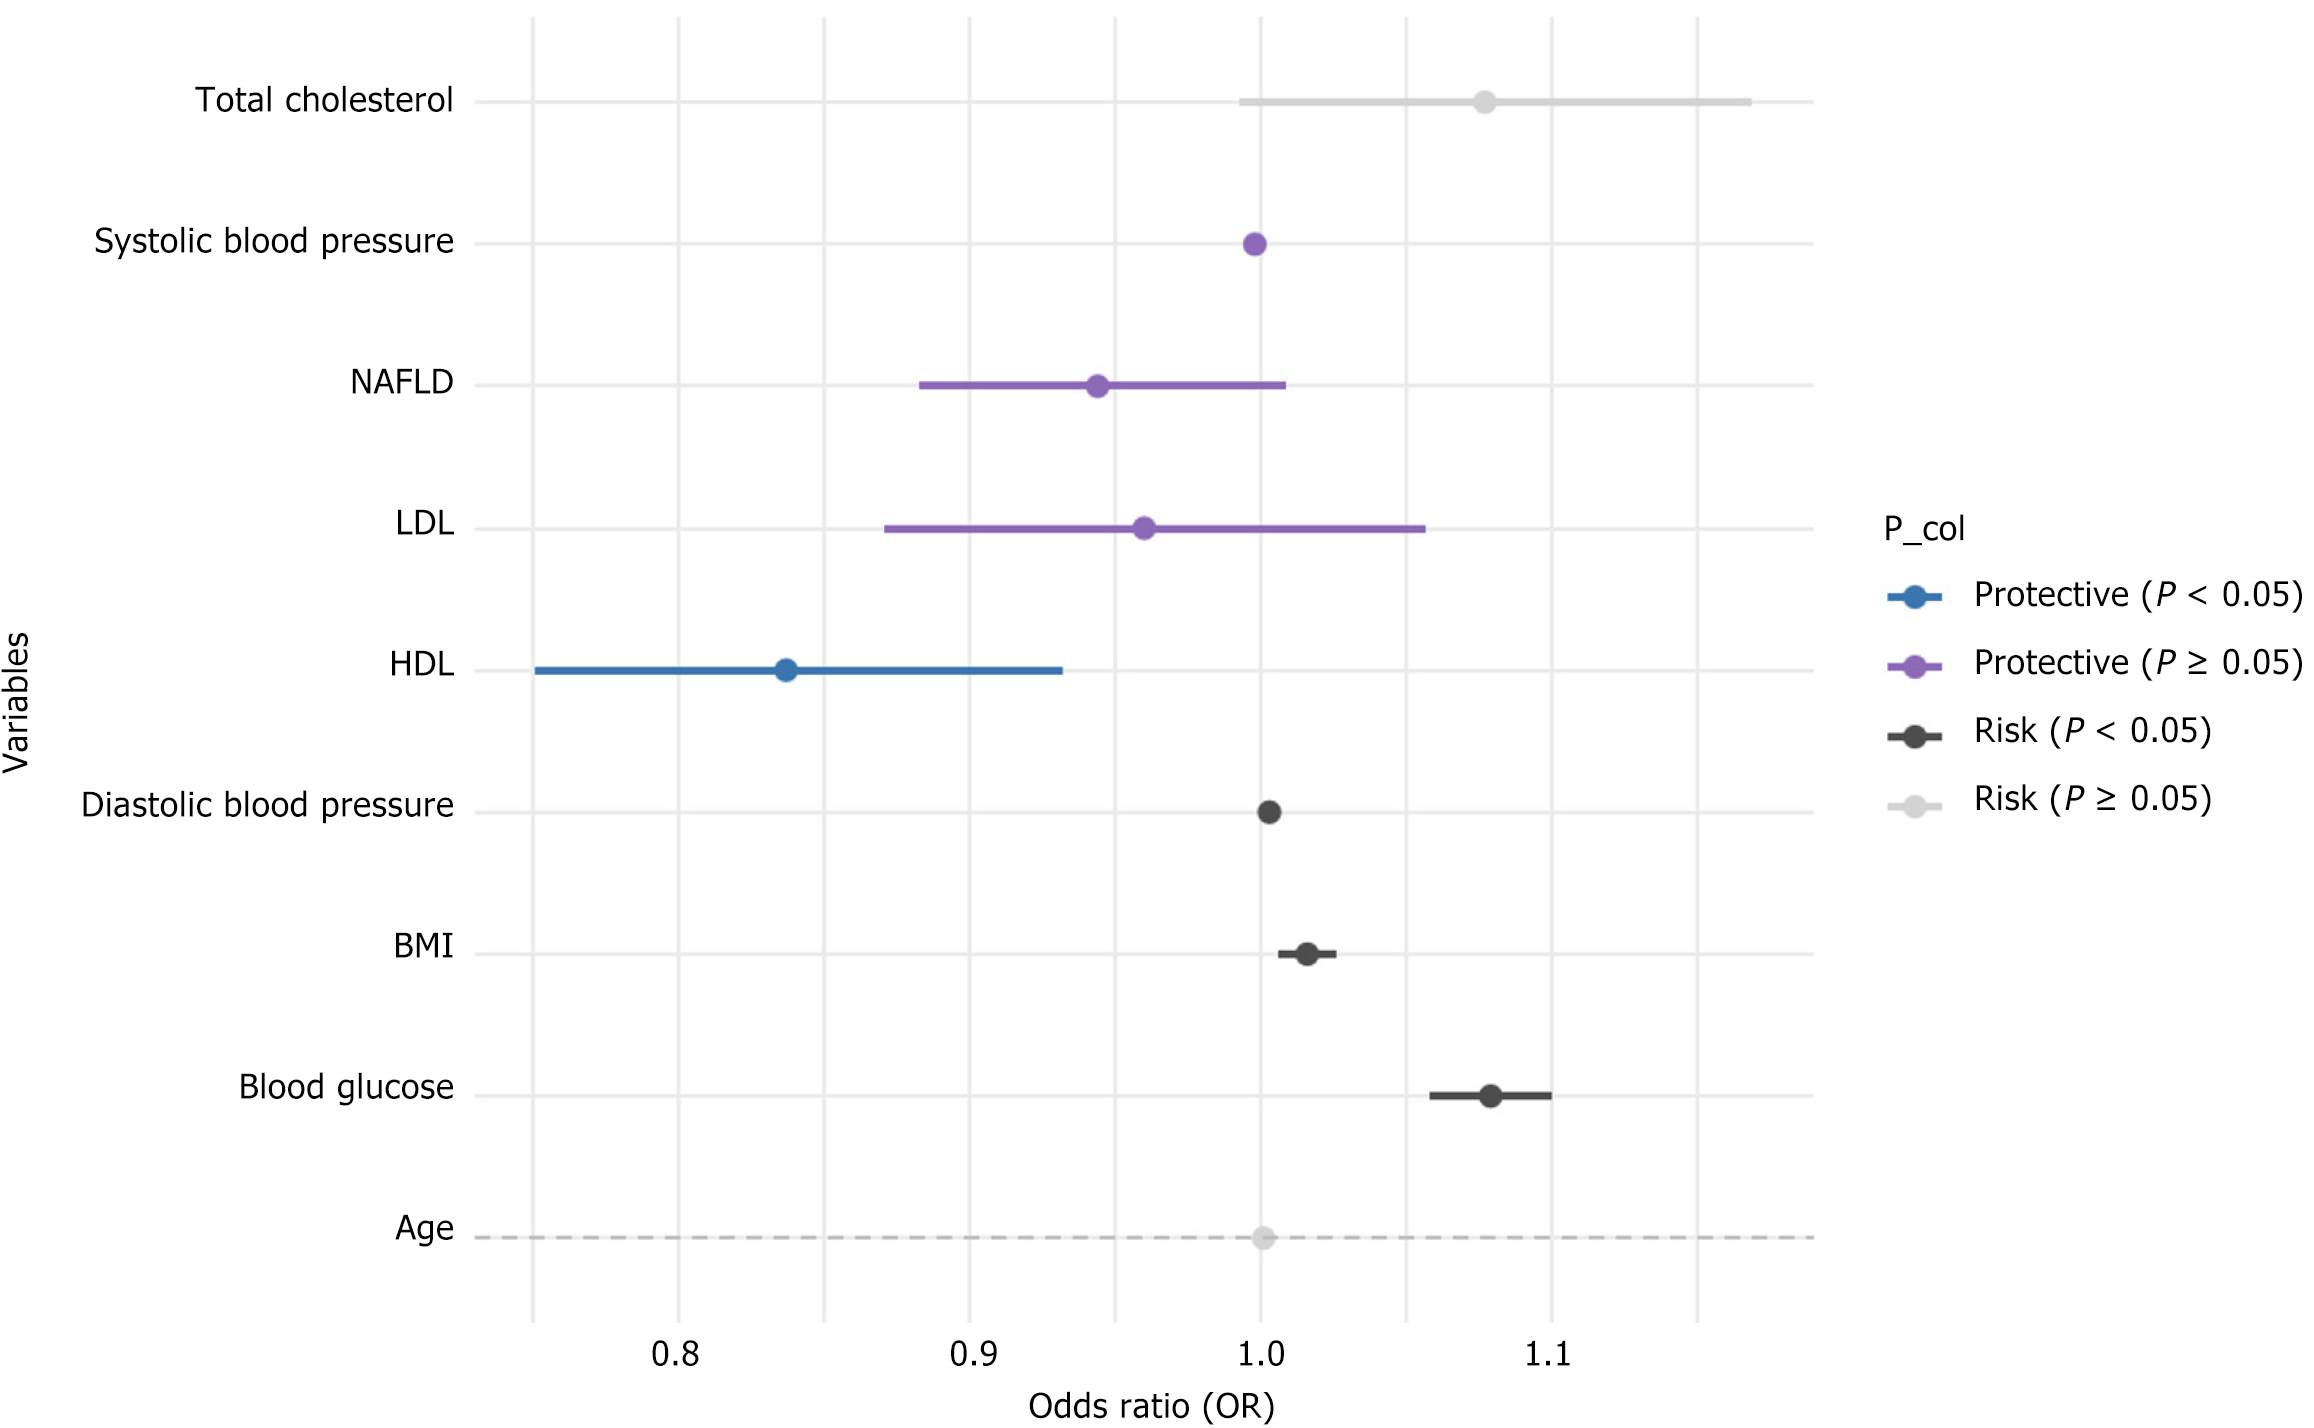
Figure 2 Binary logistic regression analysis of risk factors for Helicobacter pylori infection.
The figure presents the results of a binary logistic regression analysis to assess risk factors associated with Helicobacter pylori infection. The "odds ratio" column displays the odds ratio for each variable, with different colors distinguishing protective factors from risk factors. BMI: Body mass index; HDL: High-density lipoprotein; LDL: Low density lipoprotein; NAFLD: Non-alcoholic fatty liver disease.
- Citation: Ye L, Yan K, Tian Z, Xiao ZH, Xie RY, Xie ZY, Tao L. Helicobacter pylori infection is linked to metabolic dysfunction and associated steatotic liver disease: A large cross-sectional study. World J Gastroenterol 2025; 31(13): 102563
- URL: https://www.wjgnet.com/1007-9327/full/v31/i13/102563.htm
- DOI: https://dx.doi.org/10.3748/wjg.v31.i13.102563


