Copyright
©The Author(s) 2025.
World J Gastroenterol. Mar 28, 2025; 31(12): 104081
Published online Mar 28, 2025. doi: 10.3748/wjg.v31.i12.104081
Published online Mar 28, 2025. doi: 10.3748/wjg.v31.i12.104081
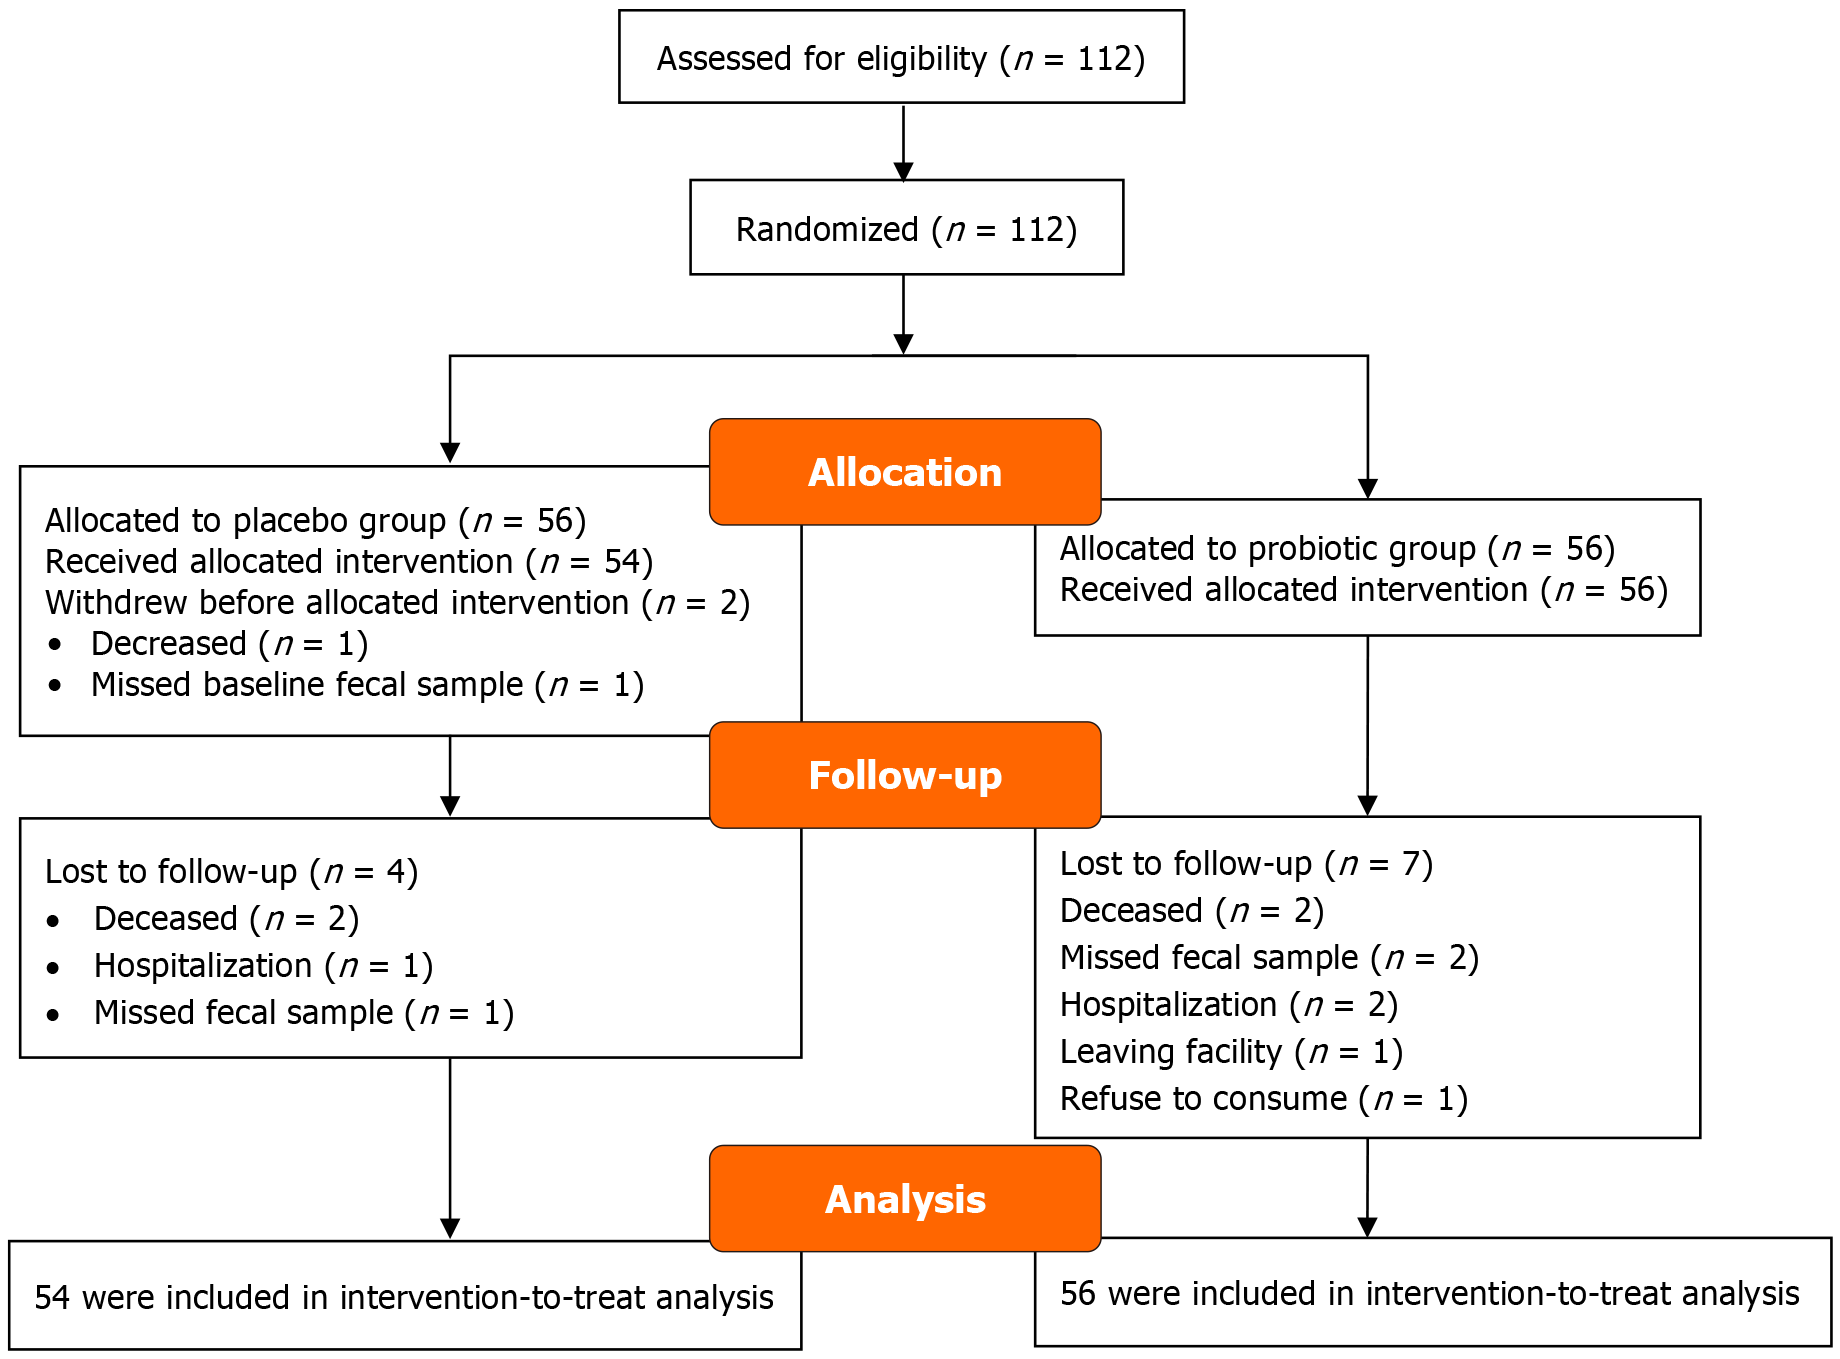
Figure 1 Flow diagram representing the study.
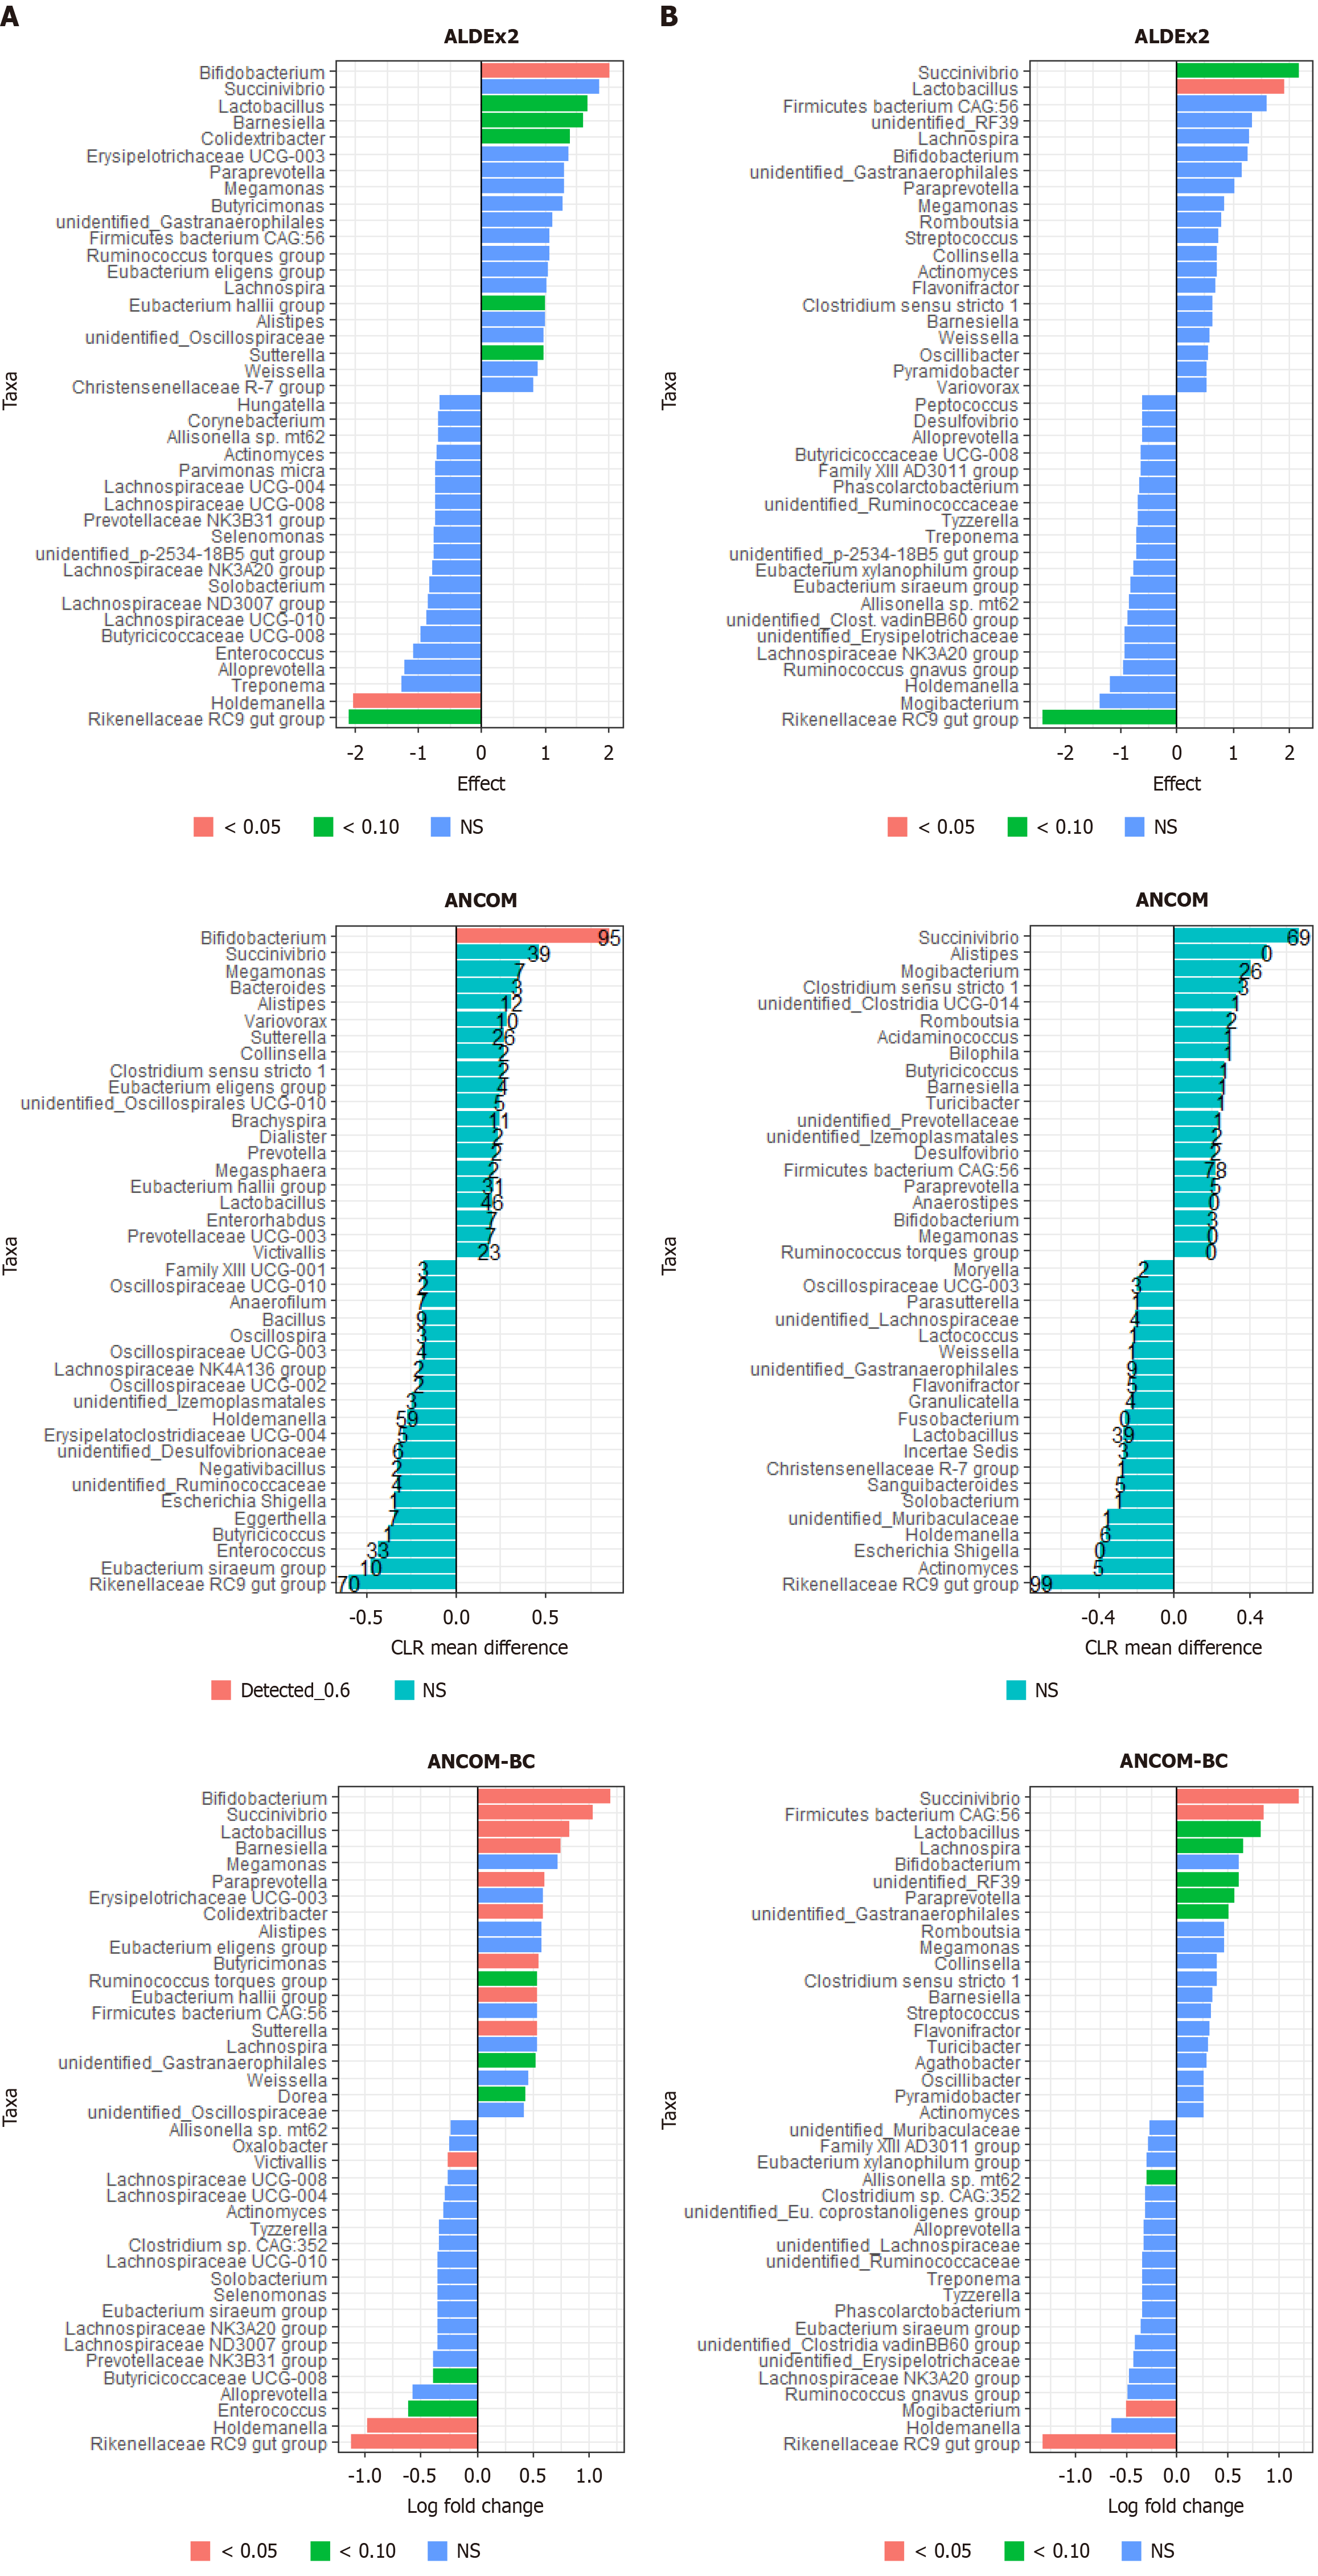
Figure 2 The top and bottom 20 differentially abundant bacterial genera at three months and six months, compared to the placebo group, identified by three methods (ALDEx2, ANCOM, and ANCOM-BC) with their respective metrics.
A: Three months; B: Six months. The number next to the ANCOM bar represents the W value.
- Citation: Sujaya IN, Mariyatun M, Hasan PN, Manurung NEP, Pramesi PC, Juffrie M, Utami T, Cahyanto MN, Yamamoto S, Takahashi T, Asahara T, Akiyama T, Rahayu ES. Randomized study of Lacticaseibacillus fermented milk in Indonesian elderly houses: Impact on gut microbiota and gut environment. World J Gastroenterol 2025; 31(12): 104081
- URL: https://www.wjgnet.com/1007-9327/full/v31/i12/104081.htm
- DOI: https://dx.doi.org/10.3748/wjg.v31.i12.104081


