Copyright
©The Author(s) 2025.
World J Gastroenterol. Mar 21, 2025; 31(11): 103178
Published online Mar 21, 2025. doi: 10.3748/wjg.v31.i11.103178
Published online Mar 21, 2025. doi: 10.3748/wjg.v31.i11.103178
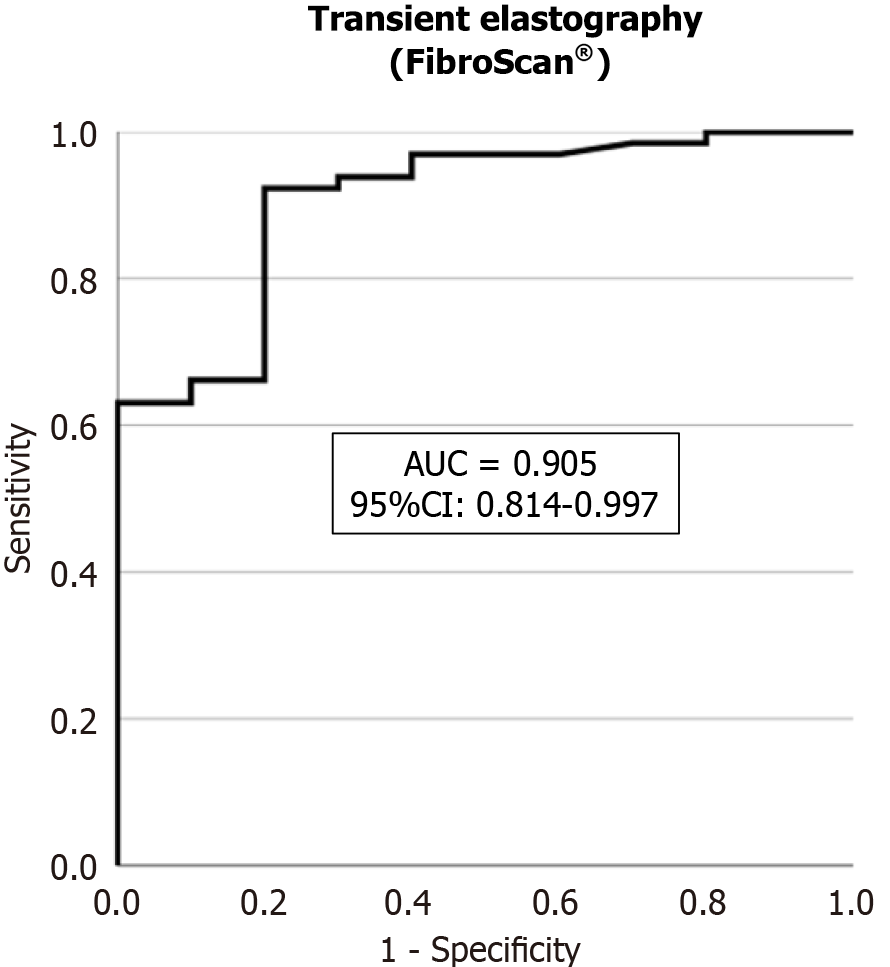
Figure 1 Area under the curve of liver stiffness measurement by transient elastography for the diagnosis of Fontan-associated liver disease.
The area under the curve is 0.905. AUC: Area under curve; CI: Confidence interval.
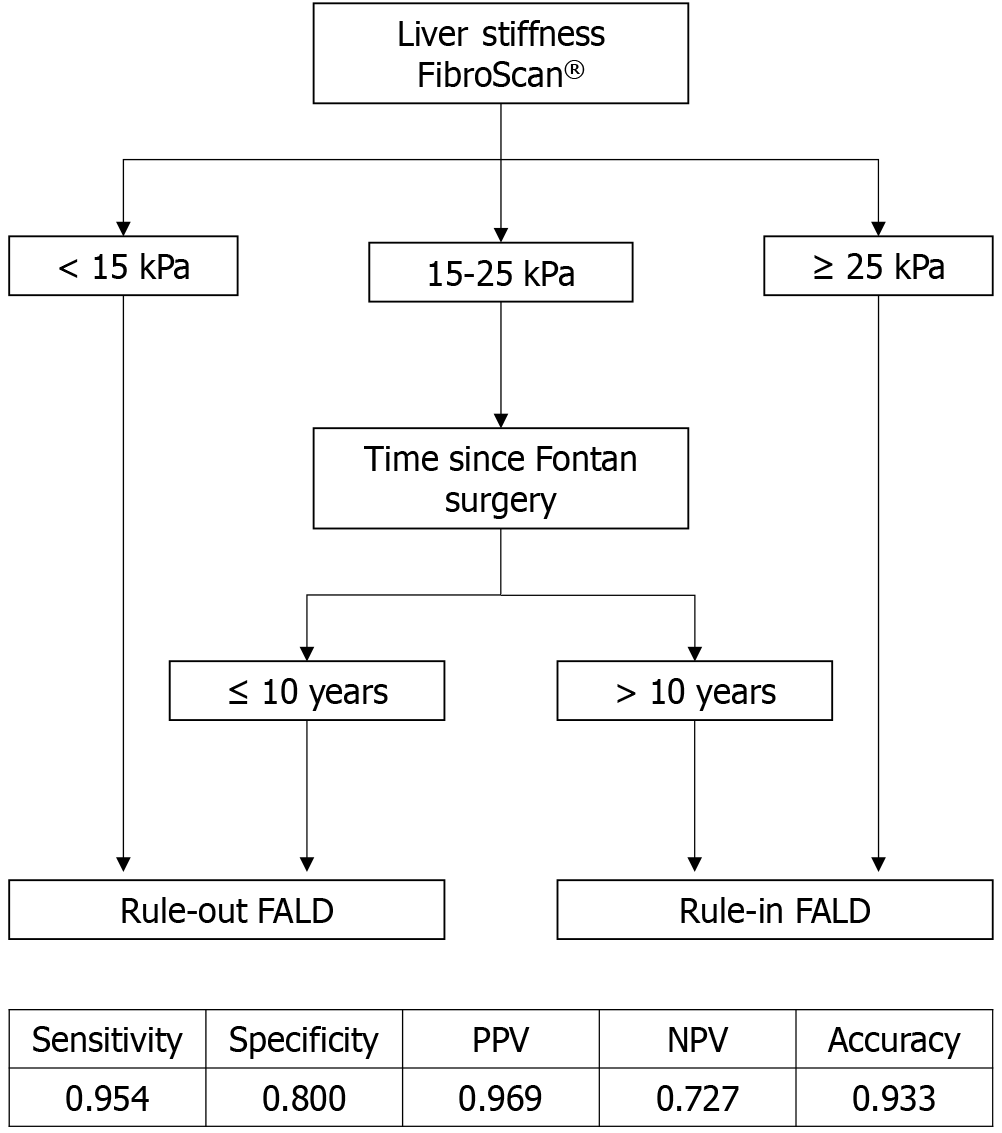
Figure 2 Fontan-associated liver disease algorithm based on the liver stiffness measurement by transient elastography and elapsed time since Fontan surgery.
The algorithm rules-out Fontan-associated liver disease (FALD) when the liver stiffness measurement by transient elastography (FibroScan®) is < 15 kPa, and rules-in FALD when it is ≥ 25 kPa. For patients in the “grey area” of 15-25 kPa, elapsed time since Fontan surgery is used. When the time elapsed is ≤ 10 years, FALD is ruled-out, and when it is > 10 years, it is ruled-in. FALD: Fontan-associated liver disease; PPV: Positive predictive value; NPV: Negative predictive value.
- Citation: Cuadros M, Abadía M, Castillo P, Martín-Arranz MD, Gonzalo N, Romero M, García-Sánchez A, García-Samaniego J, Olveira A, Ruiz-Cantador J, González-Fernández Ó, Ponz I, Merás P, Merino C, Rodríguez-Chaverri A, Balbacid E, Froilán C. Role of transient elastography in the diagnosis and prognosis of Fontan-associated liver disease. World J Gastroenterol 2025; 31(11): 103178
- URL: https://www.wjgnet.com/1007-9327/full/v31/i11/103178.htm
- DOI: https://dx.doi.org/10.3748/wjg.v31.i11.103178


