Copyright
©The Author(s) 2025.
World J Gastroenterol. Jan 7, 2025; 31(1): 96199
Published online Jan 7, 2025. doi: 10.3748/wjg.v31.i1.96199
Published online Jan 7, 2025. doi: 10.3748/wjg.v31.i1.96199
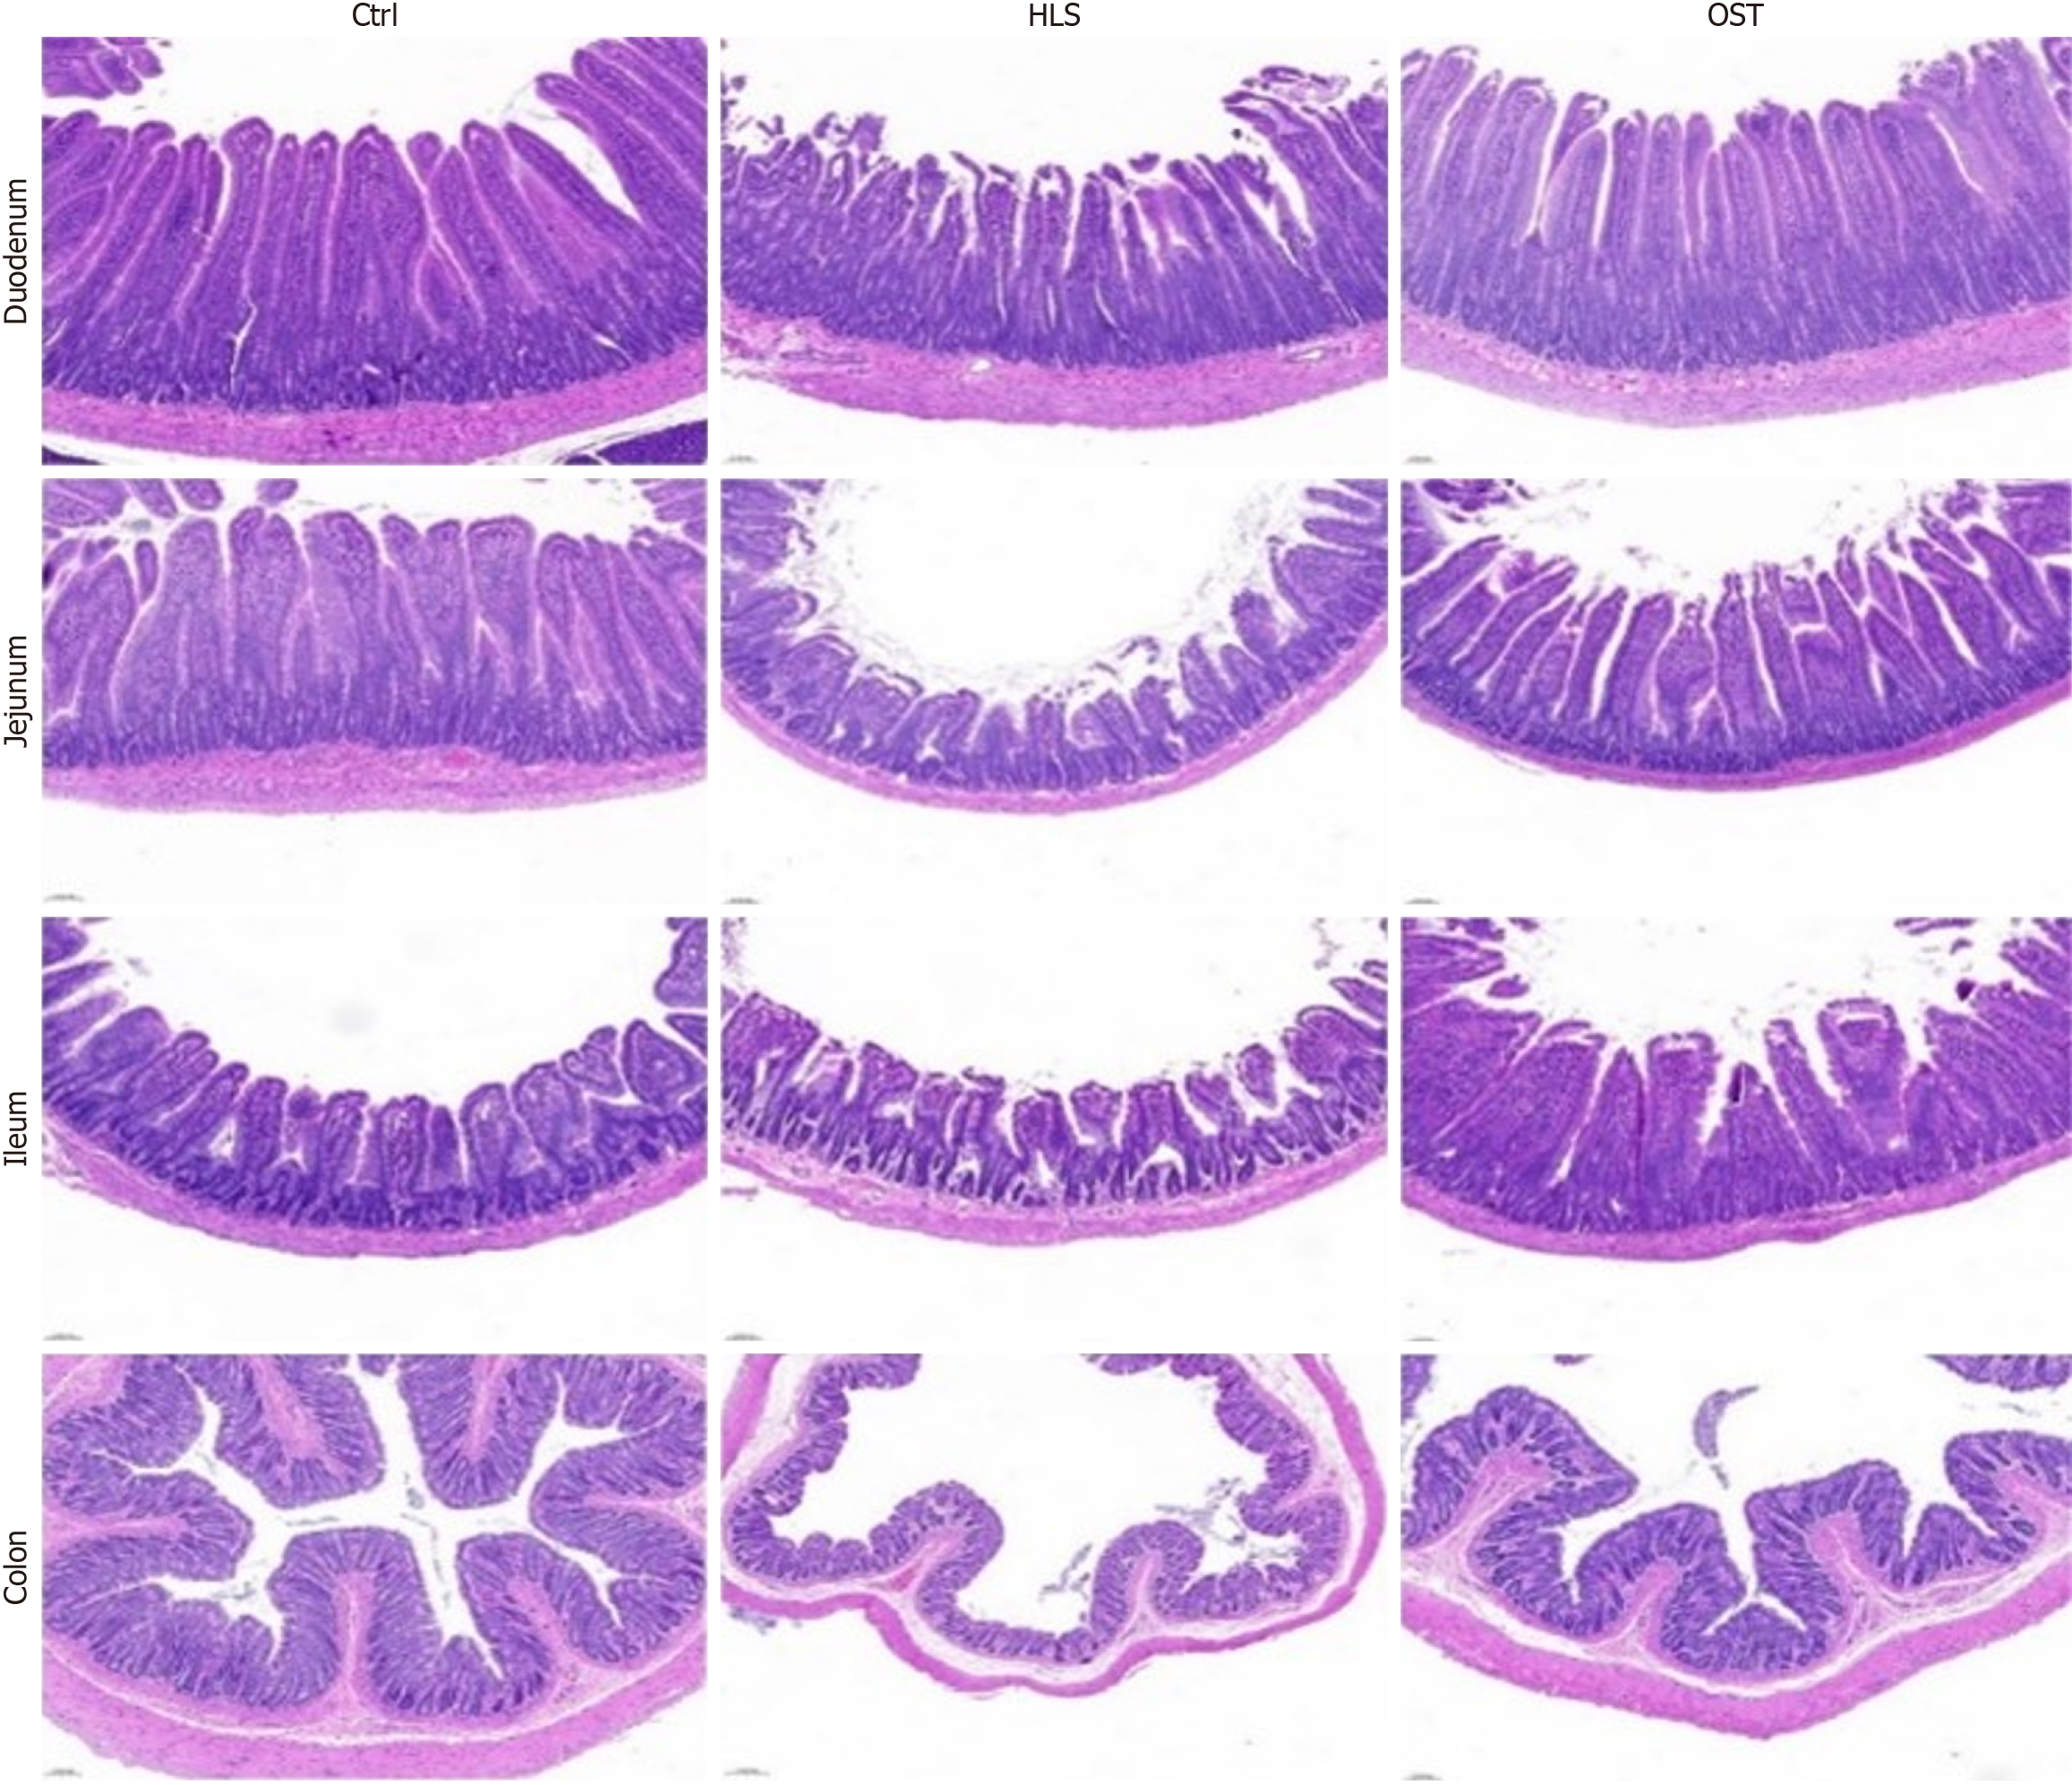
Figure 1 The tissues of each group were stained by hematoxylin and eosin.
Ctrl: Control group (200 mm); HLS: Tail-hanging group (200 mm); OST: Tail-hanging administration group (200 mm).
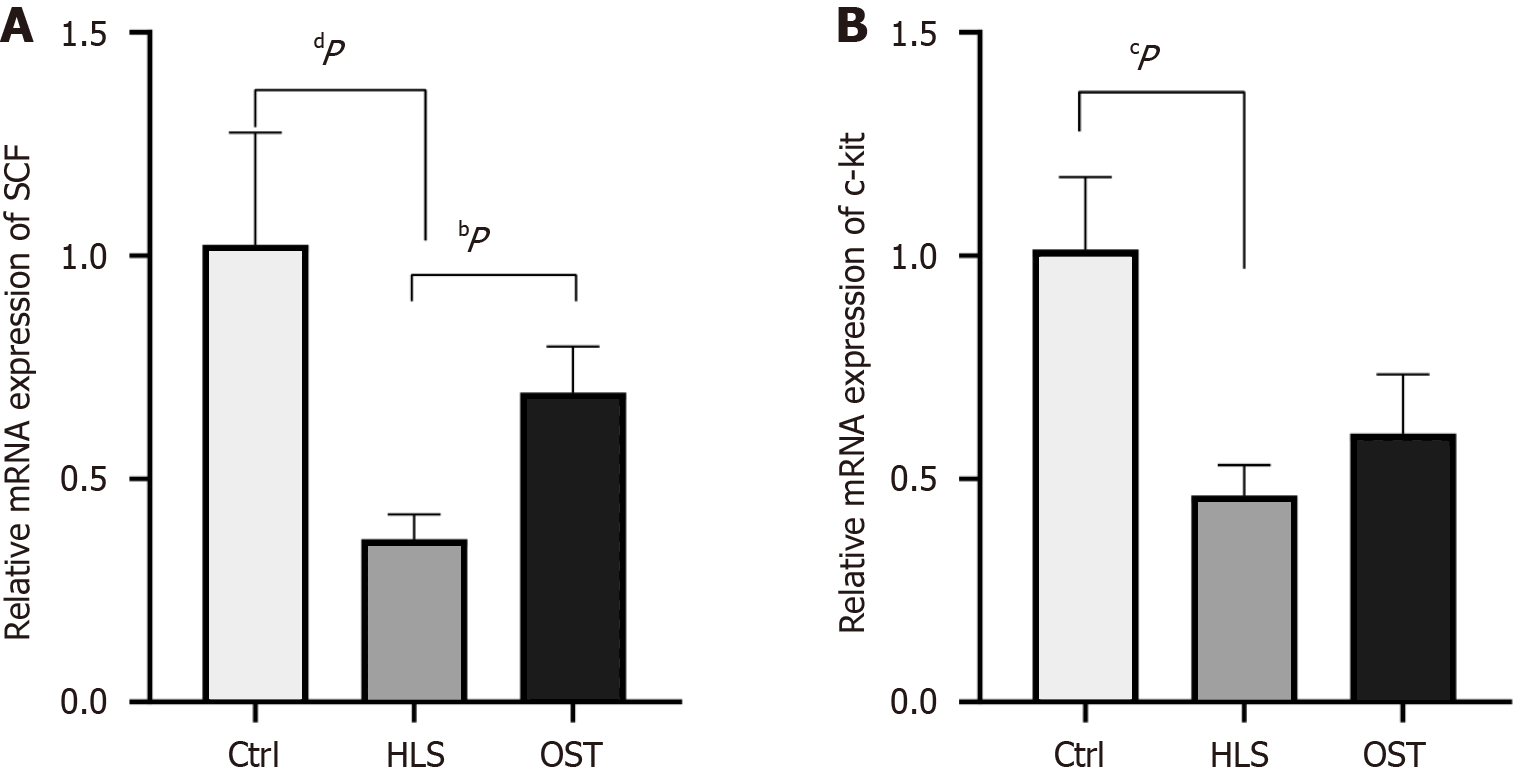
Figure 2 The expression of stem cell factor mRNA and c-kit mRNA in three groups of antrum rats was detected by Western blotting technique.
A: Stem cell factor mRNA expression and result analysis diagram by qPCR detection; B: C-kit mRNA expression and result analysis diagram by qPCR detection. Data are presented as means ± SEM, with n = 8 for each group. aP < 0.05; bP < 0.01; cP < 0.001; dP < 0.0001; Ctrl: Control group; HLS: Tail-hanging group; OST: Tail-hanging administration group; SCF: Stem cell factor.
Figure 3 Expression and data analysis of extracellular signal-regulated kinase and p-extracellular signal-regulated kinase protein in gastric tissue of three groups of rats.
A: Extracellular signal-regulated kinase (ERK) and p-ERK protein expression bands detected by Western blotting techniques; B: Histogram of ERK protein expression results; C: Histogram of p-ERK protein expression results. Data are presented as means ± SEM, with n = 3 for each group. aP < 0.05; bP < 0.01; ERK: Extracellular signal-regulated kinase; Ctrl: Control group; HLS: Tail-hanging group; OST: Tail-hanging administration group.
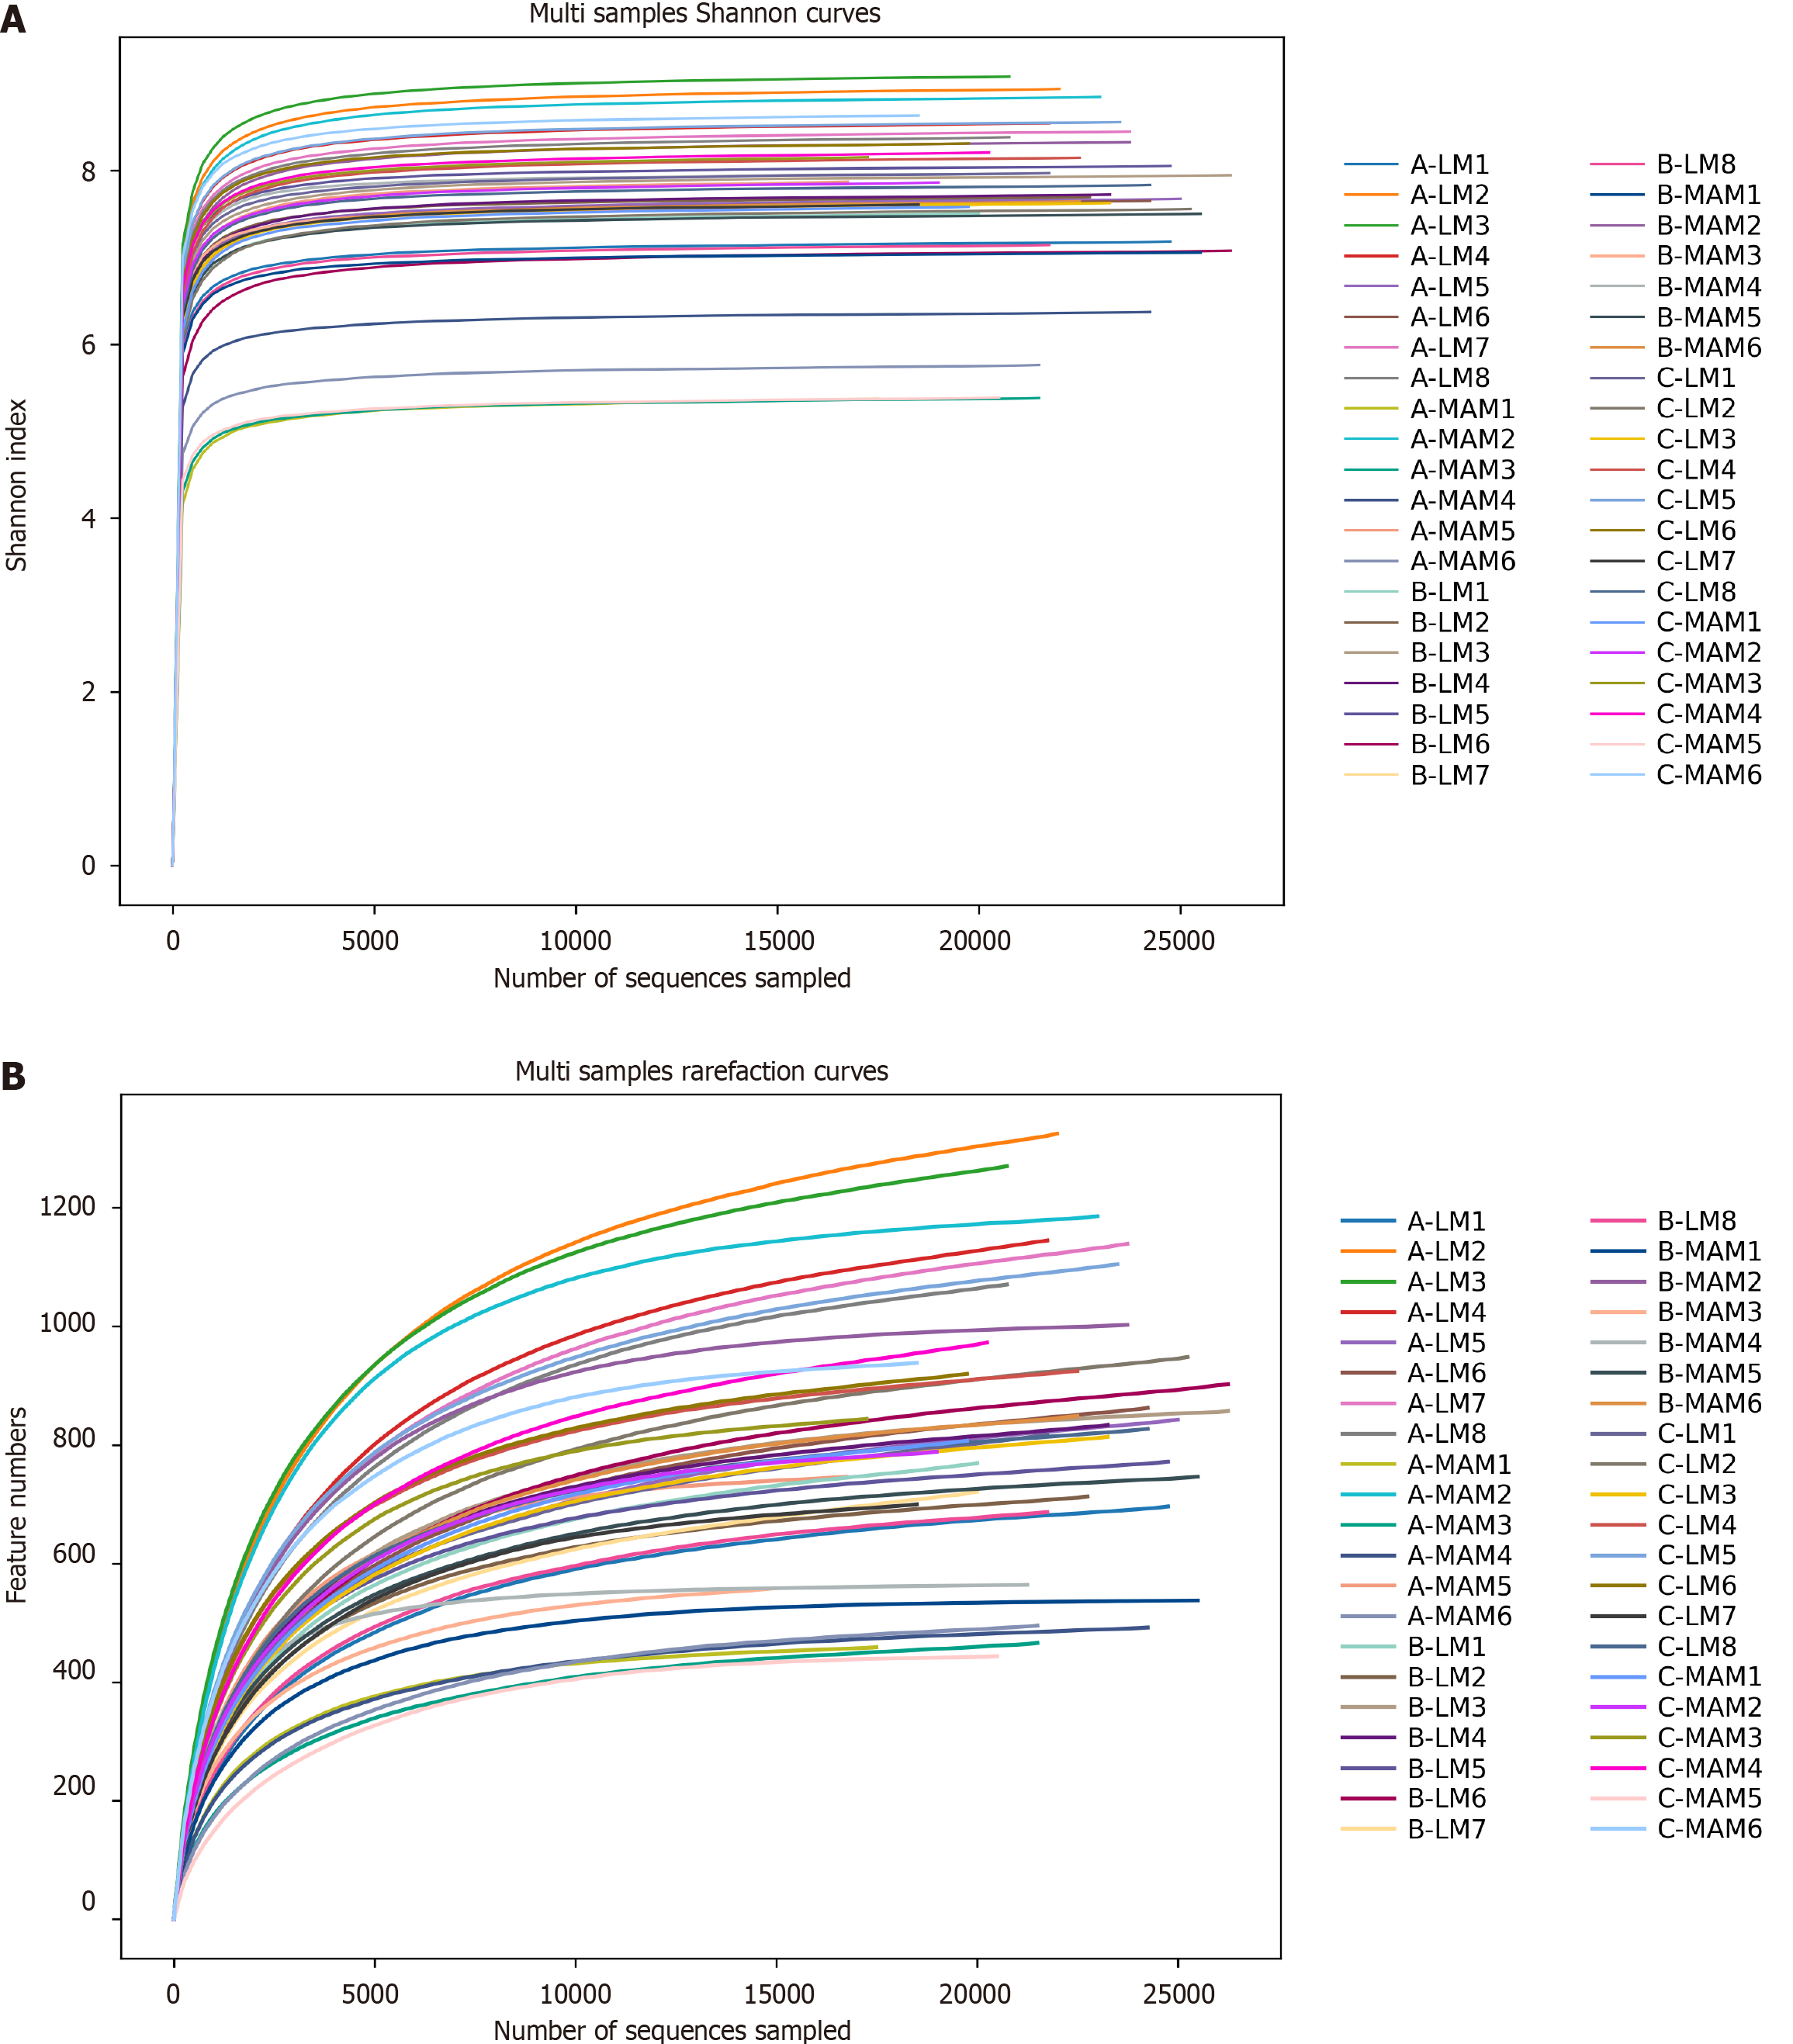
Figure 4 Shannon curve and rarefaction curve.
A: Multi samples Shannon curves; B: Multi samples Rarefaction curves. LM: Luminal microbiata stands for rat fecal stool flora; MAM: Mucosa-associated microbiota stands for colon mucosal flora; A, B, and C stand for control group, tail-hanging group, and tail-hanging to probiotics group, respectively.
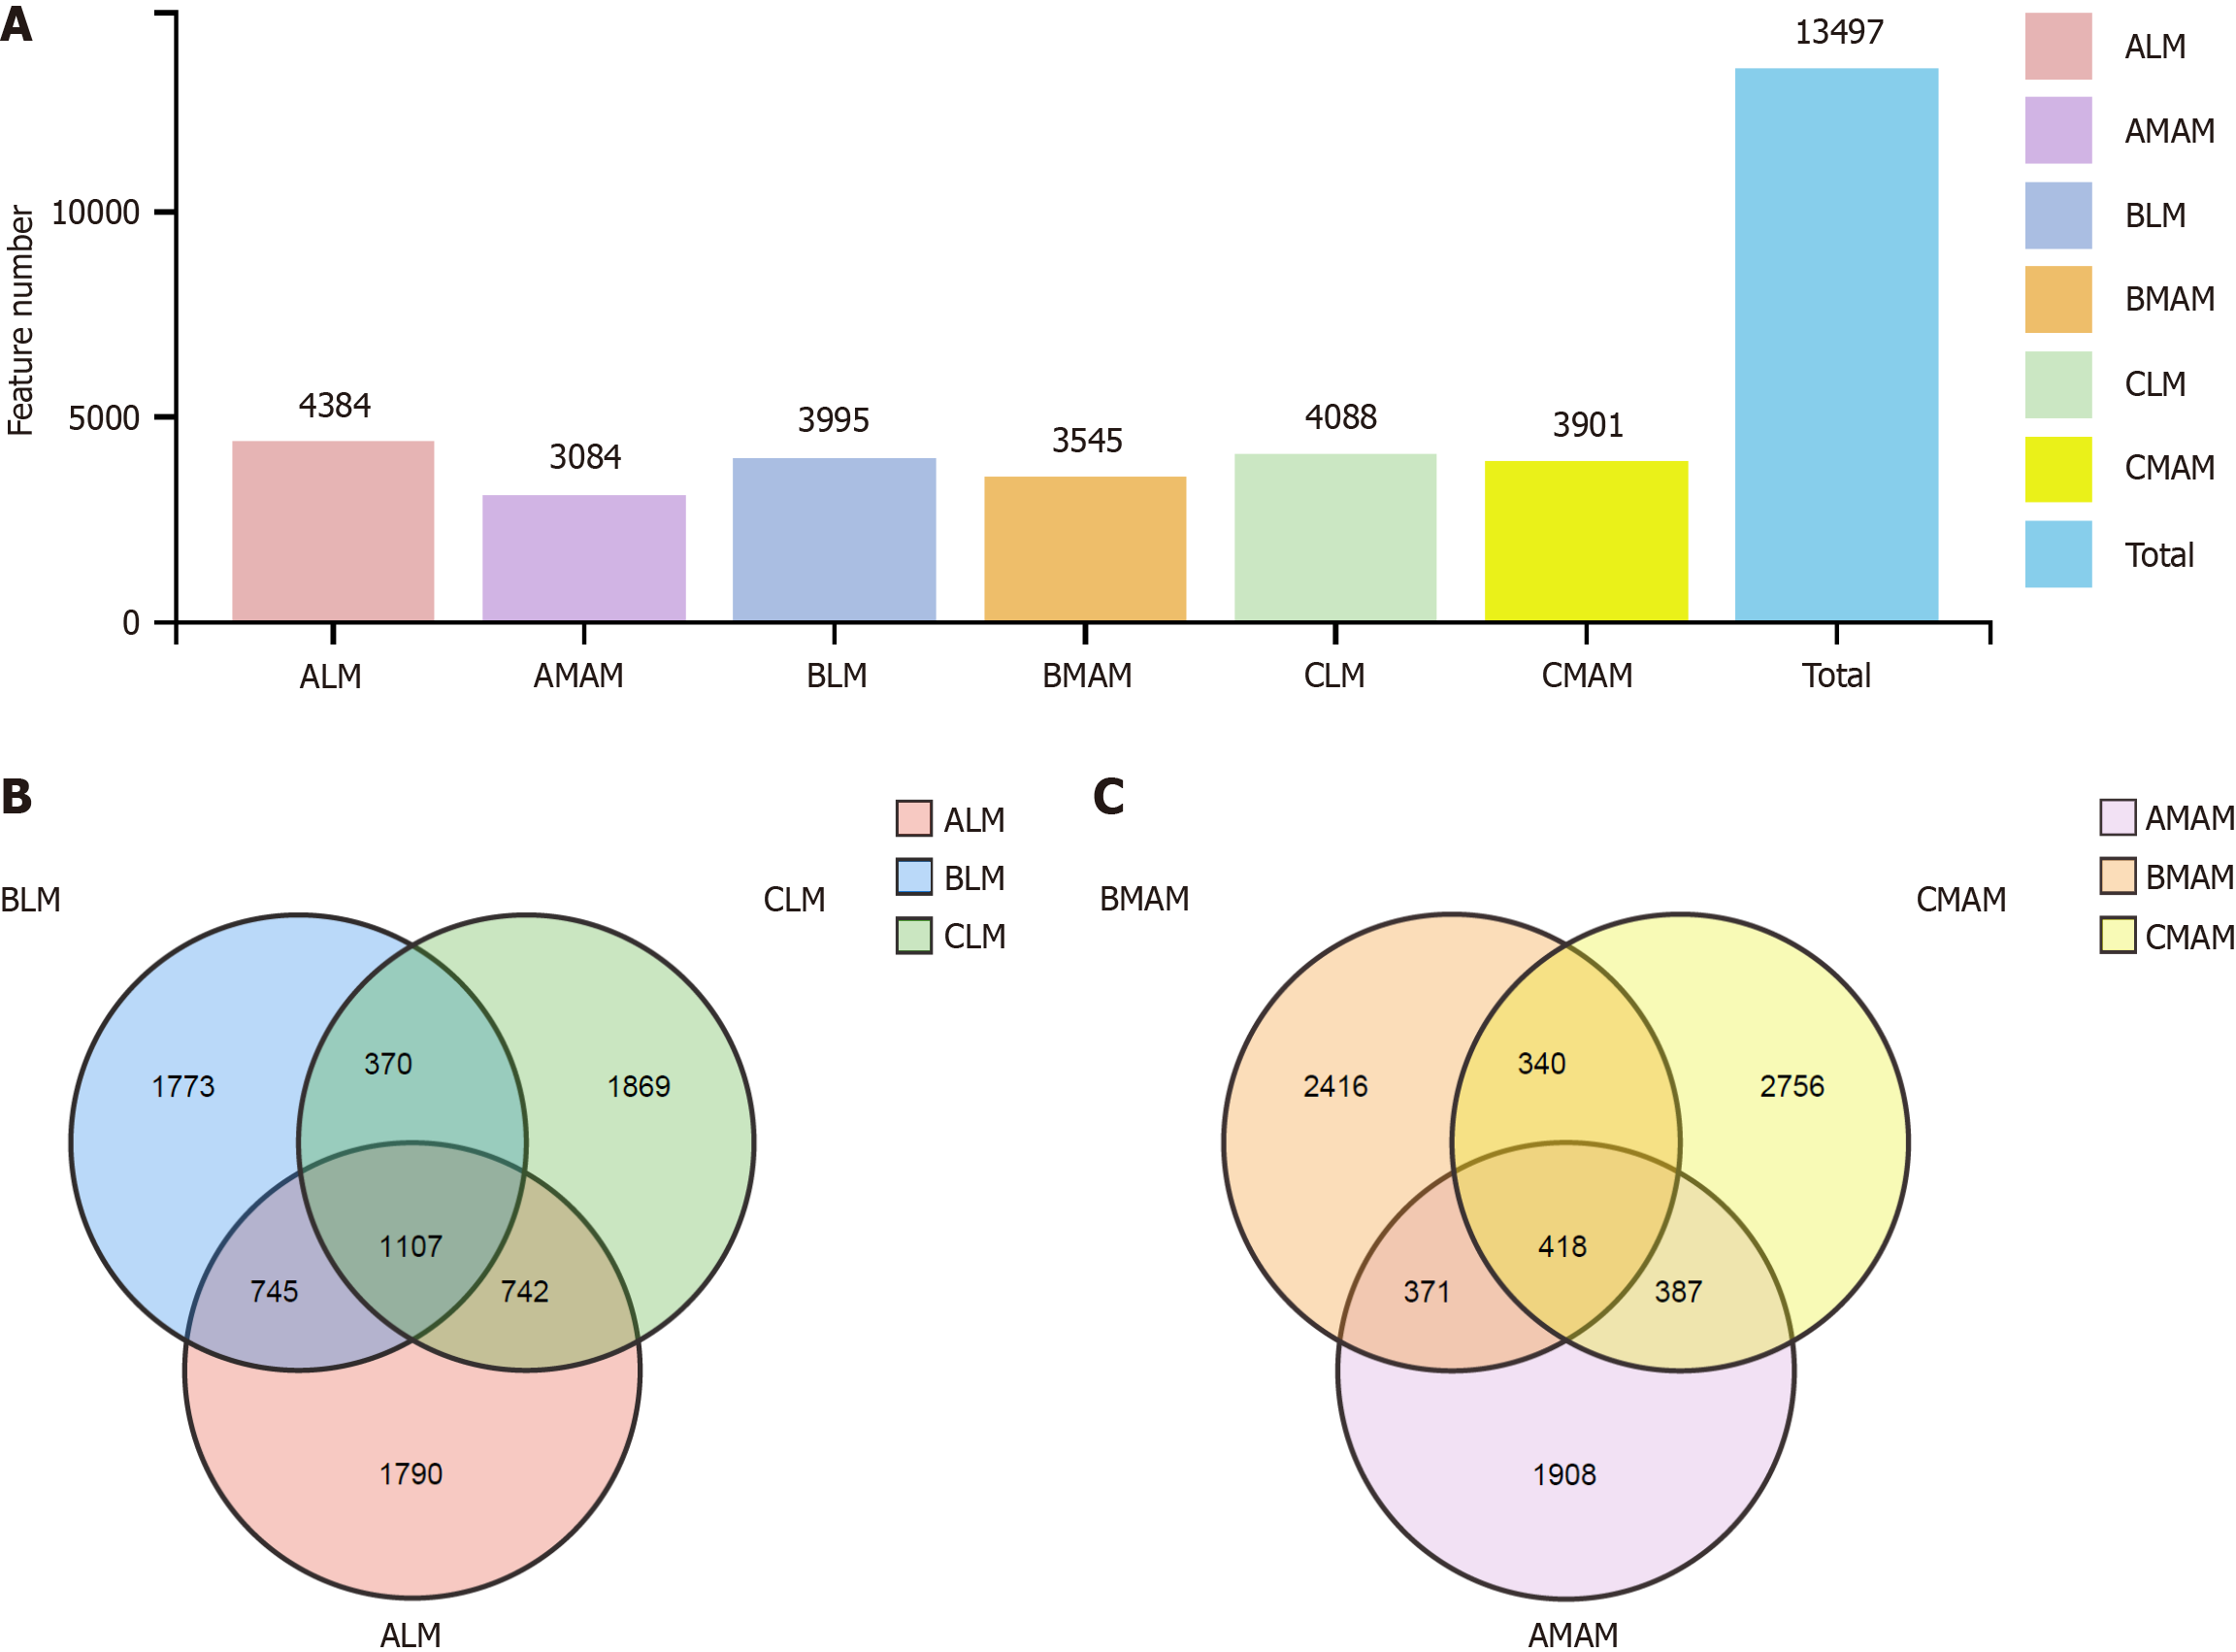
Figure 5 Bar chart and Venn diagram of operational taxonomic units.
A: Bar chart of the number of operational taxonomic units (OTUs) in the 6 groups; B: OTU Venn diagram of fecal flora of three groups; C: OTU Venn diagram of colon mucosal flora between the three groups. LM: Luminal microbiata stands for rat fecal stool flora; MAM: Mucosa-associated microbiota stands for colon mucosal flora; A, B, and C stand for control group, tail-hanging group, and tail-hanging to probiotics group, respectively.
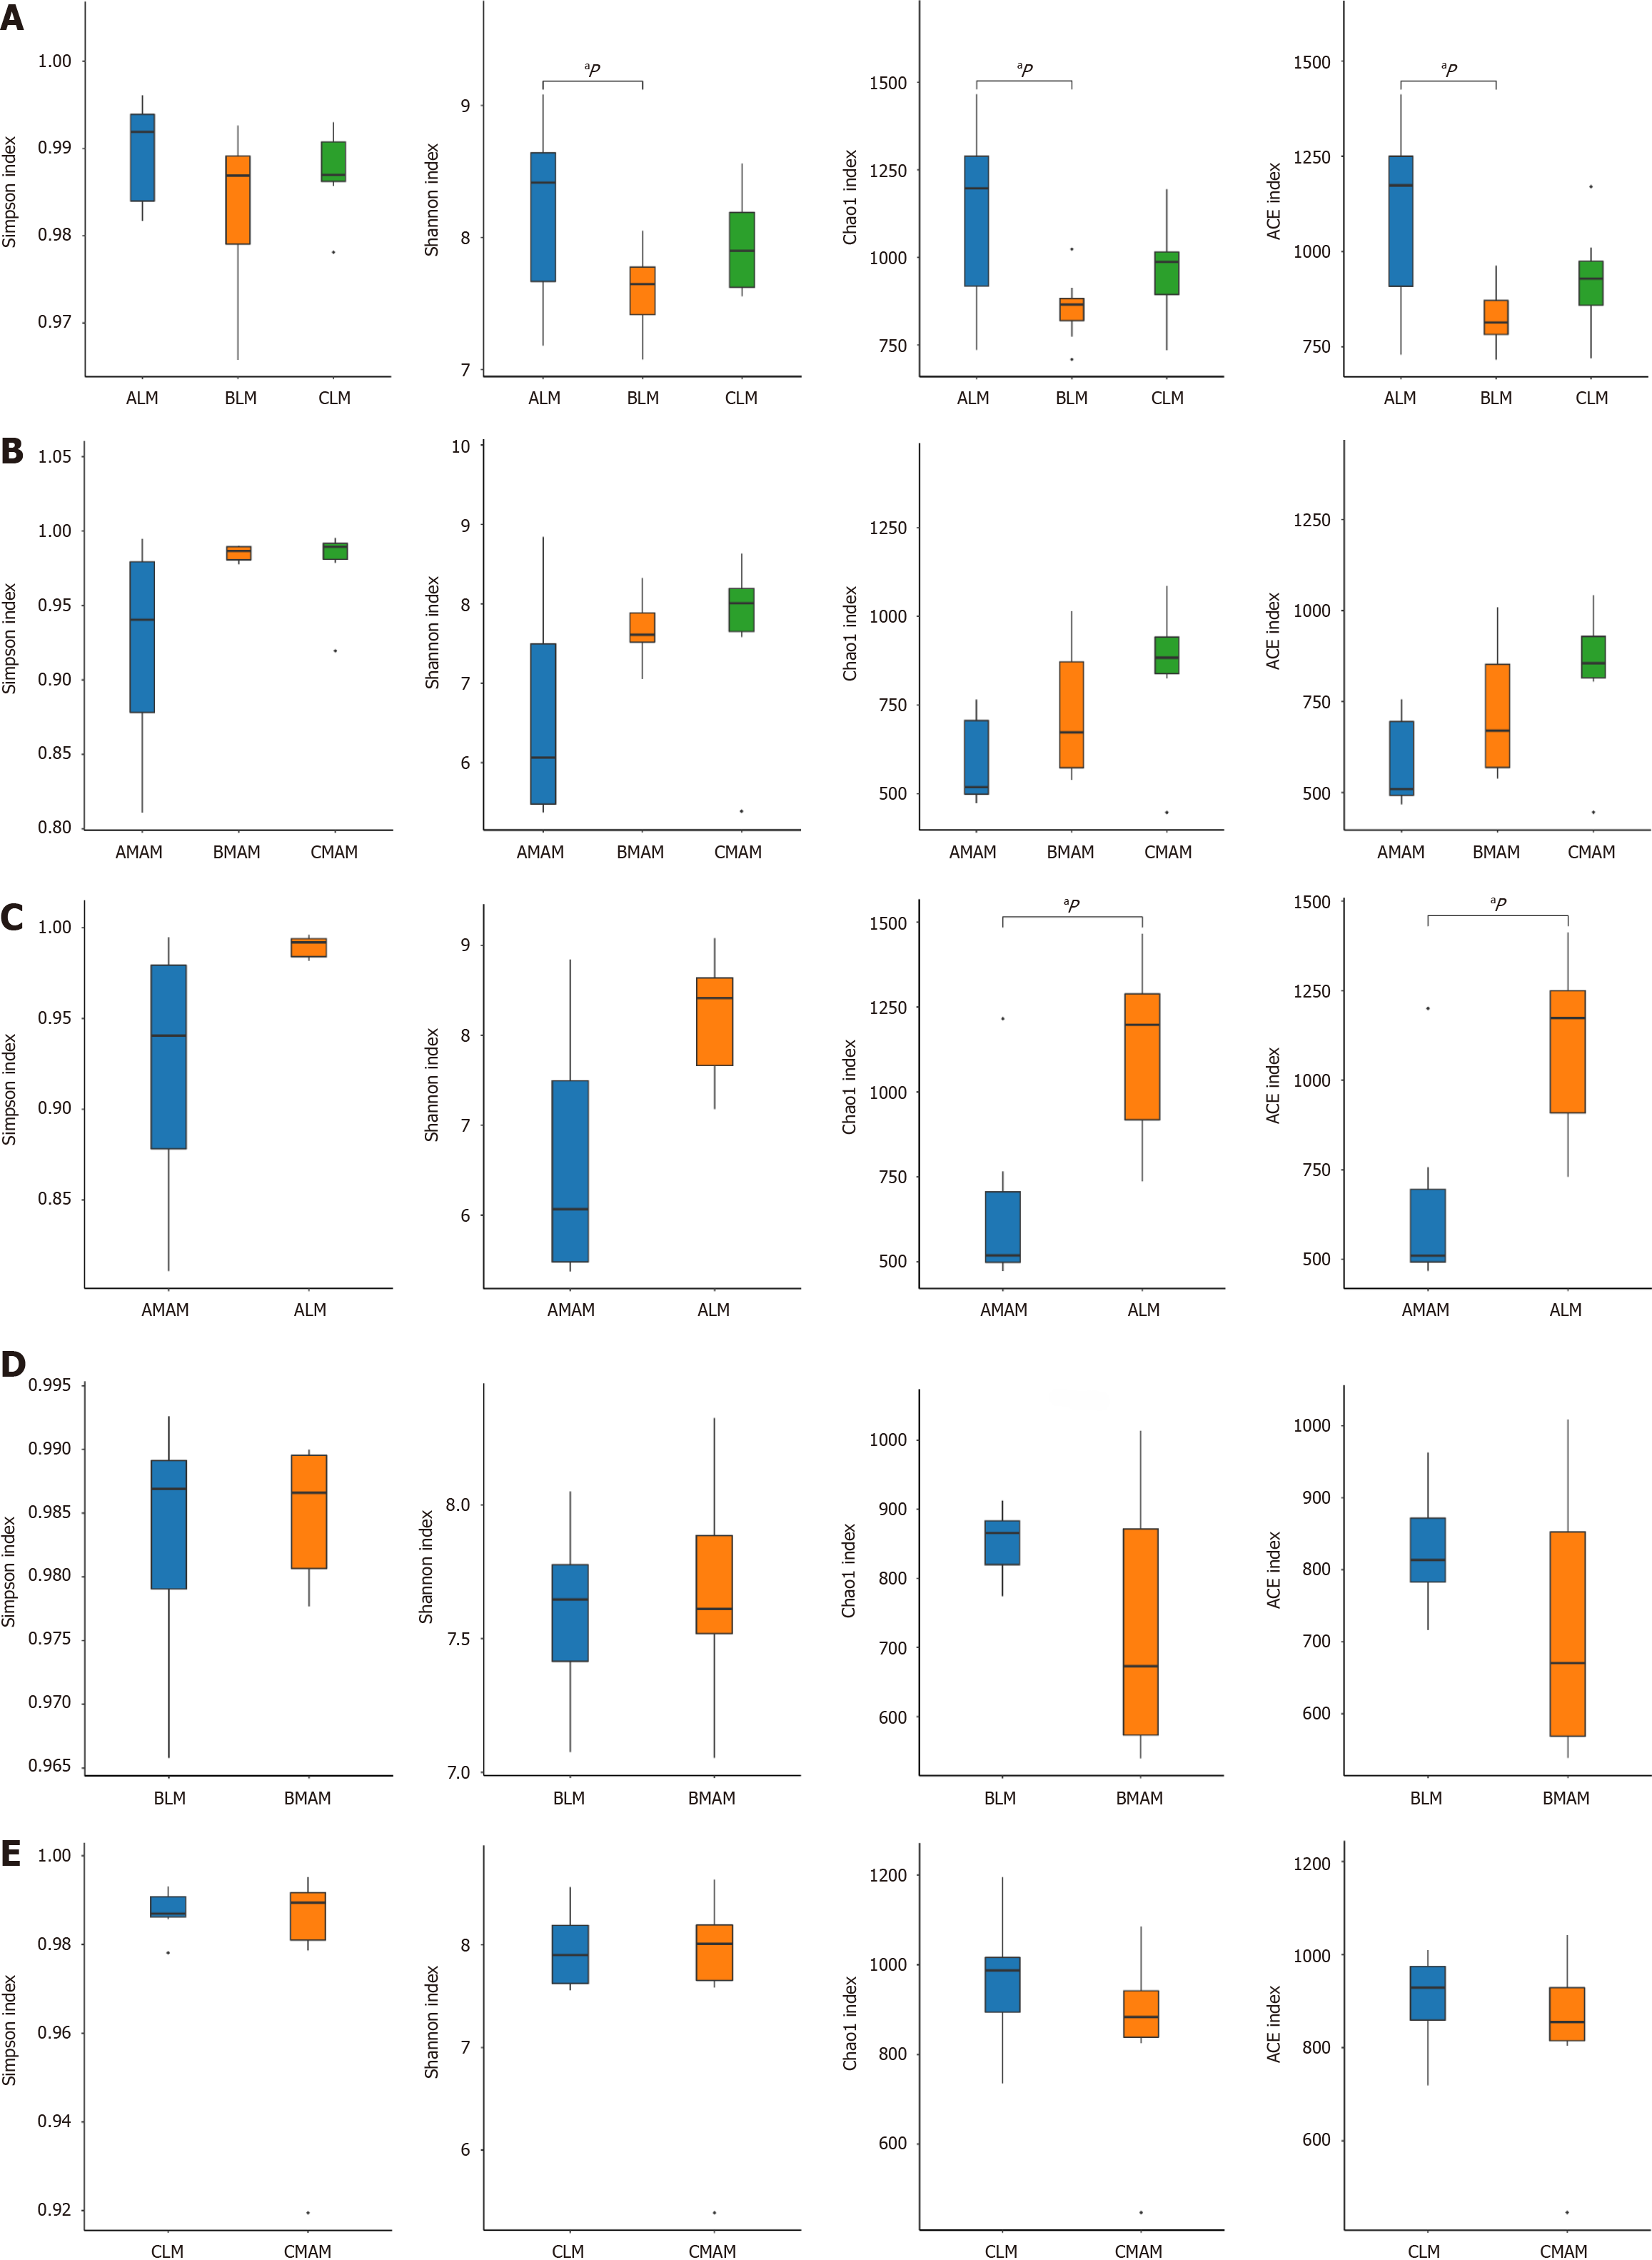
Figure 6 Alpha diversity analysis.
A: Α diversity analysis of fecal flora among three groups; B: Α diversity analysis of mucosal flora among the three groups; C: Α diversity analysis of fecal and mucosal flora in control group; D: Α diversity analysis of fecal and mucosal flora in hanging tail group; E: Α diversity analysis of fecal and mucosal flora in tailing administration group. aP < 0.05; bP < 0.01; LM: Luminal microbiata stands for rat fecal stool flora; MAM: Mucosa-associated microbiota stands for colon mucosal flora; A, B, and C stand for control group, tail-hanging group, and tail-hanging to probiotics group, respectively.
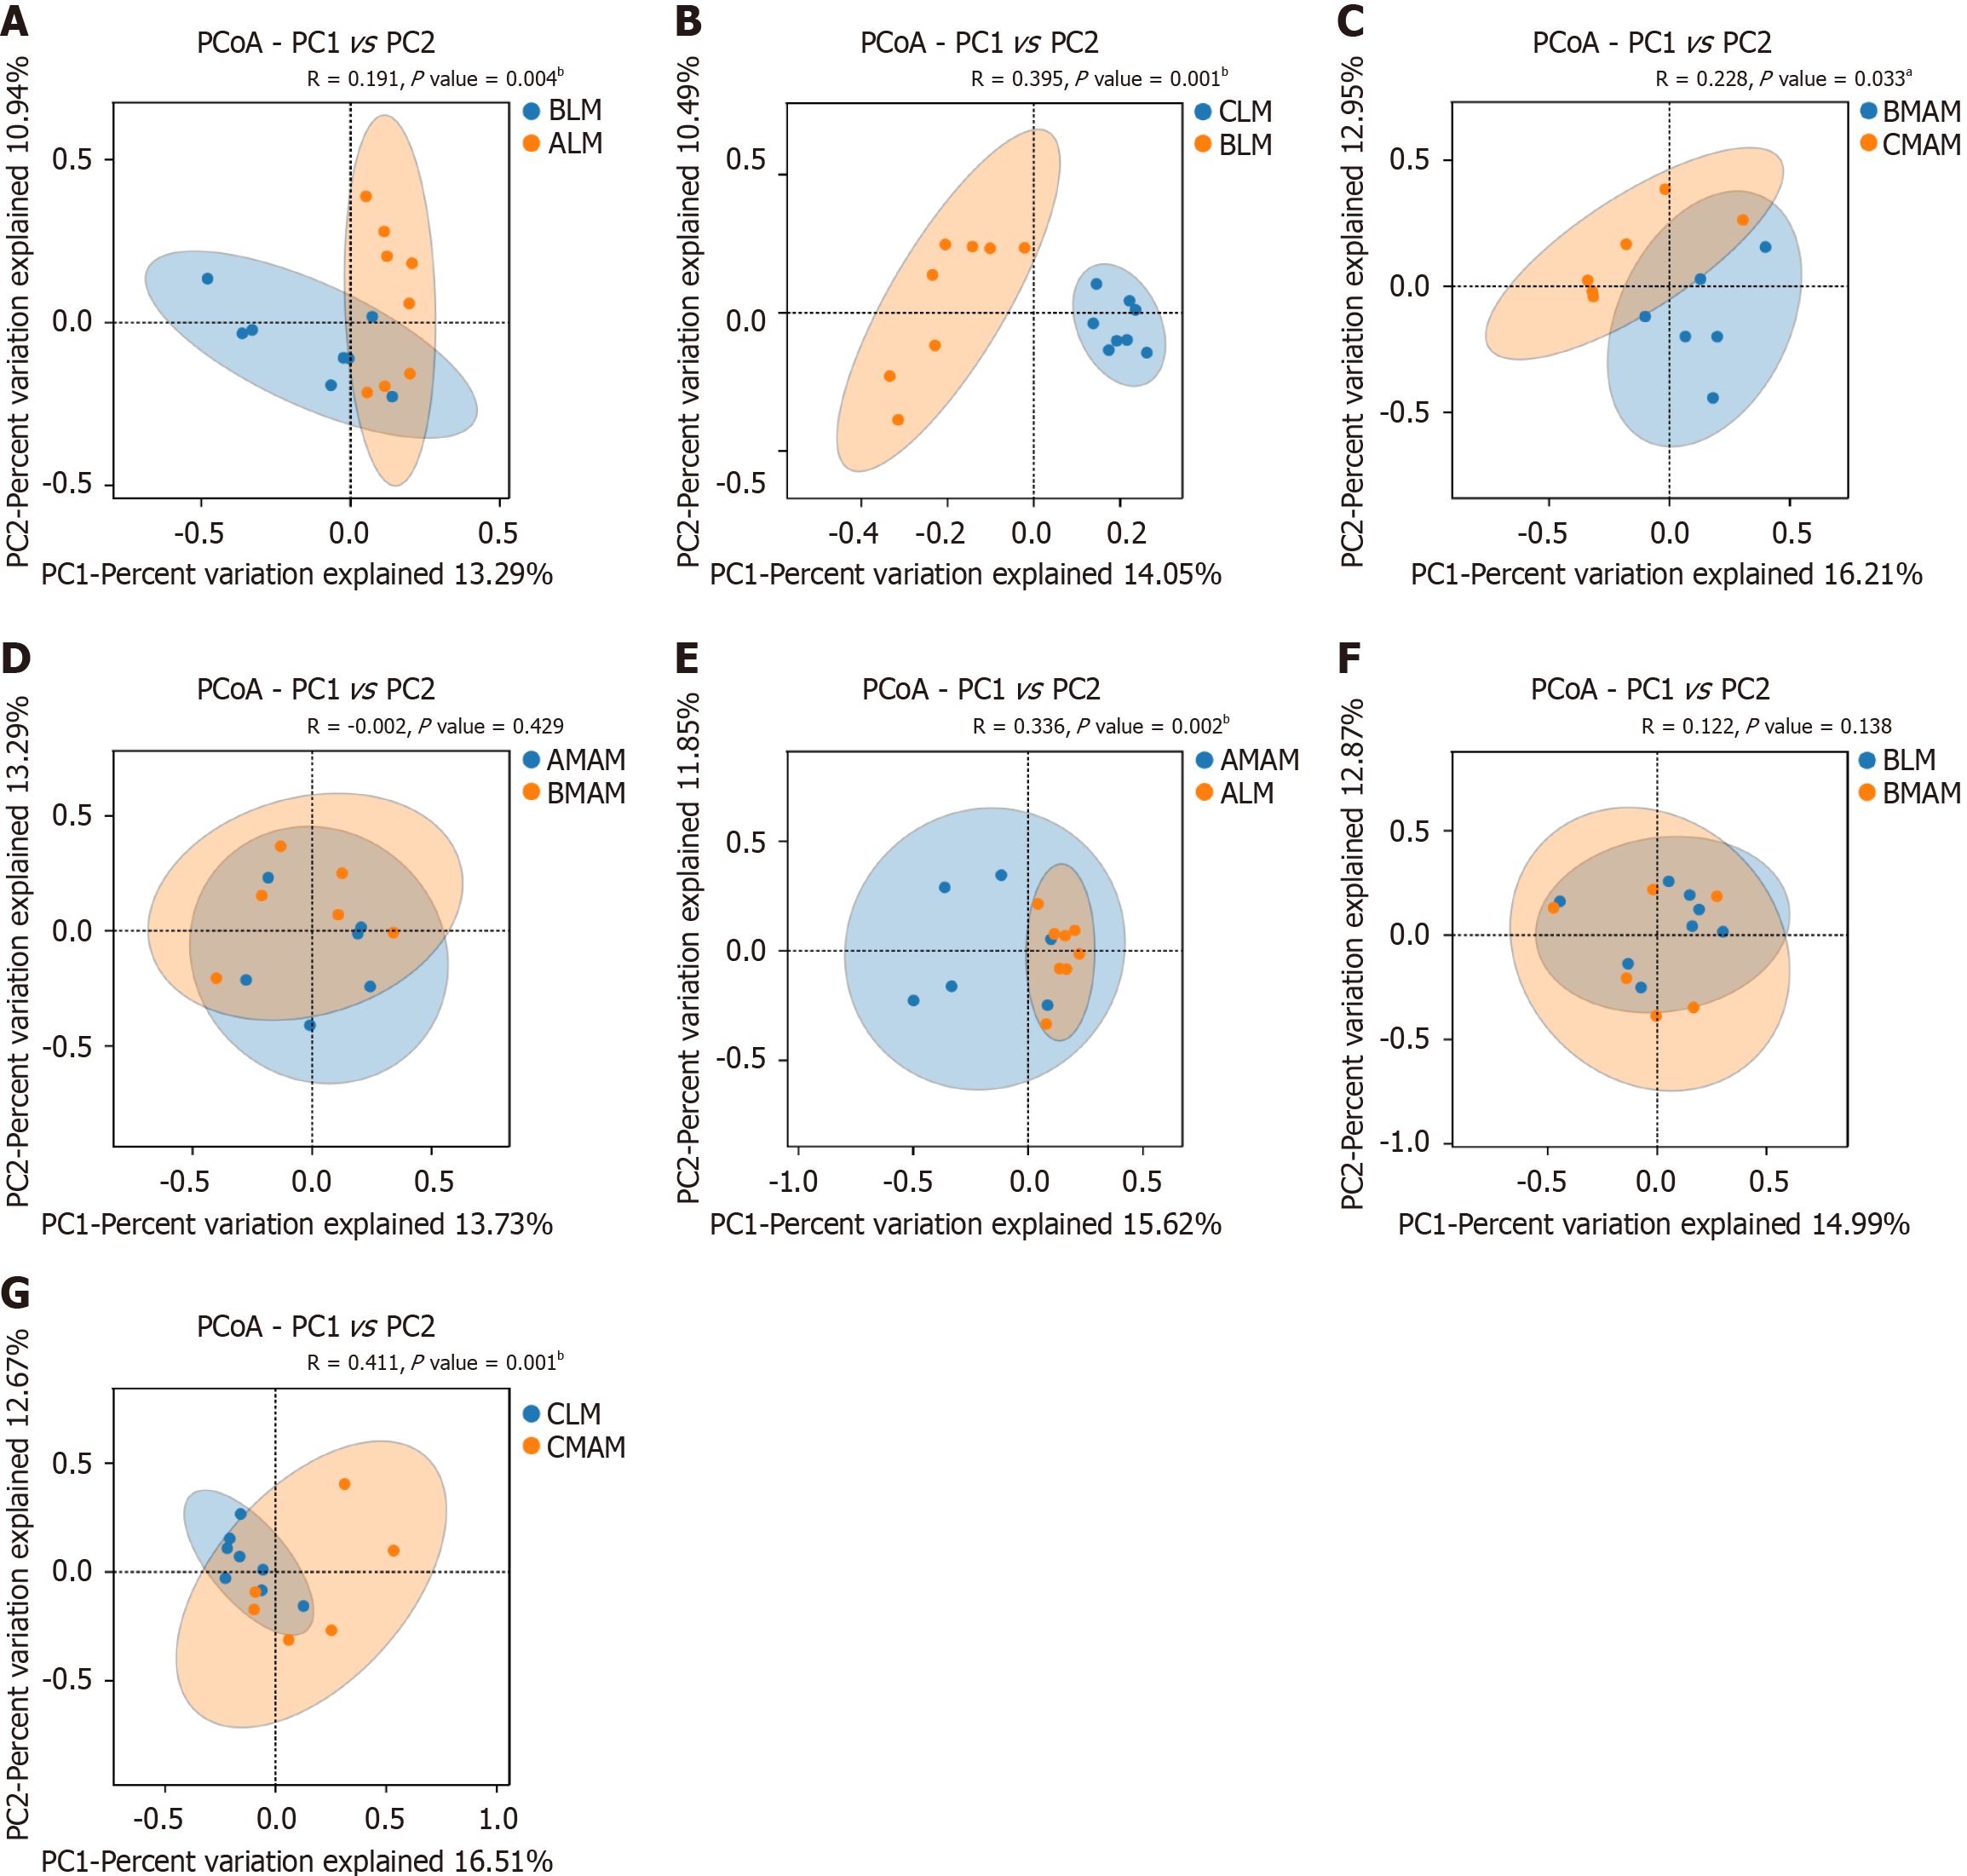
Figure 7 Beta diversity analysis.
A: Α diversity analysis of fecal flora between the control group and the tail-hanging group; B: Α diversity analysis of fecal flora between the tail-hanging group and the probiotic tail-hanging group; C: Α diversity analysis of mucosal flora between the tail-hanging group and the probiotic tail-hanging group; D: Α diversity analysis of mucosal flora between the control group and the tail-hanging group; E: Α diversity analysis of fecal and mucosal flora in the control group; F: Α diversity analysis of fecal and mucosal flora in the tail-hanging group; G: Α diversity analysis of fecal and mucosal flora in the probiotic tail-hanging group. aP < 0.05; bP < 0.01; LM: Luminal microbiata stands for rat fecal stool flora; MAM: Mucosa-associated microbiota stands for colon mucosal flora; A, B, and C stand for the control group, the tail-hanging group, and the probiotic tail-hanging group, respectively.
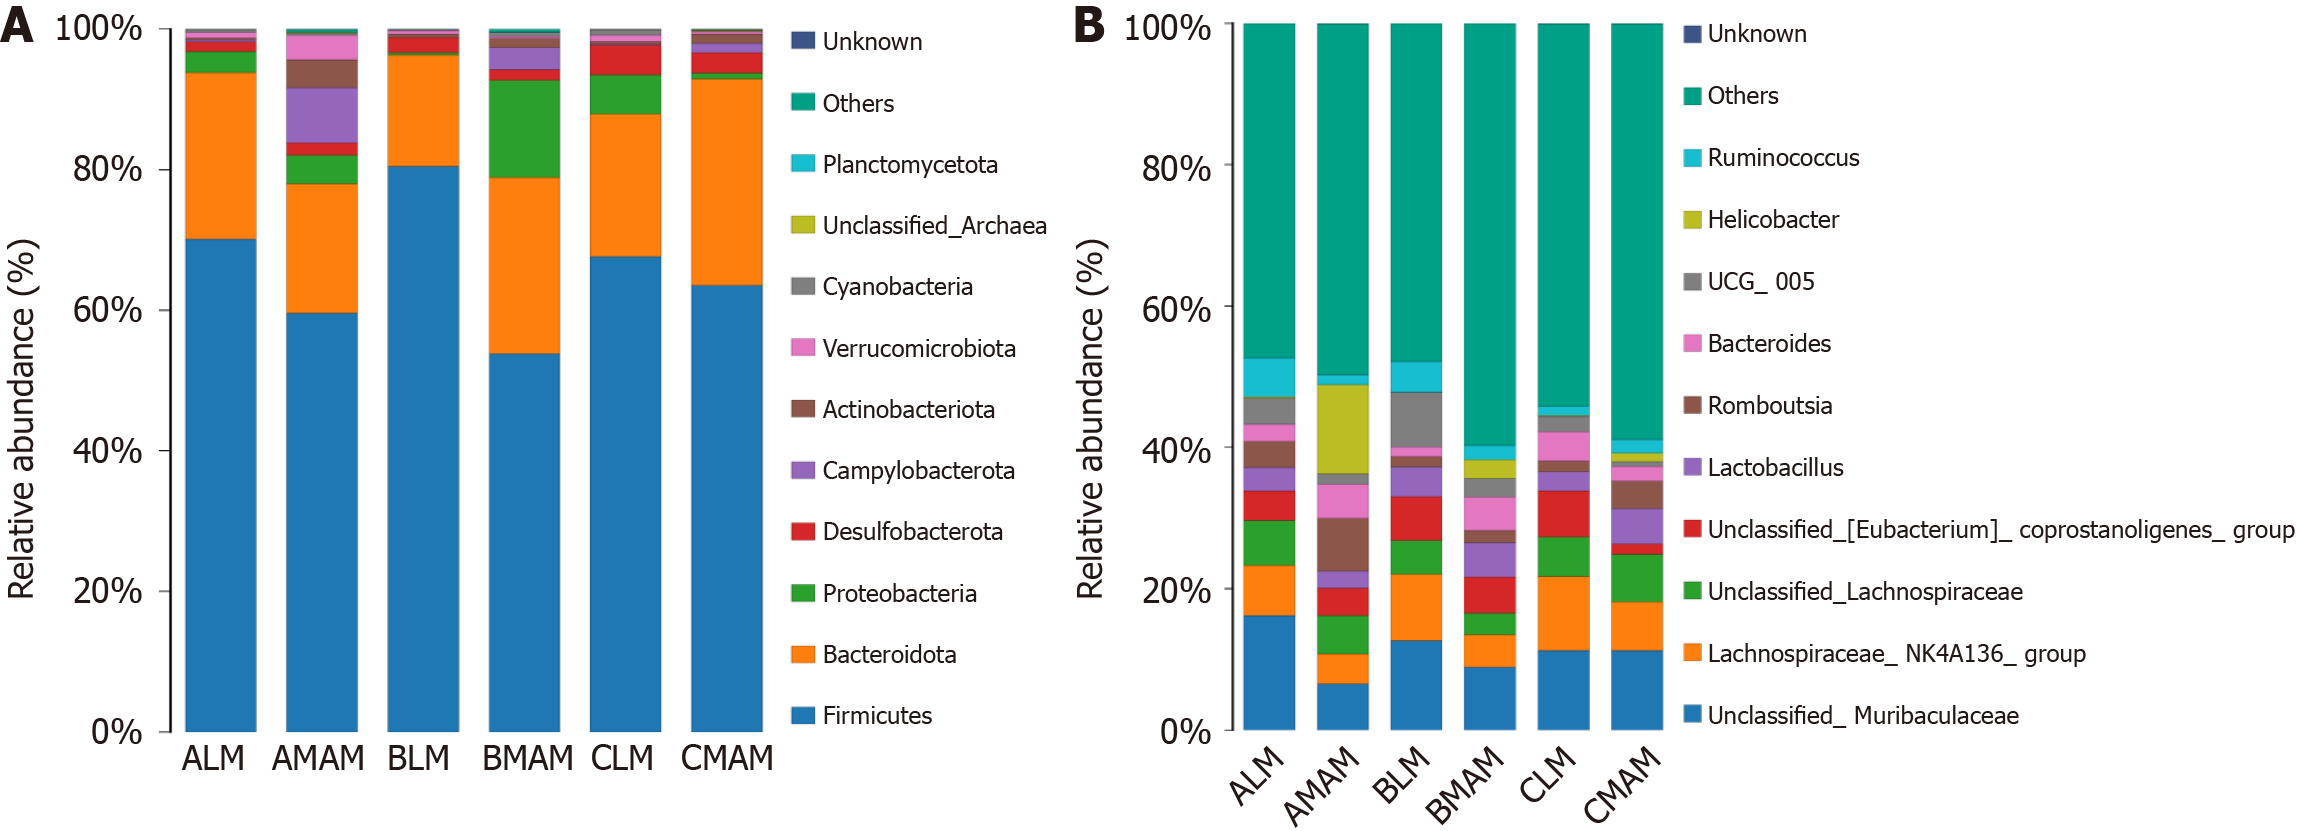
Figure 8 Map of relative species abundance at phylum and genus level (top10).
A: Phylum level relative species abundance map; B: Genus level relative species abundance map. LM: Luminal microbiata stands for rat fecal stool flora; MAM: Mucosa-associated microbiota stands for colon mucosal flora; A, B, and C stand for control group, tail-hanging group, and tail-hanging to probiotics group, respectively.
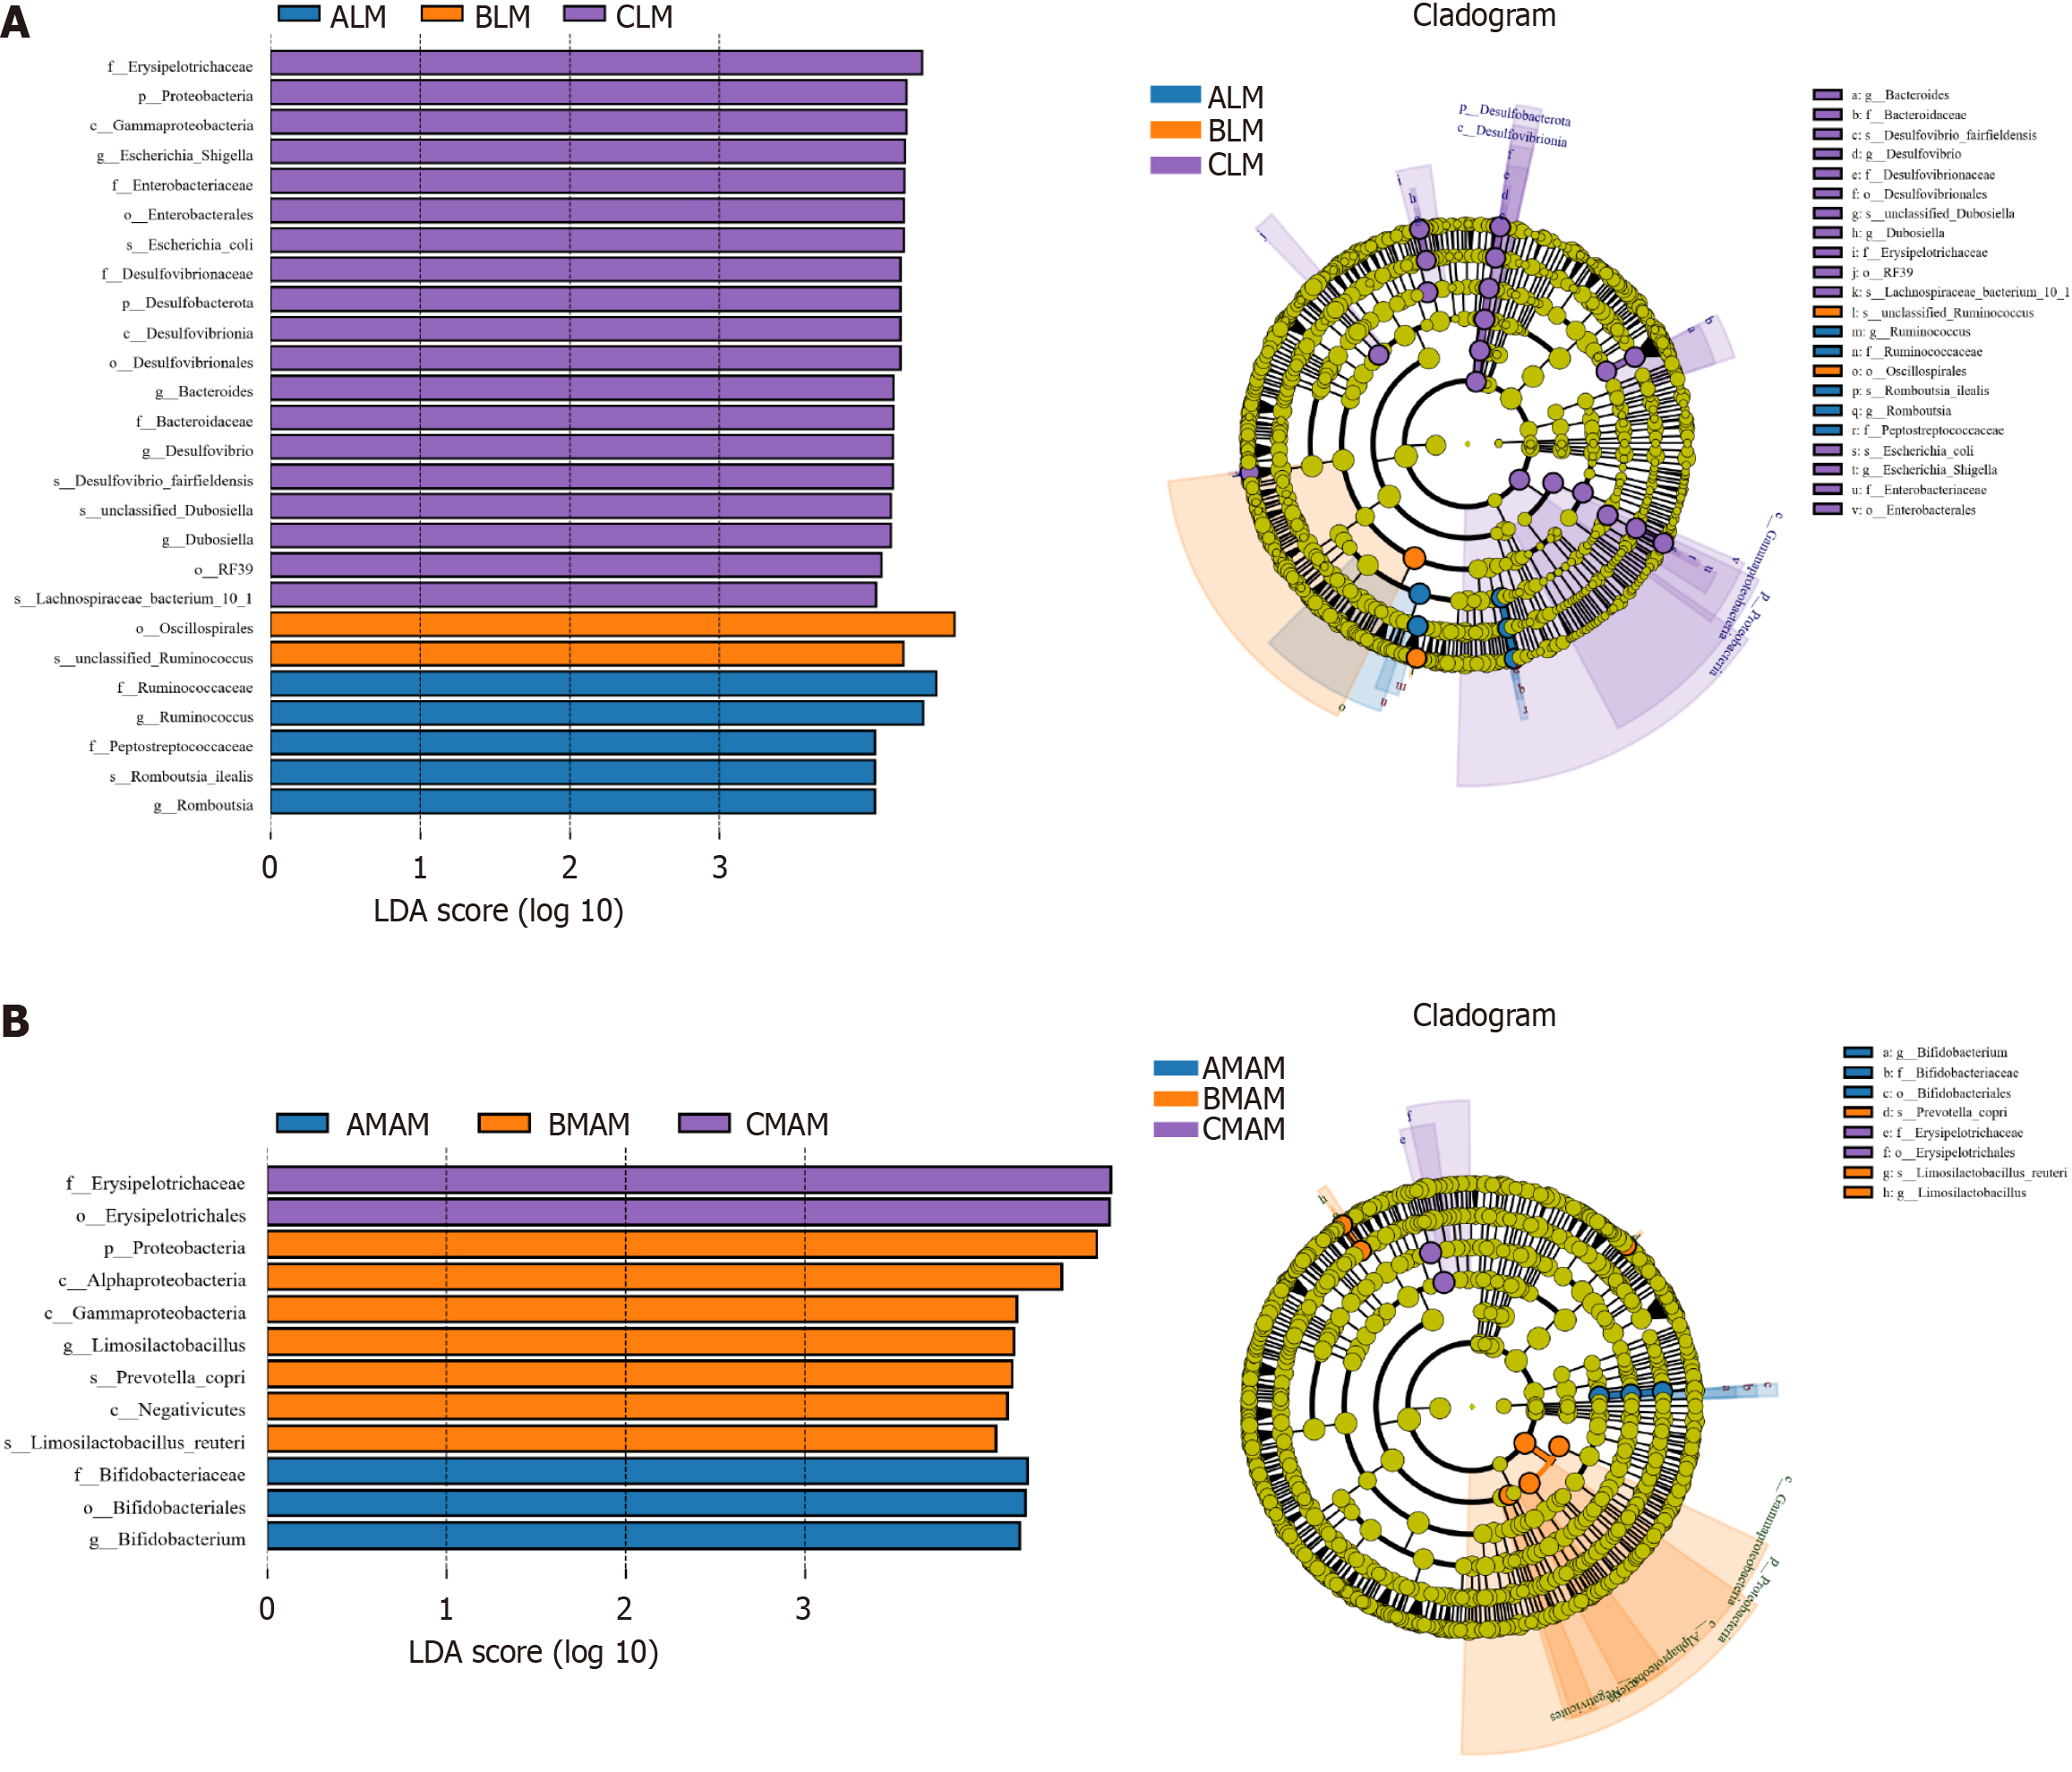
Figure 9 LDA distribution map (LDA > 4) and evolutionary branching map.
A: LDA distribution map (LDA > 4) and evolutionary branching map of intestinal luminal microbiota; B: LDA distribution map (LDA > 4) and evolutionary branching map of mucosa-associated microbiota. Blue represents species enriched in the control group (A), orange represents species enriched in the hanging tail group (B), and purple represents species enriched in the probiotic hanging tail group (C). LM: Mucosa-associated microbiota; MAM: Mucosa-associated microbiota; A, B, and C stand for control group, tail-hanging group, and tail-hanging to probiotics group, respectively.
- Citation: Zhang P, Zhu Y, Chen P, Zhou T, Han ZY, Xiao J, Ma JF, Ma W, Zang P, Chen Y. Effects of Bifidobacterium lactis BLa80 on fecal and mucosal flora and stem cell factor/c-kit signaling pathway in simulated microgravity rats. World J Gastroenterol 2025; 31(1): 96199
- URL: https://www.wjgnet.com/1007-9327/full/v31/i1/96199.htm
- DOI: https://dx.doi.org/10.3748/wjg.v31.i1.96199


