Copyright
©The Author(s) 2024.
World J Gastroenterol. Nov 28, 2024; 30(44): 4697-4708
Published online Nov 28, 2024. doi: 10.3748/wjg.v30.i44.4697
Published online Nov 28, 2024. doi: 10.3748/wjg.v30.i44.4697
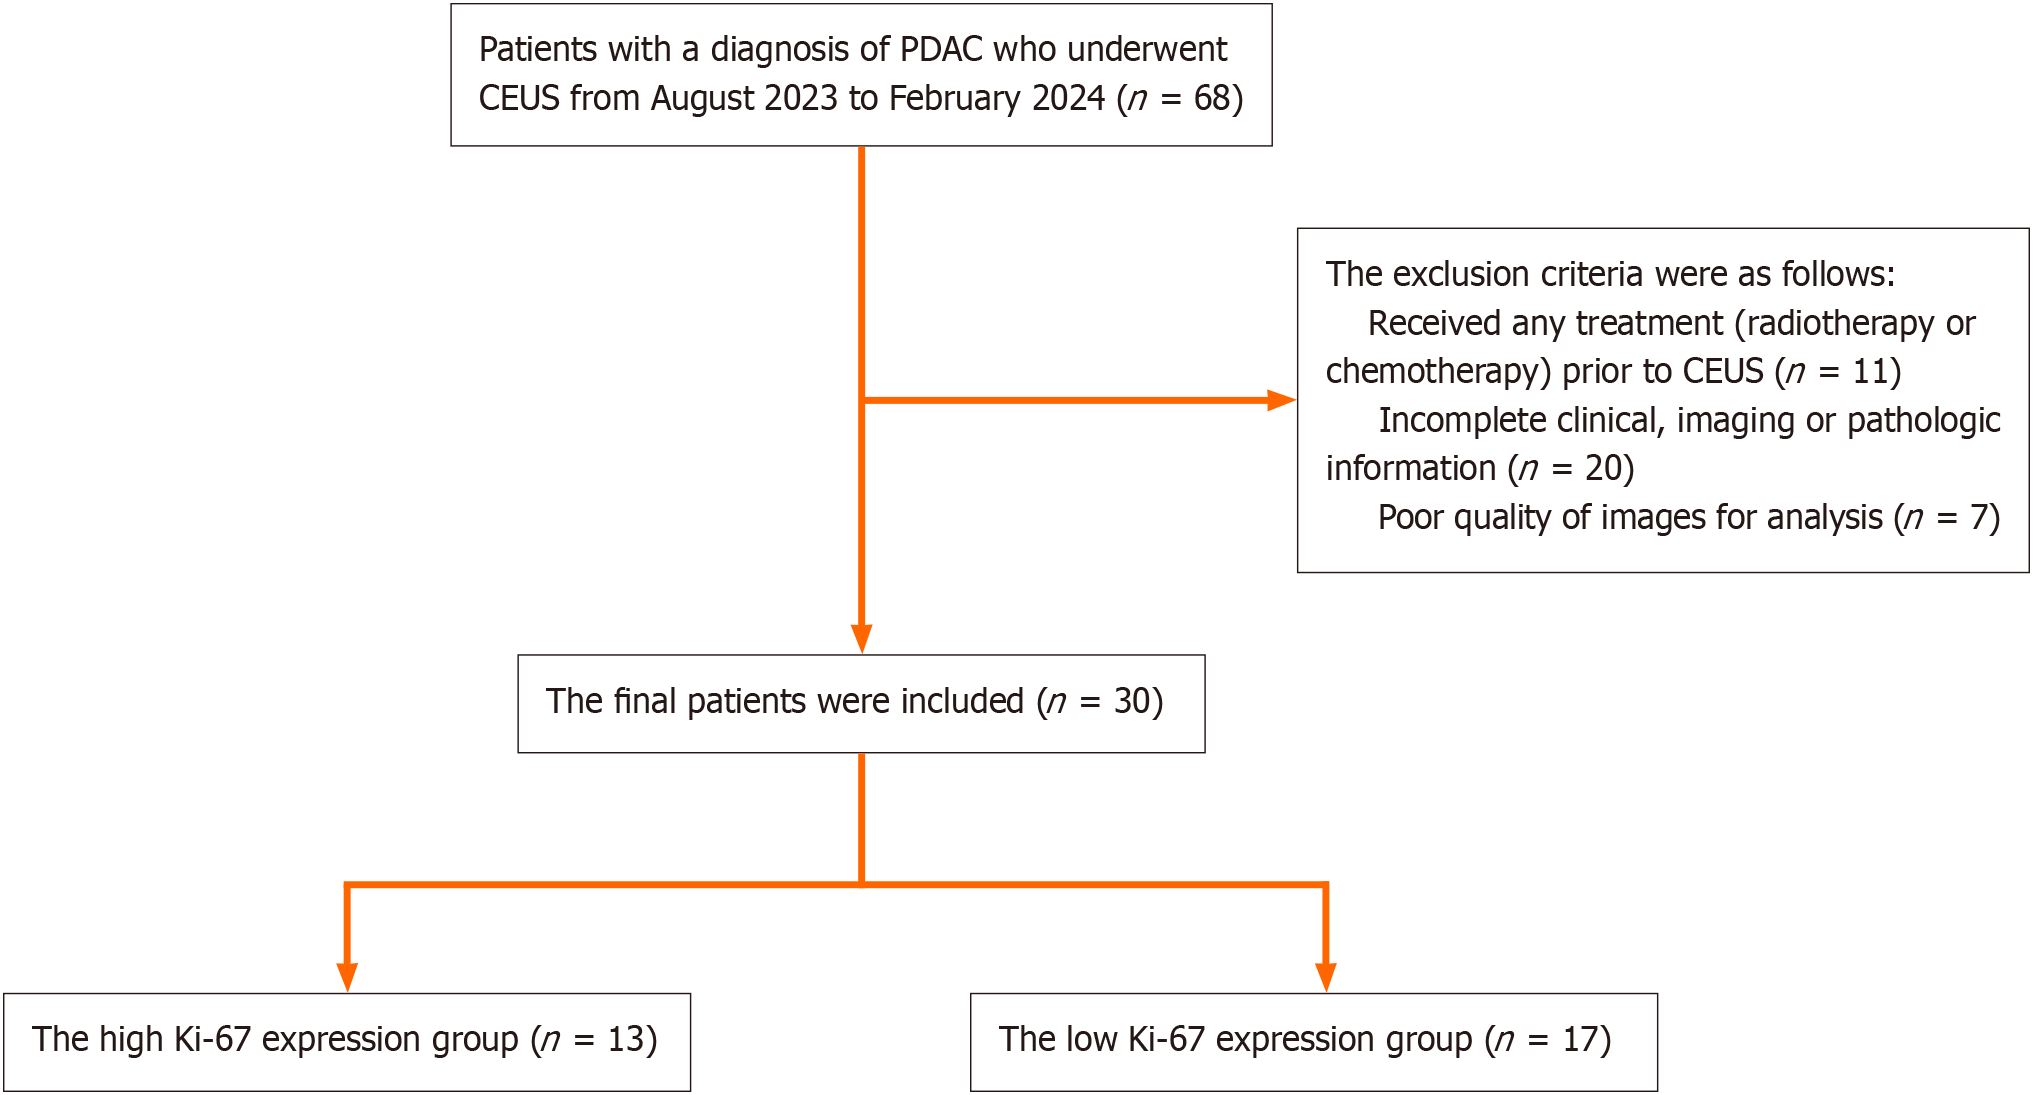
Figure 1 Flowchart of the study population.
PDAC: Pancreatic ductal adenocarcinoma; CEUS: Contrast-enhanced ultrasonography.
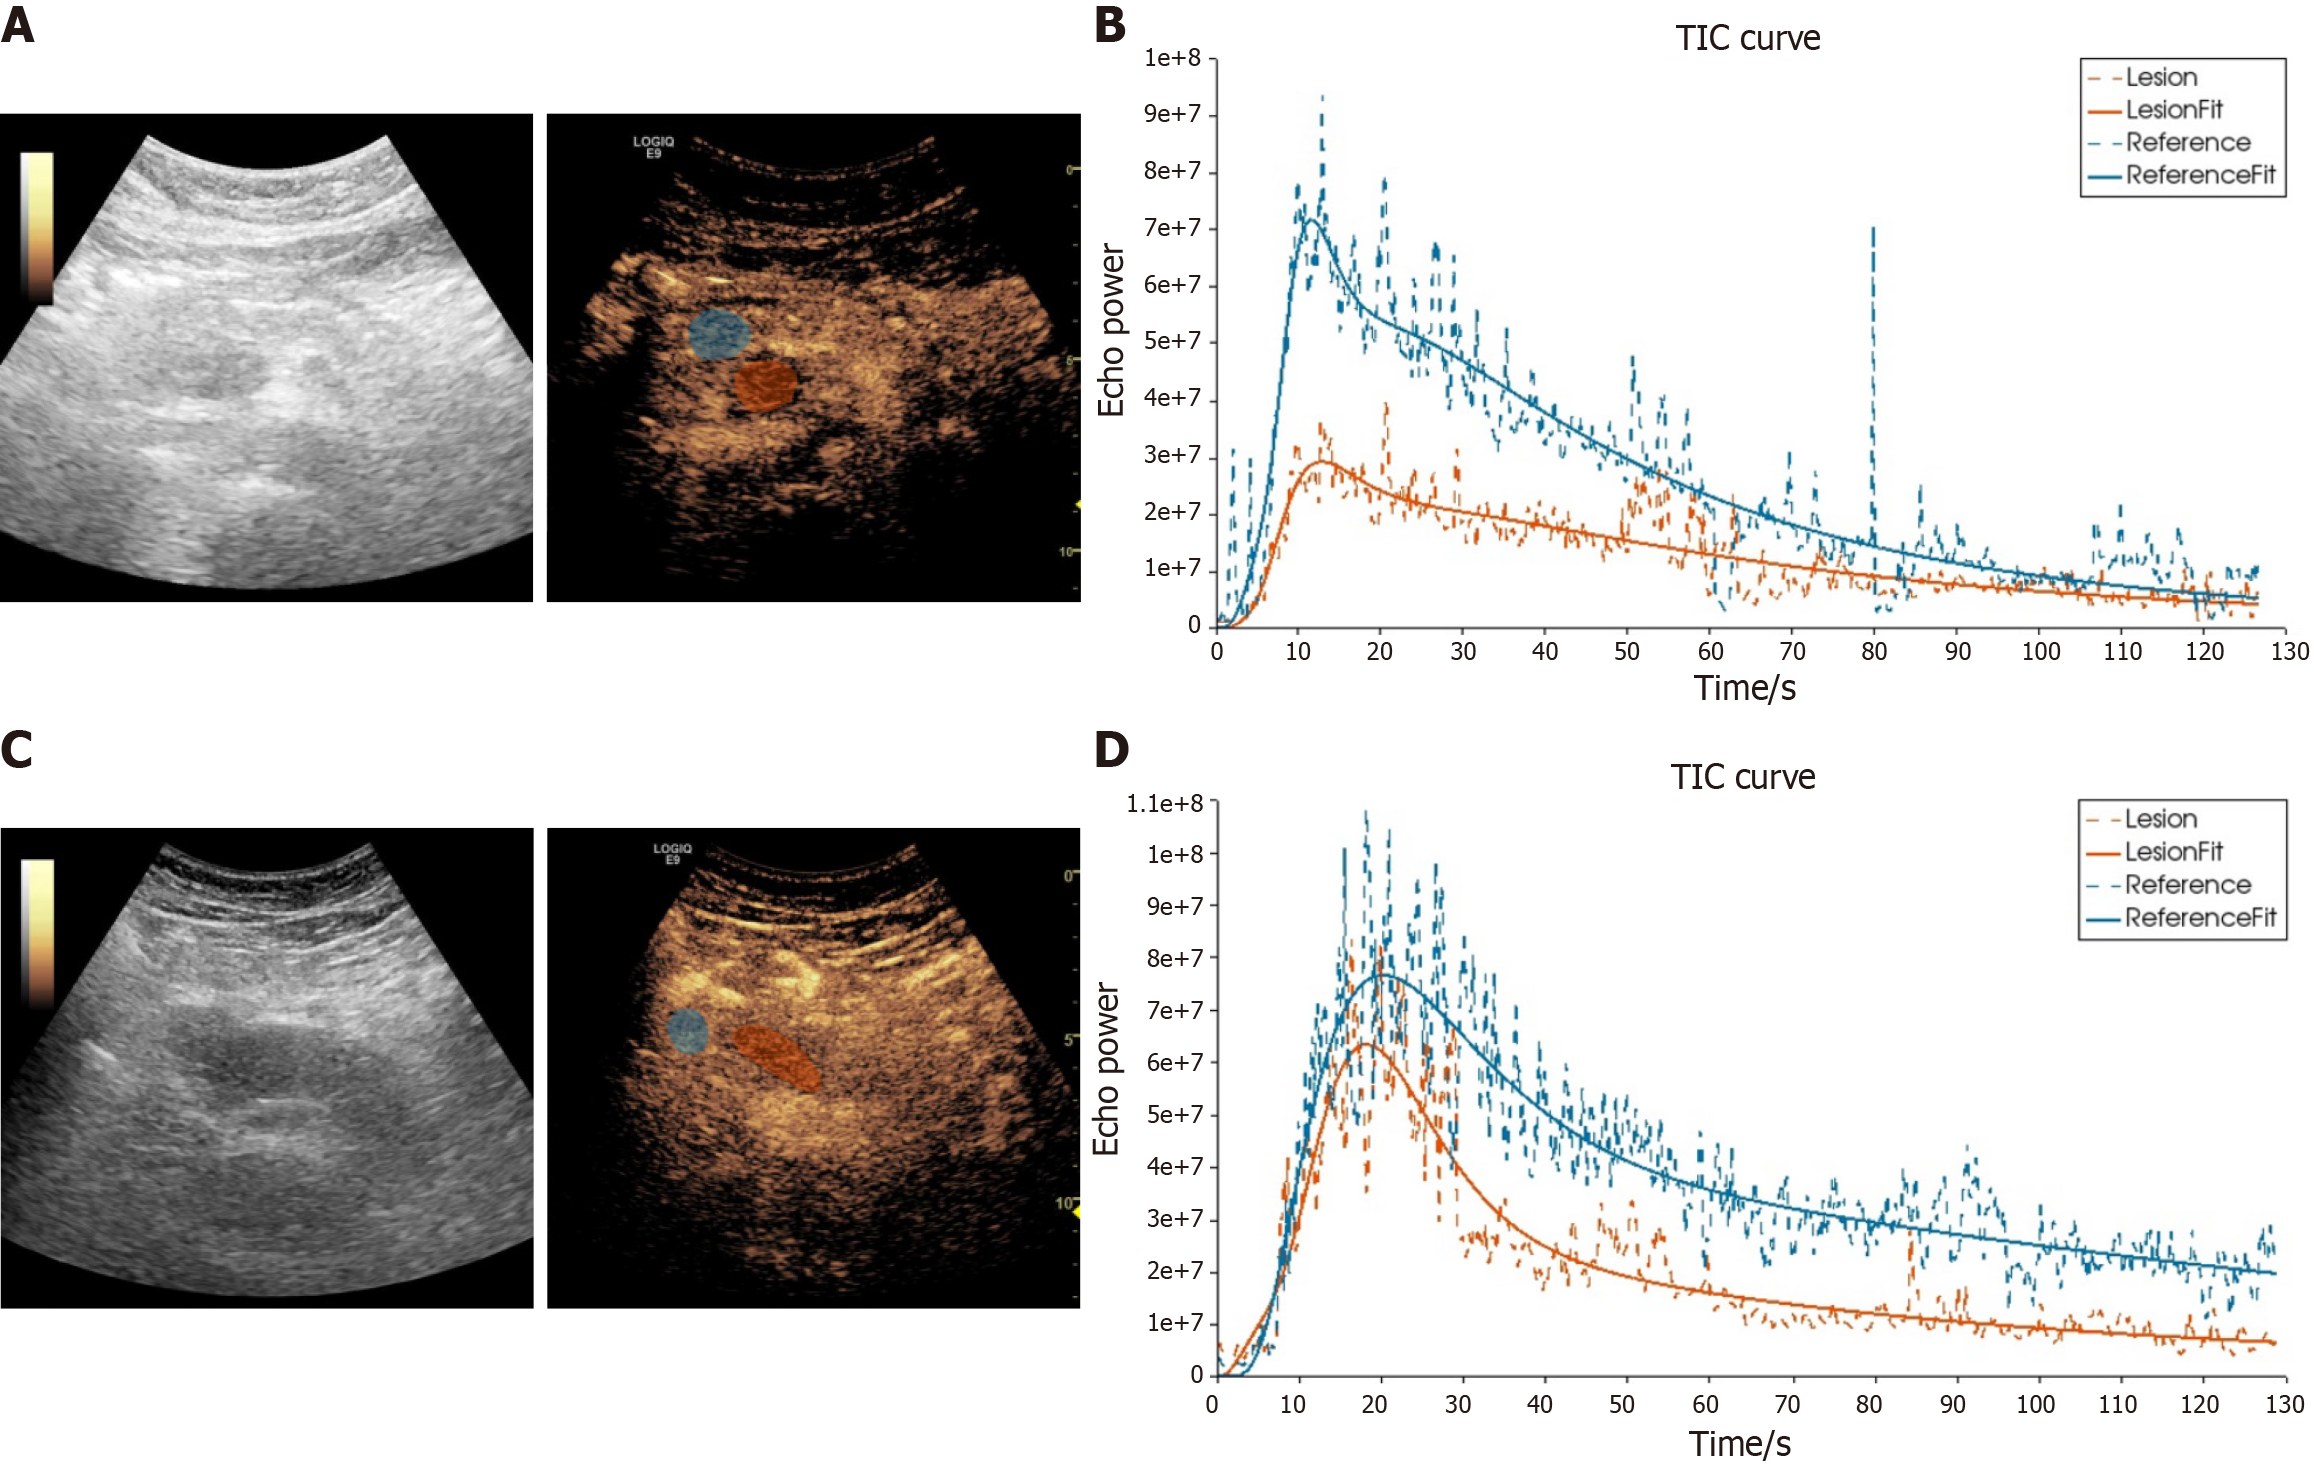
Figure 2 Dynamic contrast-enhanced ultrasonography perfusion analysis on patients with pancreatic ductal adenocarcinoma confirmed by histopathology.
Regions of interest of the pancreatic ductal adenocarcinoma lesion (orange circle) and surrounding pancreatic parenchyma (blue circle) were placed manually and the time-intensity curves were obtained. A and B: A 52-year-old female with a pancreatic ductal adenocarcinoma lesion (the Ki-67 labelling index of 60%); C and D: A 67-year-old male with a pancreatic ductal adenocarcinoma lesion (the Ki-67 labelling index of 20%). TIC: Time-intensity curve.
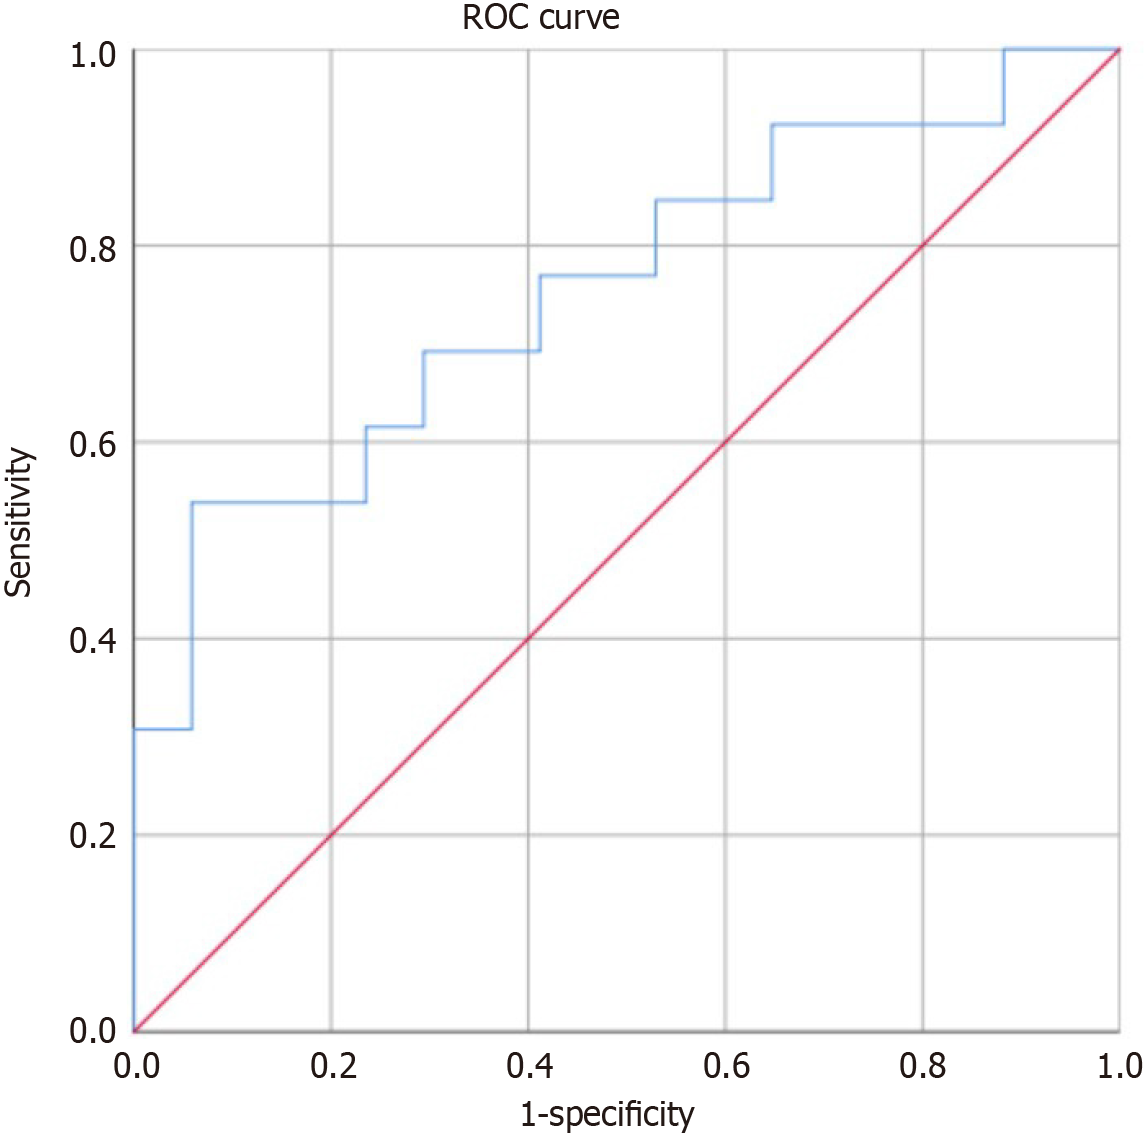
Figure 3 Diagnostic efficacy of relative half-decrease time for differentiating between the high group and low Ki-67 expression groups.
The relative half-decrease time ≥ 1.07 was more helpful in accurately predicting high Ki-67 expression. ROC: Receiver operating characteristic curve.
- Citation: Lin XJ, Zhu S, Wang D, Chen JY, Wei SX, Chen SY, Luo HC. Correlation of dynamic contrast-enhanced ultrasonography and the Ki-67 labelling index in pancreatic ductal adenocarcinoma. World J Gastroenterol 2024; 30(44): 4697-4708
- URL: https://www.wjgnet.com/1007-9327/full/v30/i44/4697.htm
- DOI: https://dx.doi.org/10.3748/wjg.v30.i44.4697


