Copyright
©The Author(s) 2024.
World J Gastroenterol. Nov 7, 2024; 30(41): 4449-4460
Published online Nov 7, 2024. doi: 10.3748/wjg.v30.i41.4449
Published online Nov 7, 2024. doi: 10.3748/wjg.v30.i41.4449
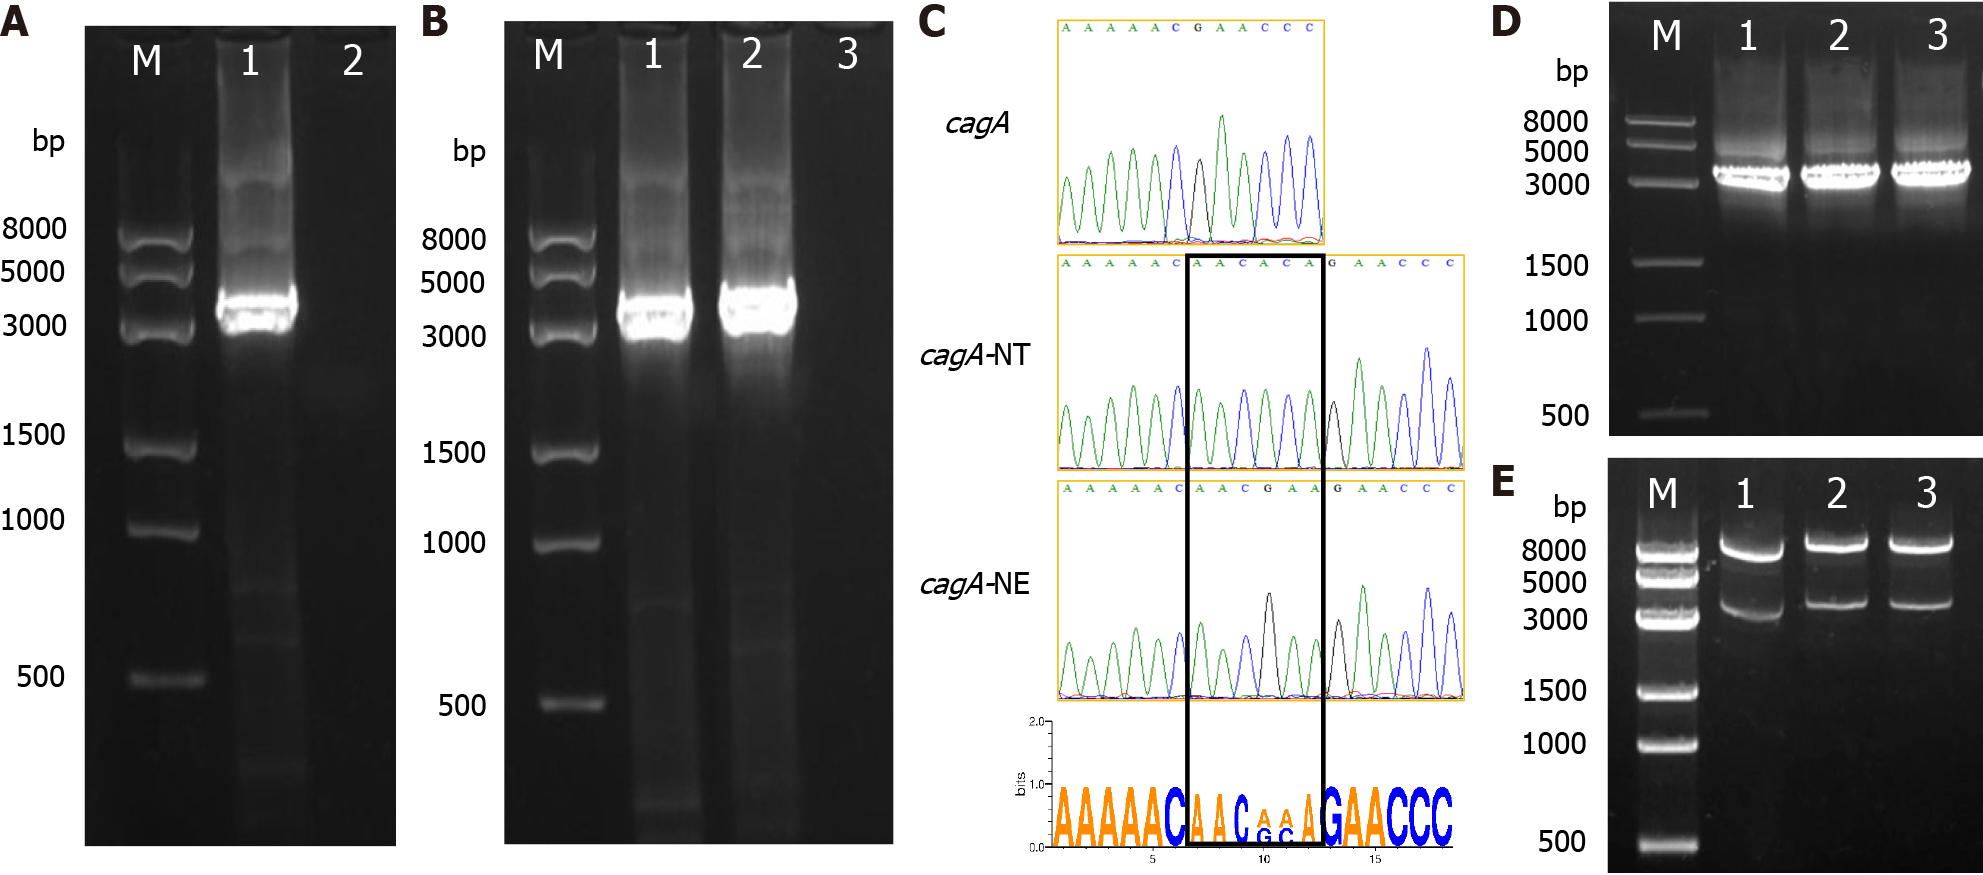
Figure 1 Identification of cytotoxin-associated gene A and its mutated genes.
A: The cytotoxin-associated gene A (cagA) gene was amplified by polymerase chain reaction (PCR) from the HZT strain. Lane M: DNA marker; lane 1 cagA gene; lane 2 Control; B: The mutated gene was amplified by splicing by overlap extension (SOE) PCR. Lane M: DNA marker; lane 1 cagA-NT gene; lane 2 cagA-NE gene; lane 3 Control; C: Sanger sequencing results; D: The target genes were amplified by PCR from eukaryotic expression recombinant plasmids. Lane M: DL8000 DNA marker; lane 1 pAdtrack/cagA; lane 2 pAdtrack/cagA-NT; lane 3 pAdtrack/cagA-NE; E: Double enzyme identification results. Lane M: DL8000 DNA marker; lane 1 pAdtrack/cagA; lane 2 pAdtrack/cagA-NT; lane 3 pAdtrack/cagA-NE. cagA: Cytotoxin-associated gene A.
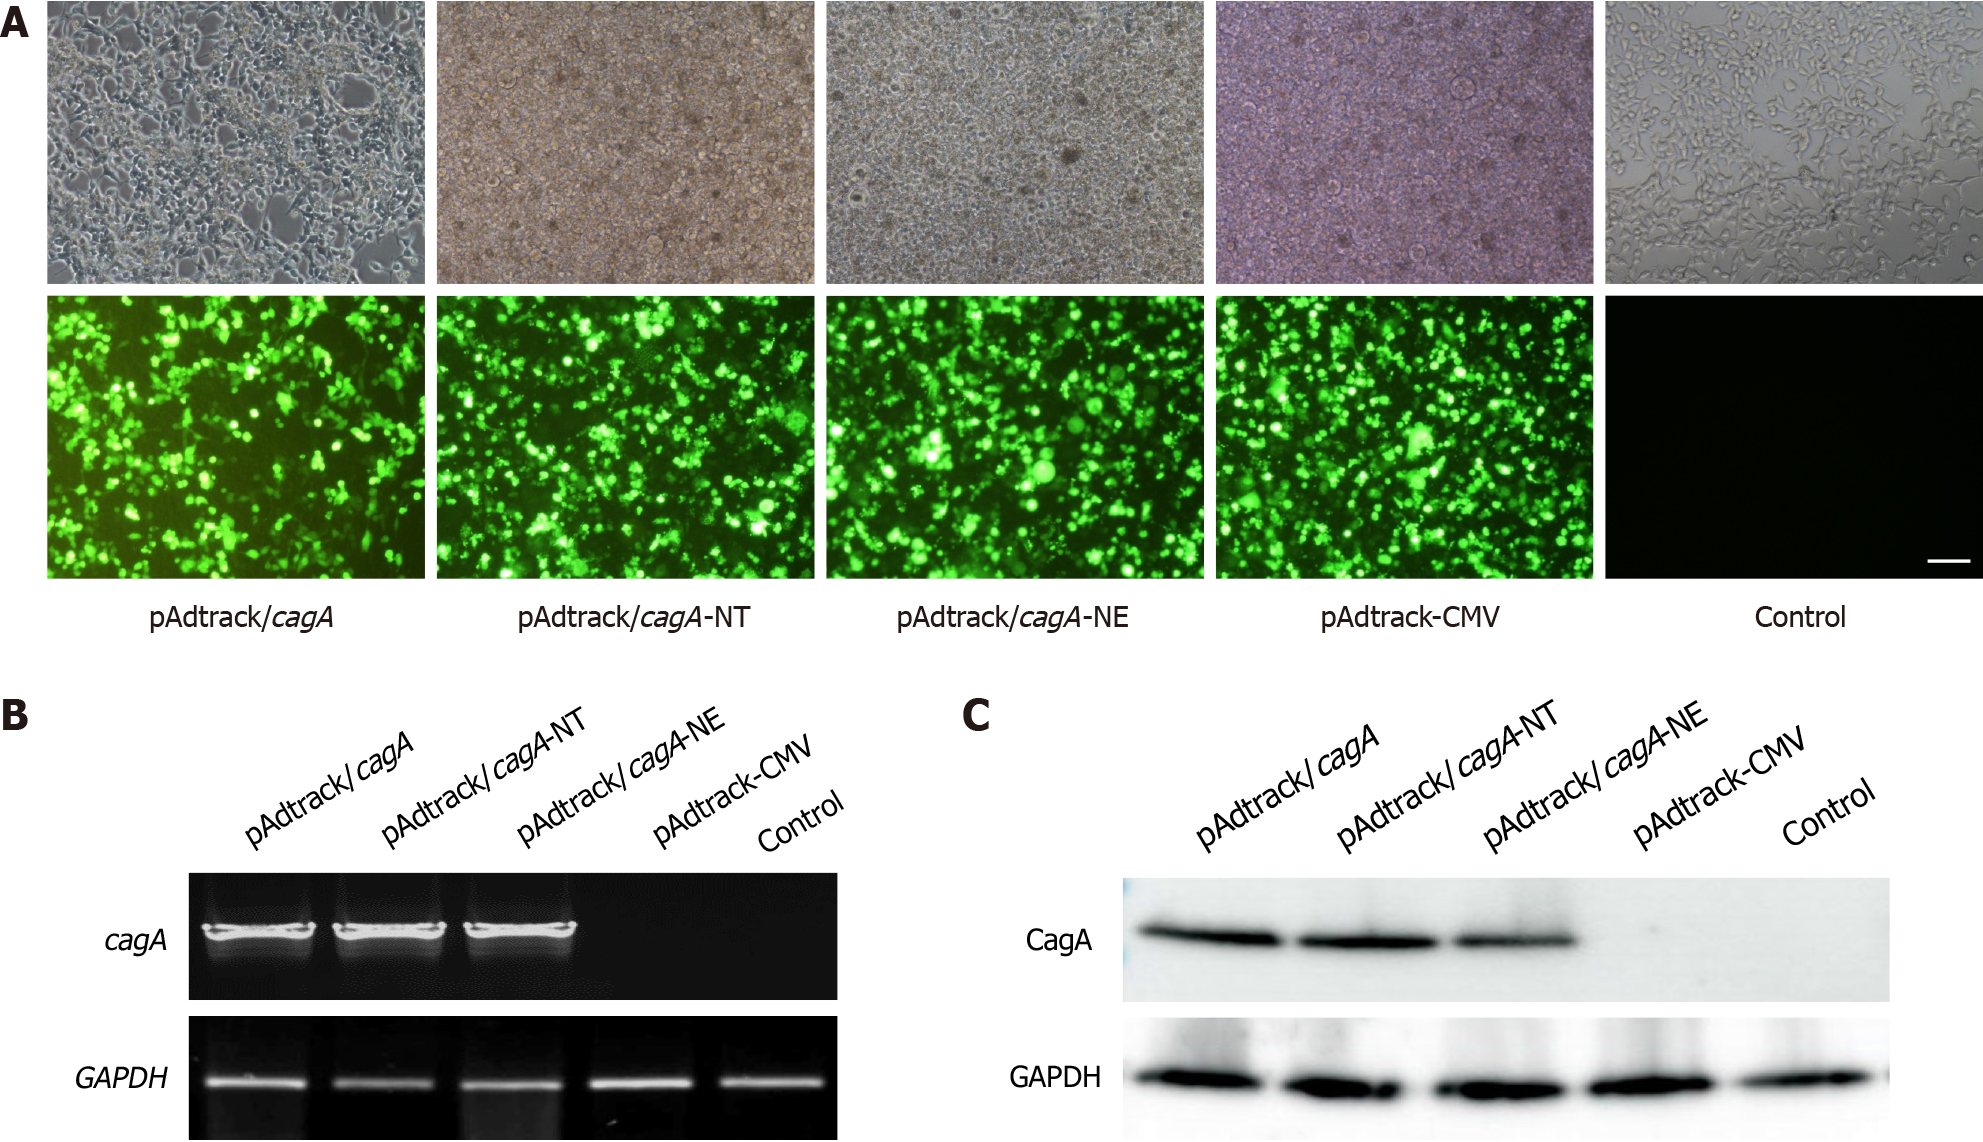
Figure 2 Detection of each plasmid transfection efficiency and expression of each cytotoxin-associated gene A in AGS cells.
A: Images under an ordinary light microscope and fluorescence photos after each cytotoxin-associated gene A (cagA) transfection into AGS (100 ×). Scale bar = 100 μm; B: The mRNA expression levels in AGS cells; C: The protein levels in AGS cells. CagA proteins were quantified using by Western blot analysis.
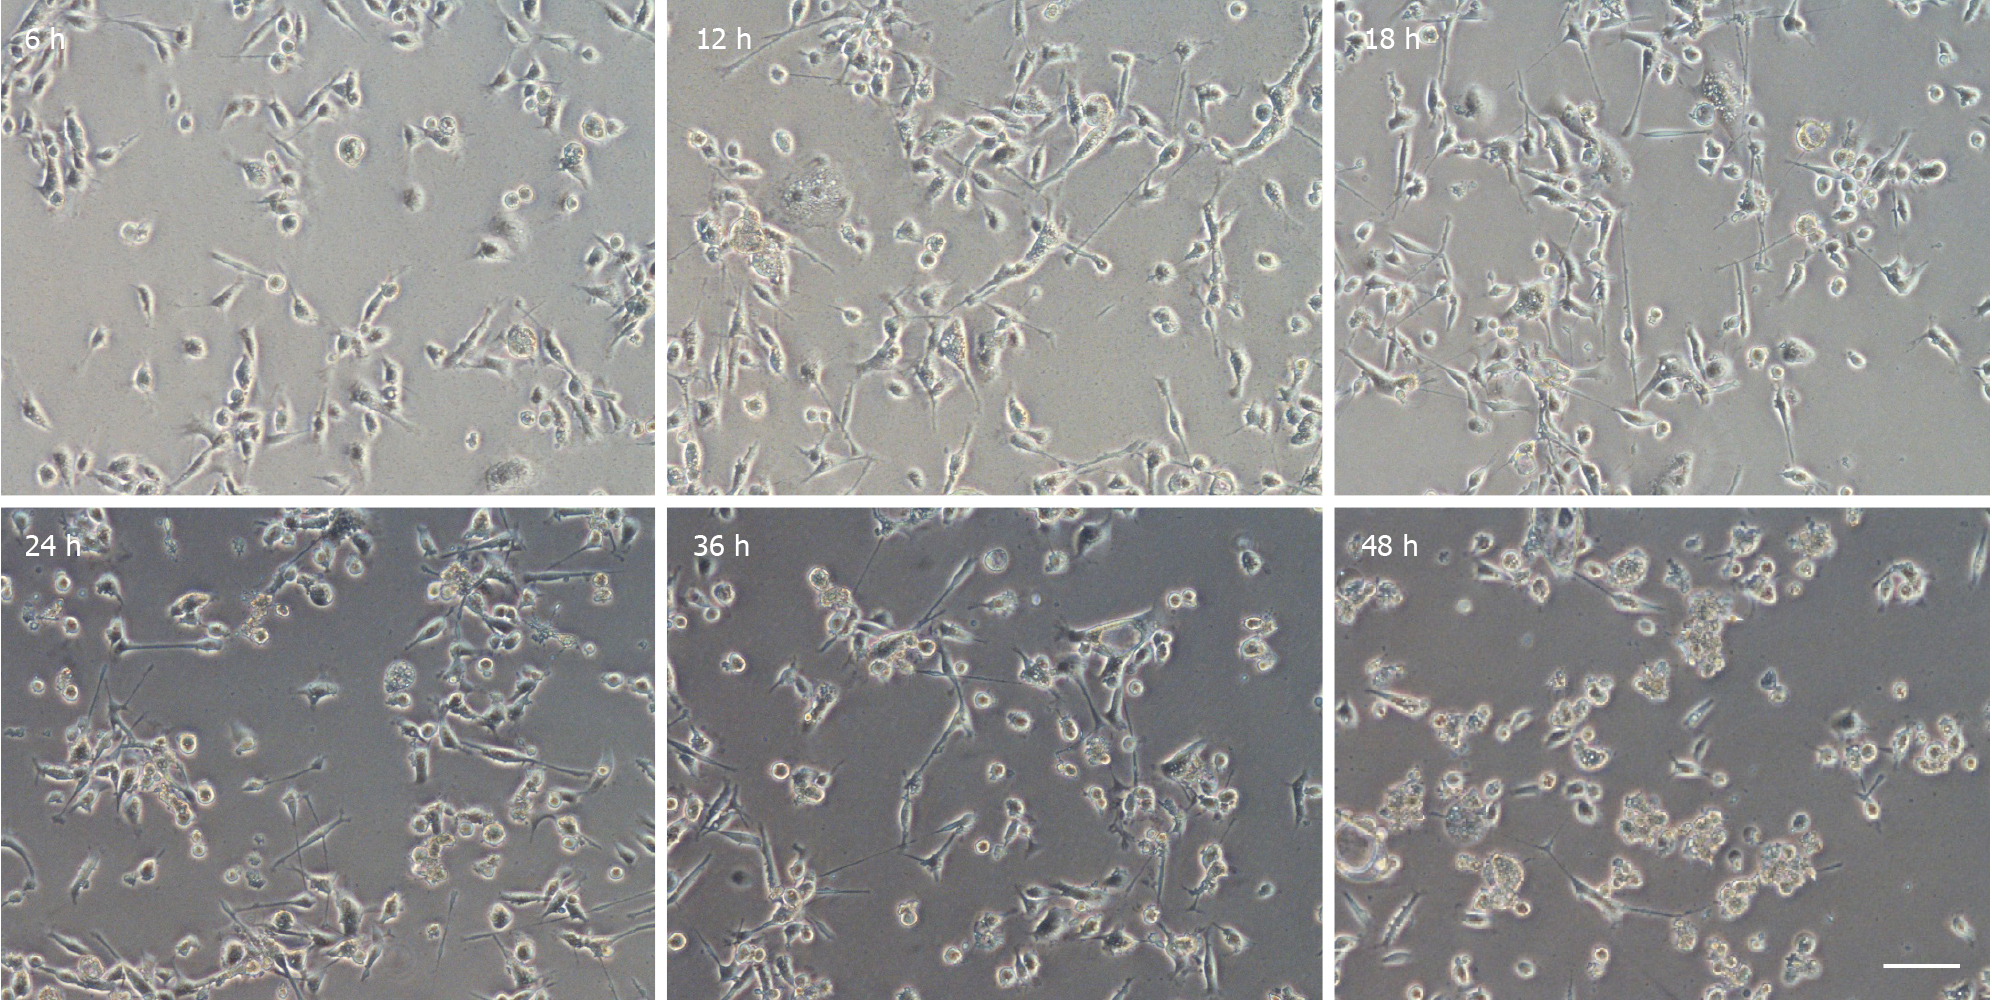
Figure 3 Observation of cell morphology at different times after transfection (100 ×).
Representative micrographs of AGS cells transfected with pAdtrack/cytotoxin-associated gene A were shown. Scale bar = 100 μm. cagA: Cytotoxin-associated gene A.
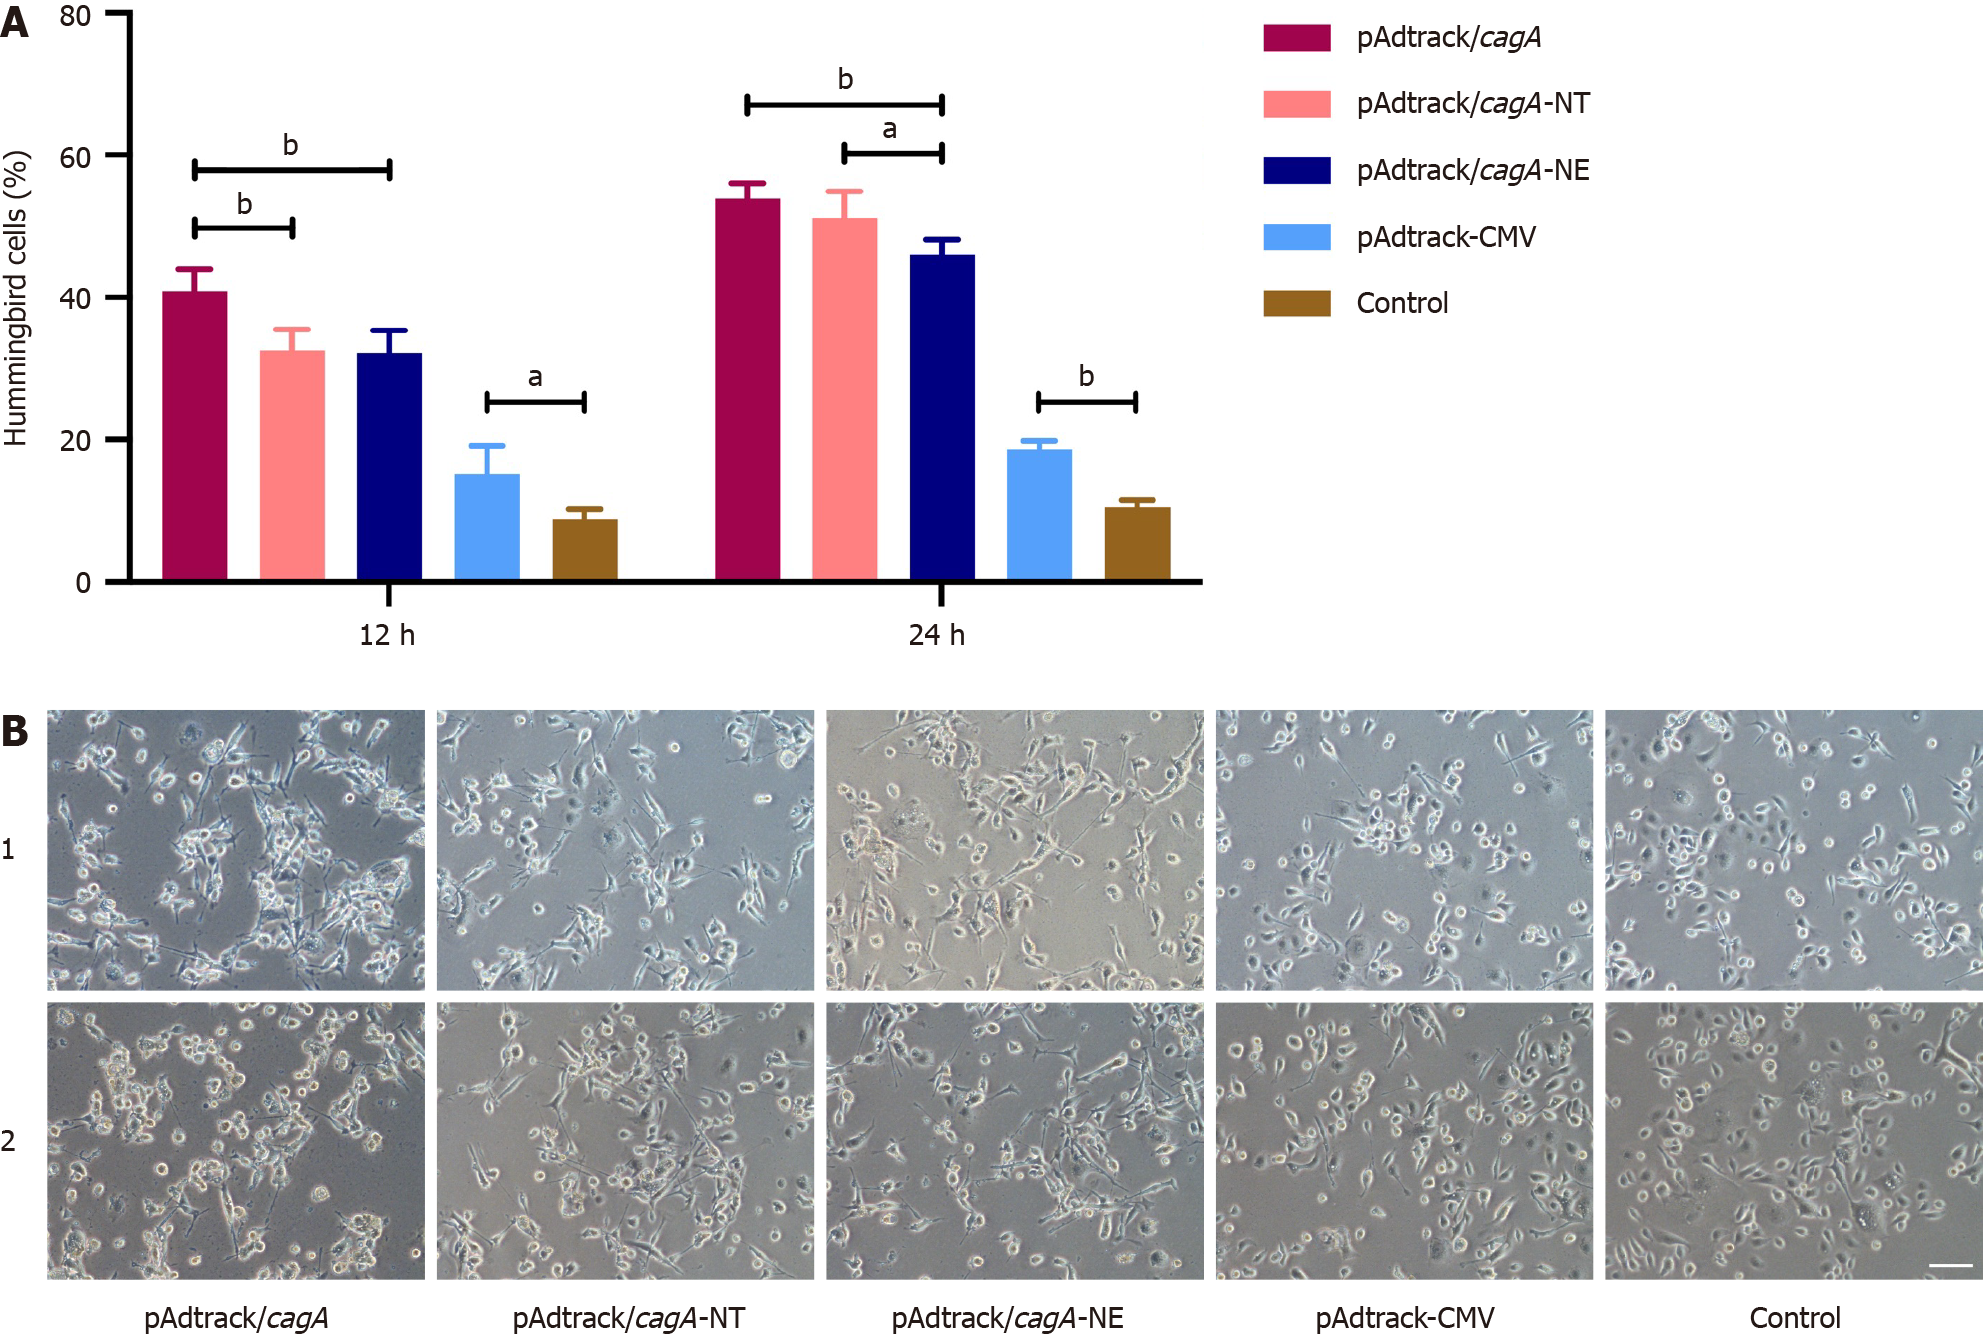
Figure 4 Induction of AGS cells hummingbird phenotype.
A: The percentage of hummingbird cells at 12 hours and 24 hours after transfection into AGS. The number of hummingbird cells was quantitated in triplicate in 5 random fields and the results were mean ± SD of three independent experiments. Errors bars represent standard errors of the means. aP < 0.05, bP < 0.01; B: Representative micrographs of transfected AGS cells as indicated (100 ×). 1 and 2 represented cell morphology at 12 hours and 24 hours after transfection, respectively. Scale bar = 100 μm.
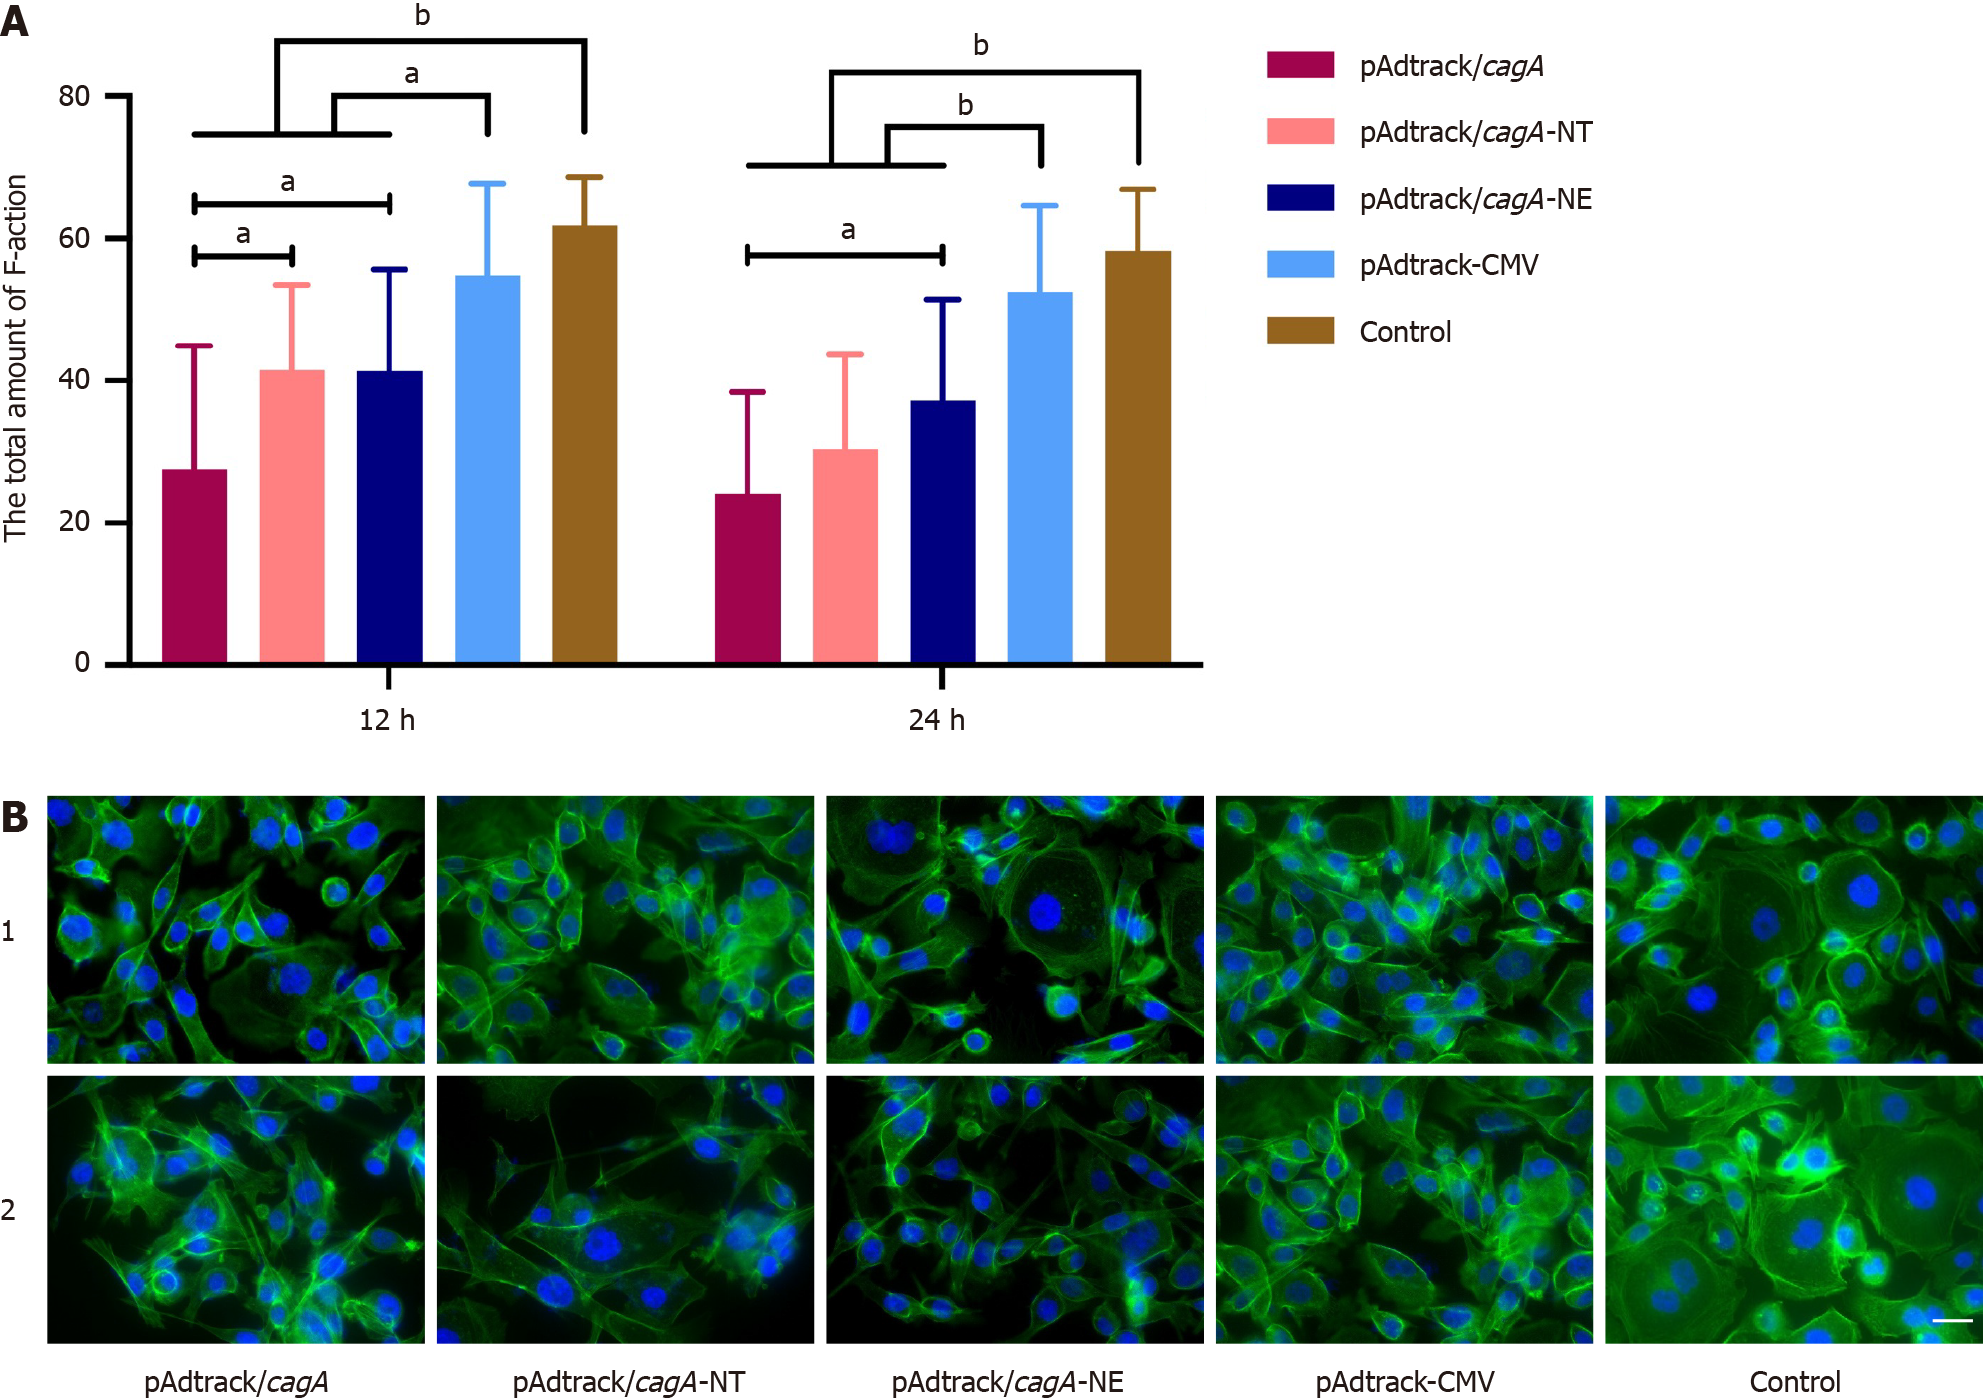
Figure 5 Quantification of the F-actin cytoskeleton with FITC phalloidin stain.
A: The average fluorescence intensity of F-actin at 12 hours and 24 hours after transfection. The data were mean ± SD of three independent experiments. Errors bars represented standard errors of the means. aP < 0.05, bP < 0.01; B: Representative micrographs of F-actin cytoskeleton as indicated (400 ×). AGS cells were labeled for F-actin using FITC phalloidin and the nucleus was stained with DAPI. F-actin was shown in green, and the nucleus was labeled with blue. 1 and 2 represented the F-actin cytoskeleton at 12 hours and 24 hours after transfection, respectively. Scale bar = 25 μm.
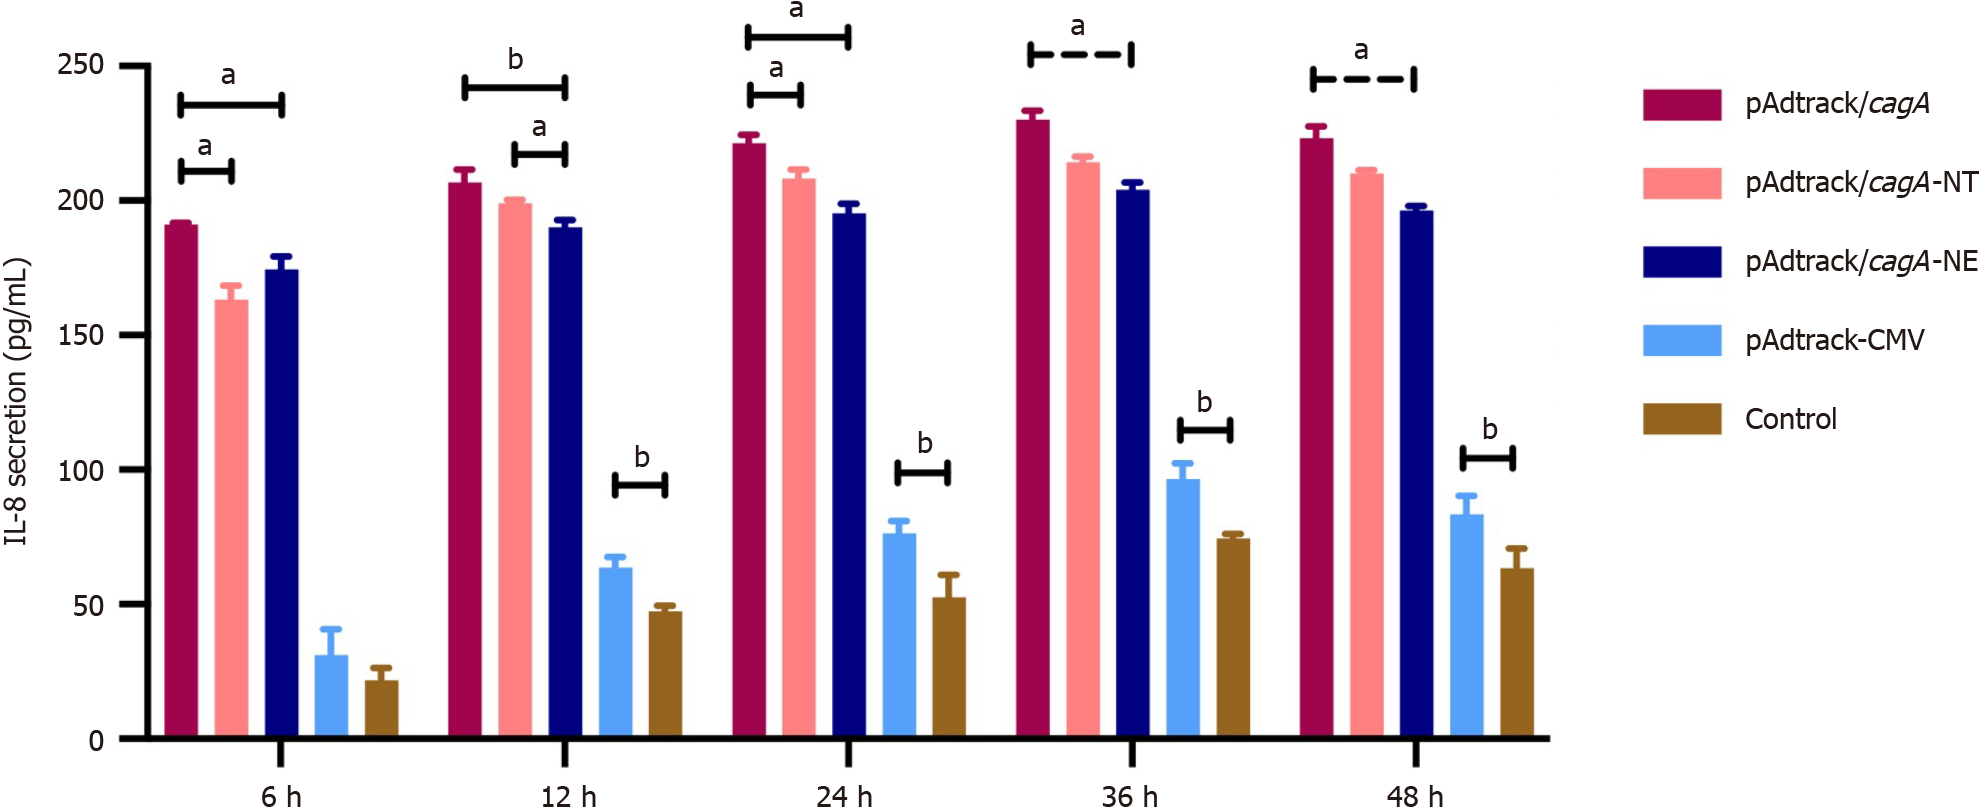
Figure 6 The secretion of interleukin-8 after transfection into AGS cells.
The data were mean ± SD of three independent experiments. Errors bars represented standard errors of the means. aP < 0.05, bP < 0.01. The solid line was the statistical result between the two groups, and the dashed line was the statistical result in multiple groups.
- Citation: Xue ZJ, Gong YN, He LH, Sun L, You YH, Fan DJ, Zhang MJ, Yan XM, Zhang JZ. Amino acid deletions at positions 893 and 894 of cytotoxin-associated gene A protein affect Helicobacter pylori gastric epithelial cell interactions. World J Gastroenterol 2024; 30(41): 4449-4460
- URL: https://www.wjgnet.com/1007-9327/full/v30/i41/4449.htm
- DOI: https://dx.doi.org/10.3748/wjg.v30.i41.4449


