Copyright
©The Author(s) 2024.
World J Gastroenterol. Oct 21, 2024; 30(39): 4281-4294
Published online Oct 21, 2024. doi: 10.3748/wjg.v30.i39.4281
Published online Oct 21, 2024. doi: 10.3748/wjg.v30.i39.4281
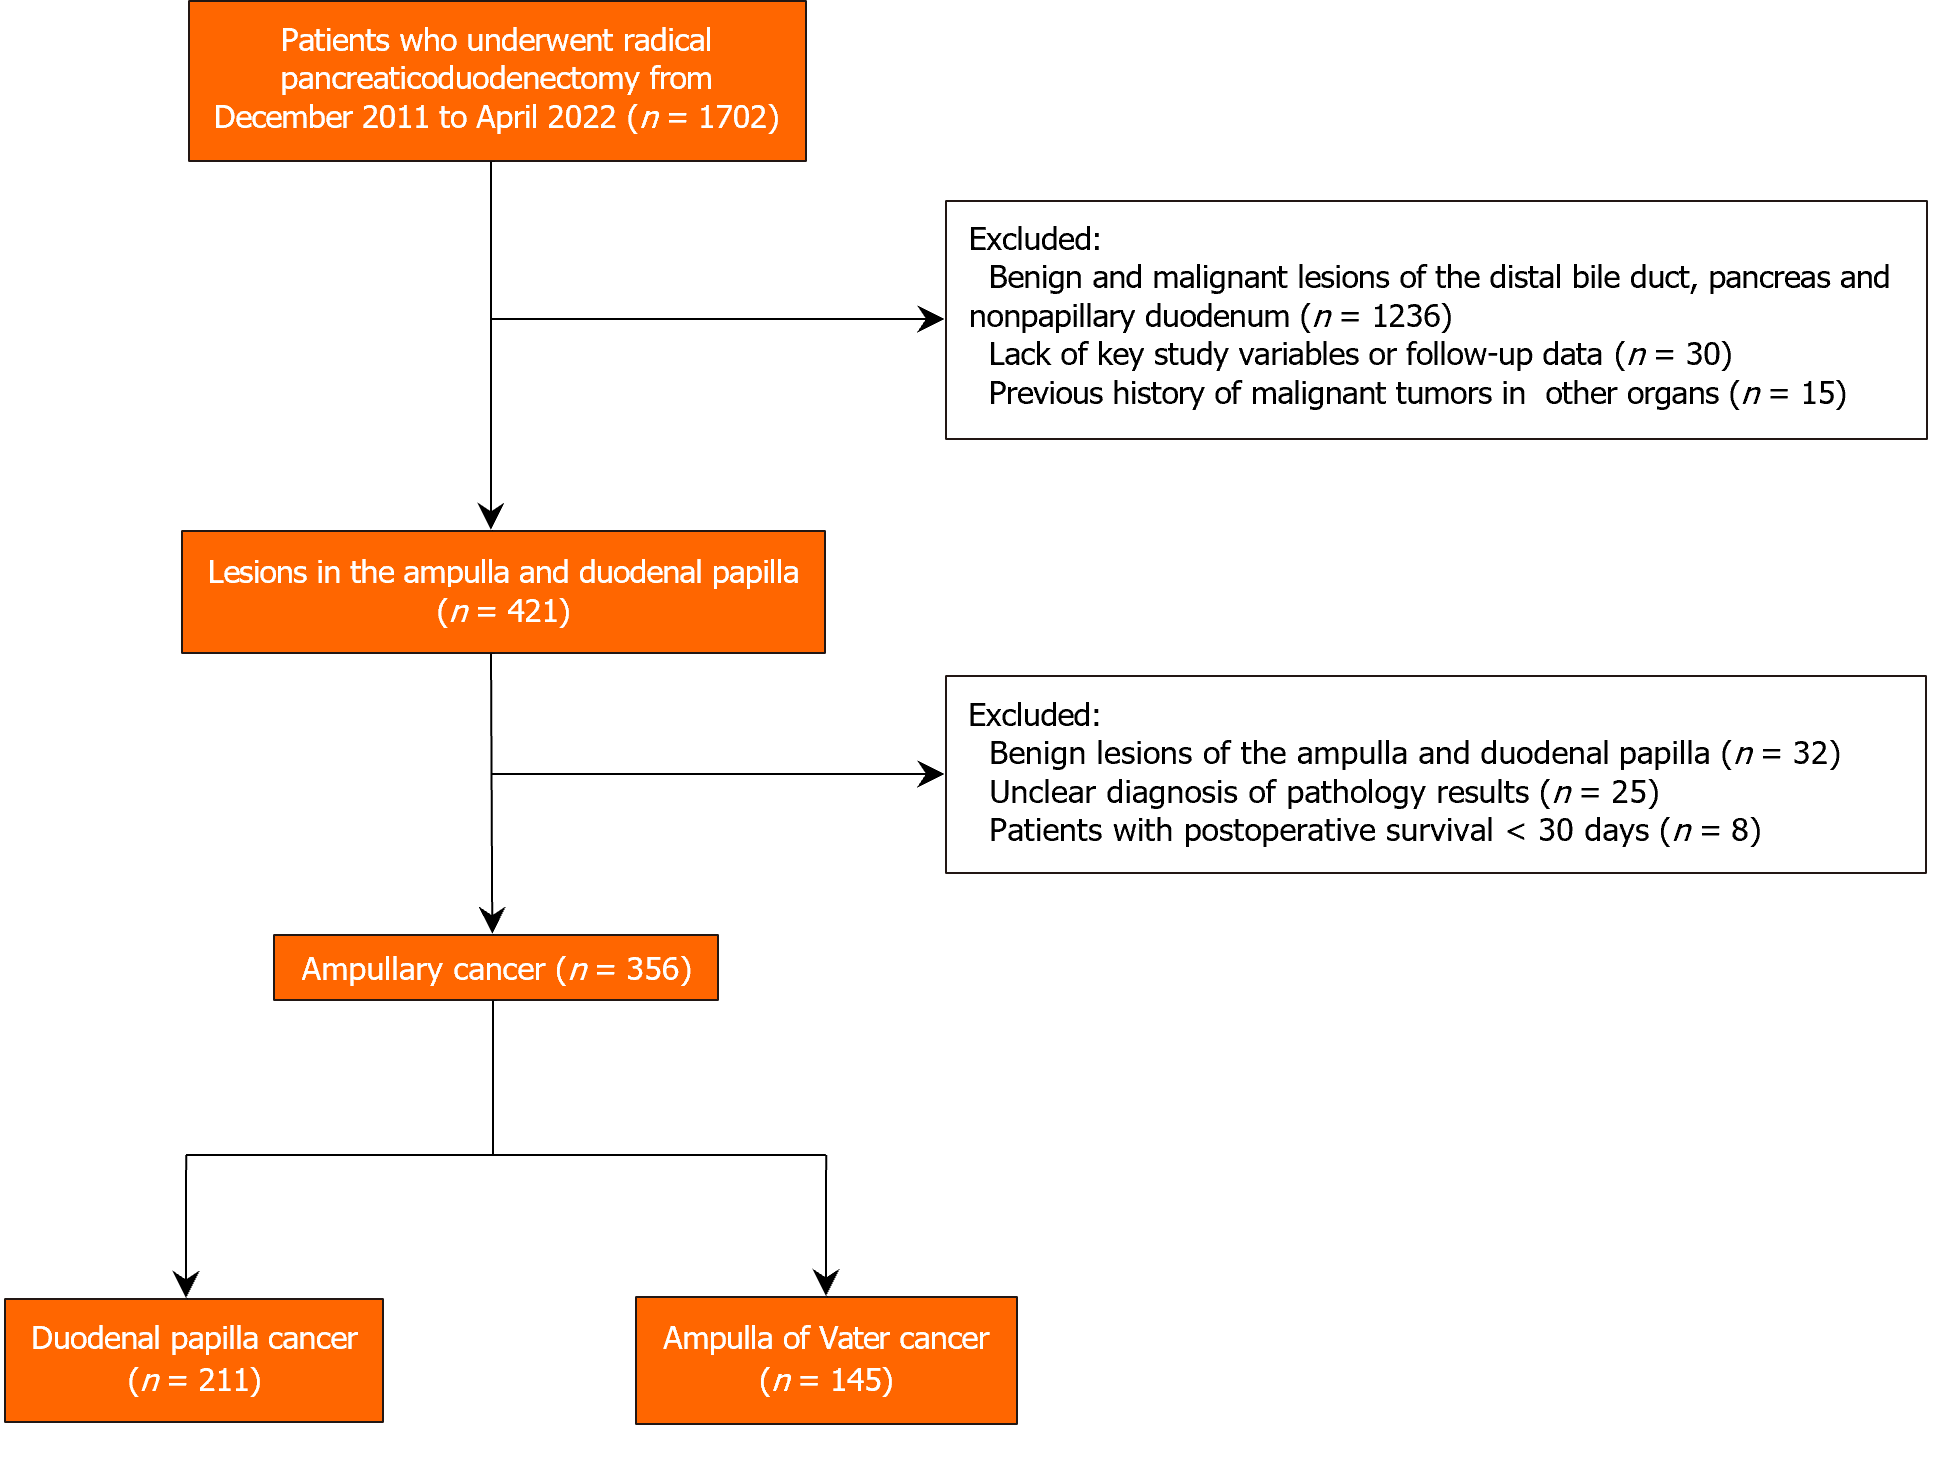
Figure 1 The flowchart of case selection.
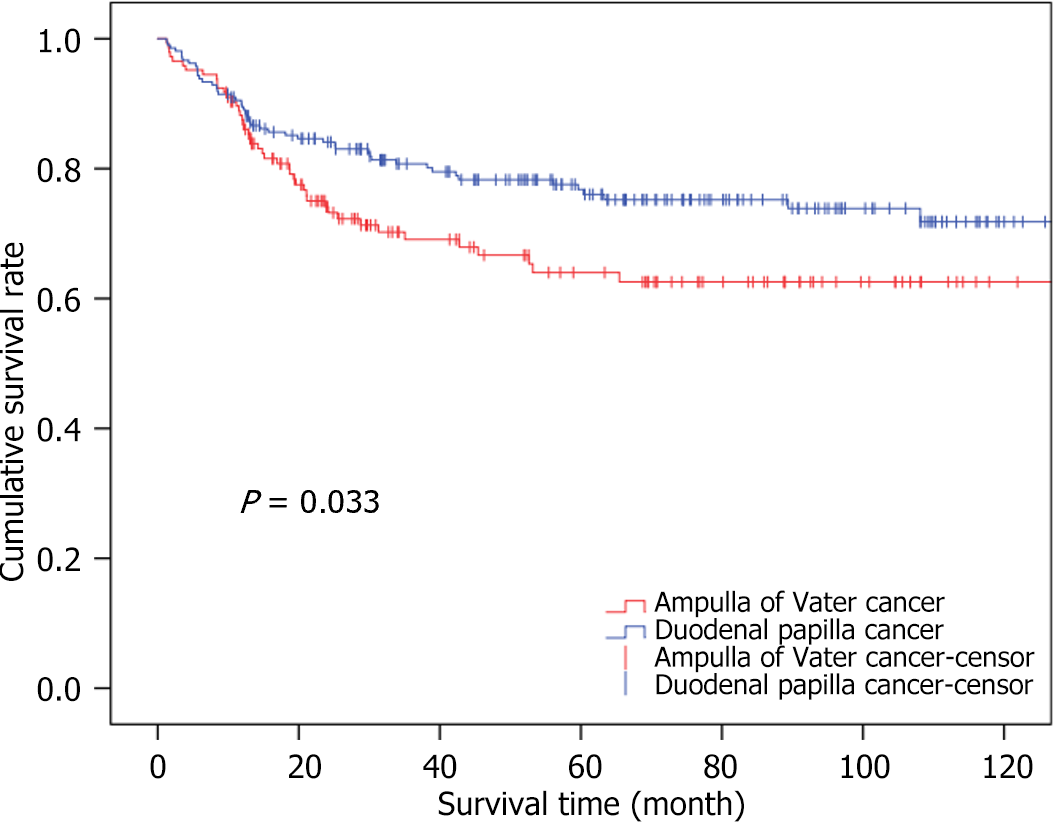
Figure 2 Kaplan-Meier curve of overall survival between ampulla of Vater cancer and duodenal papilla cancer.
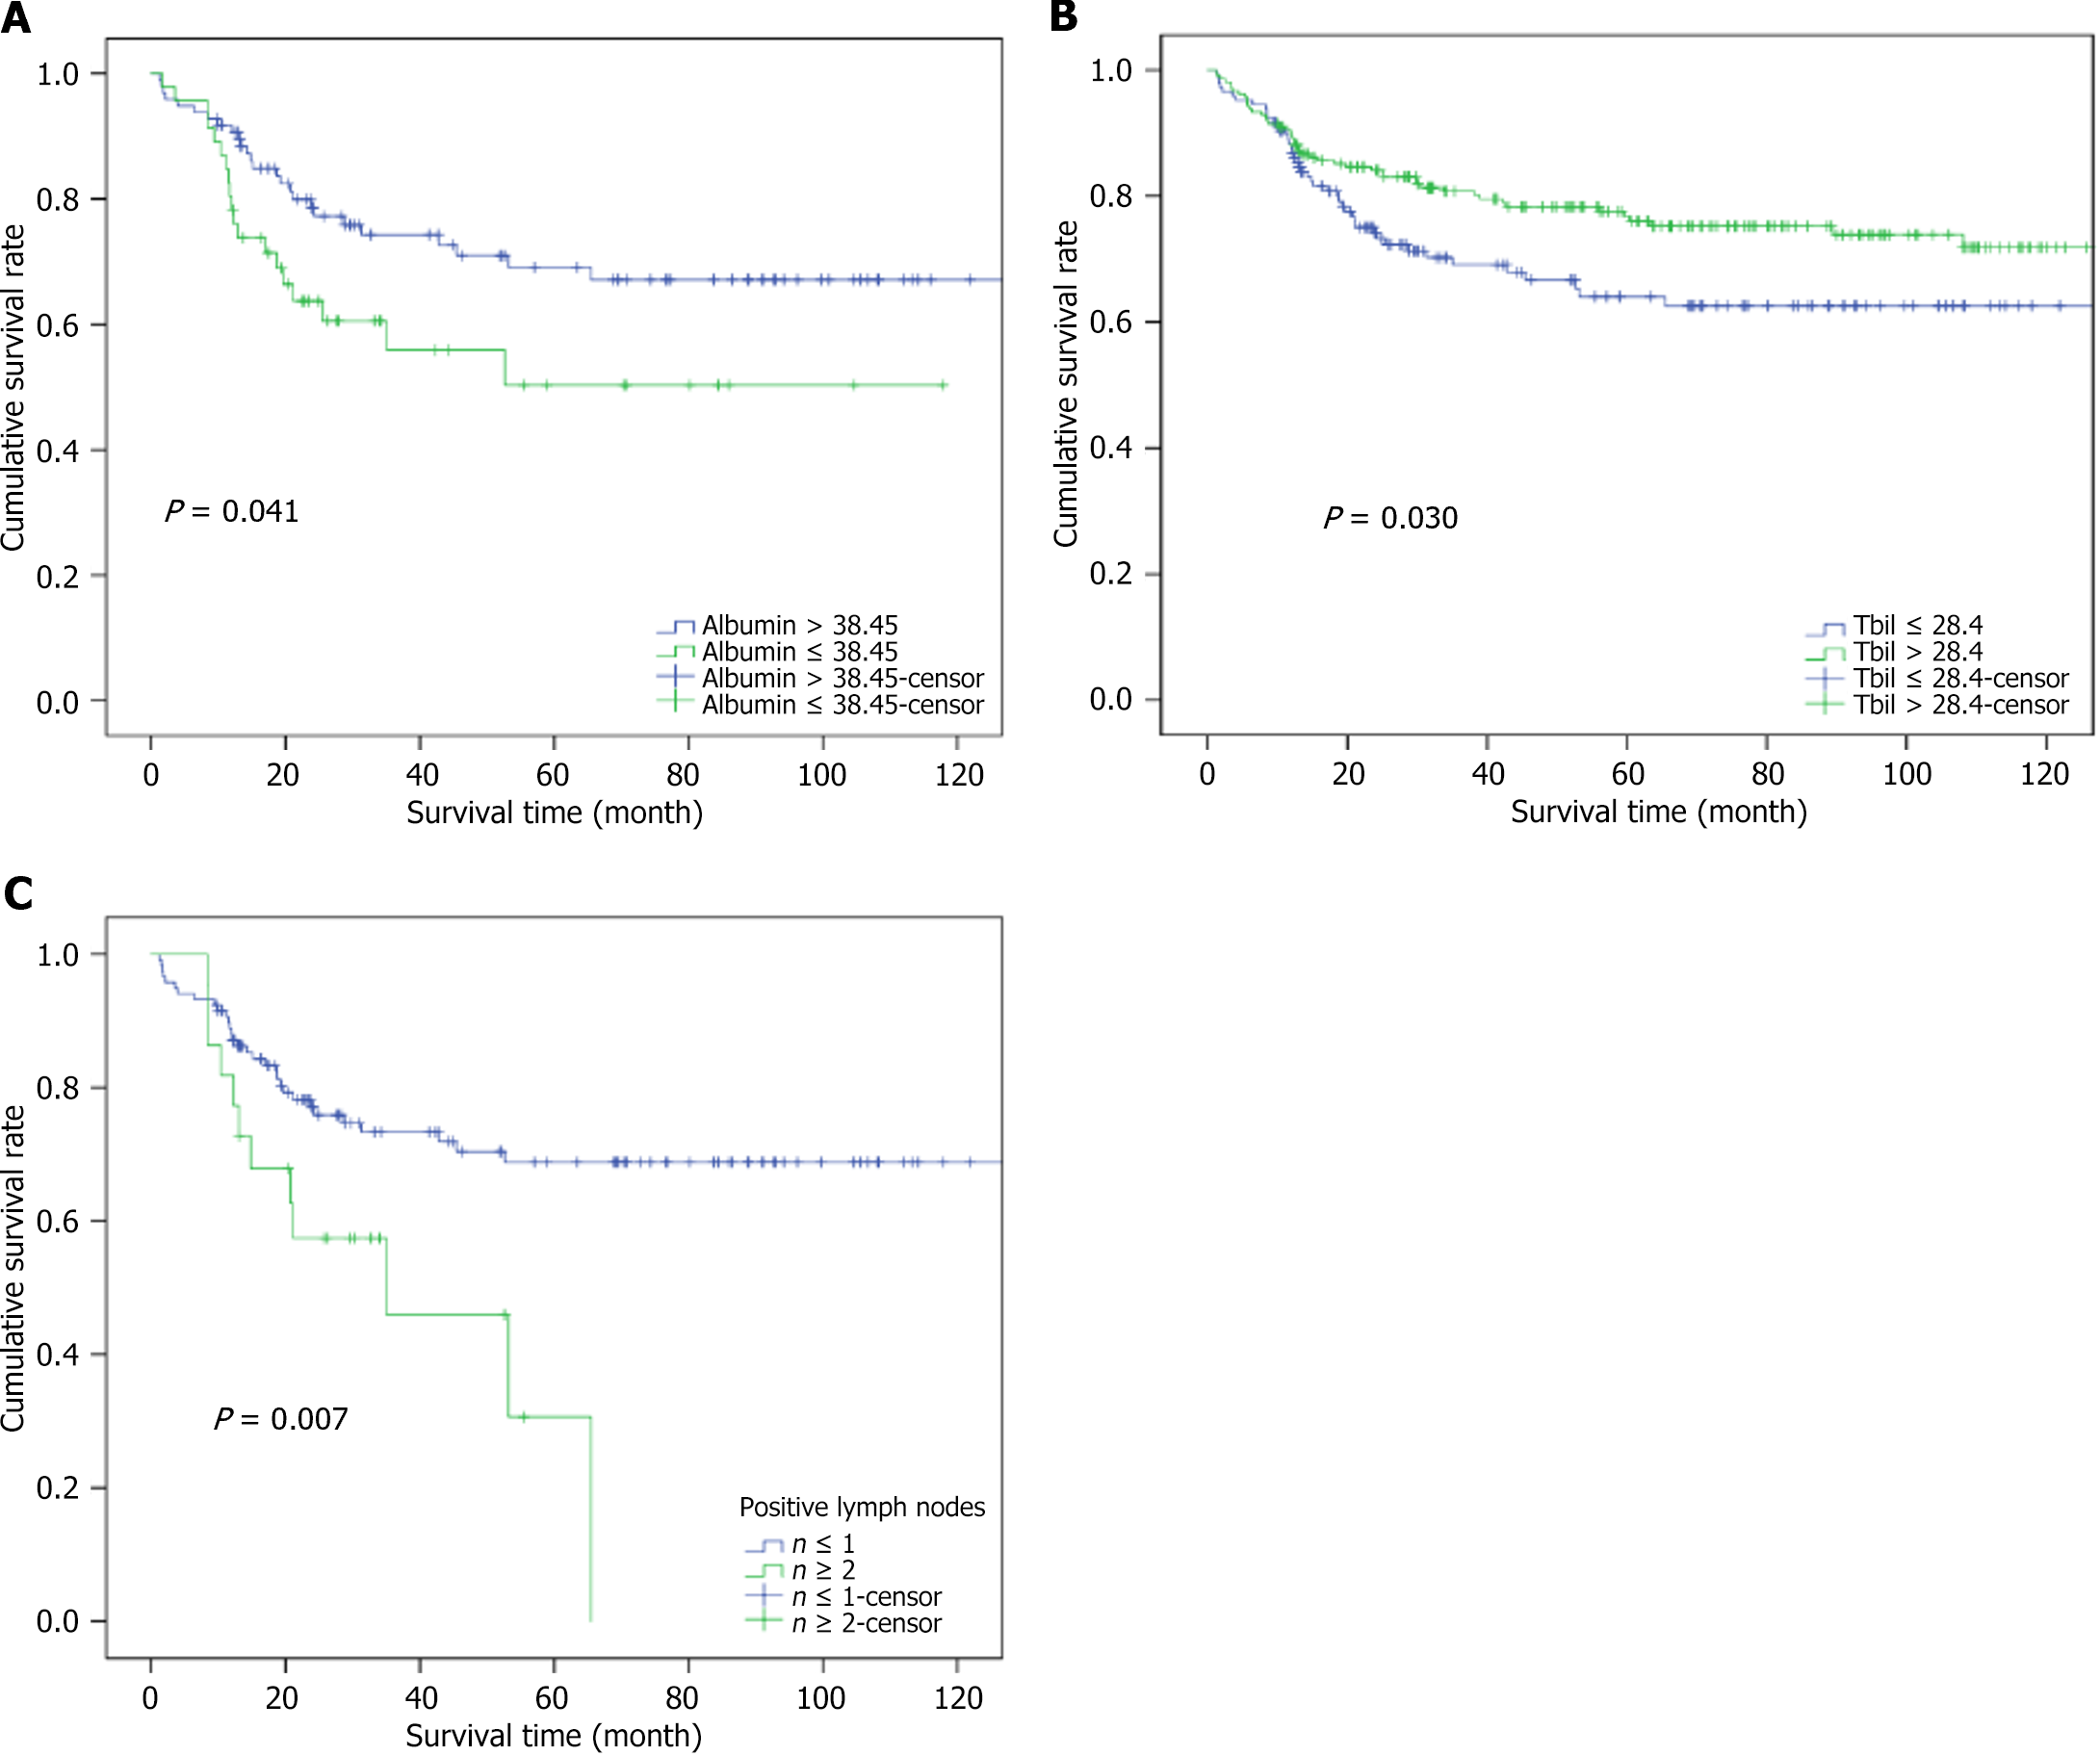
Figure 3 Kaplan-Meier survival curves for the impact of three risk factors on the overall survival of ampulla of Vater cancer.
A: Kaplan-Meier survival curve for the impact of preoperative albumin on the overall survival of ampulla of Vater cancer (AVC); B: Kaplan-Meier survival curve for the impact of preoperative total bilirubin on the overall survival of AVC; C: Kaplan-Meier survival curve for the impact of the number of positive lymph node on the overall survival of AVC. Tbil: Total bilirubin.
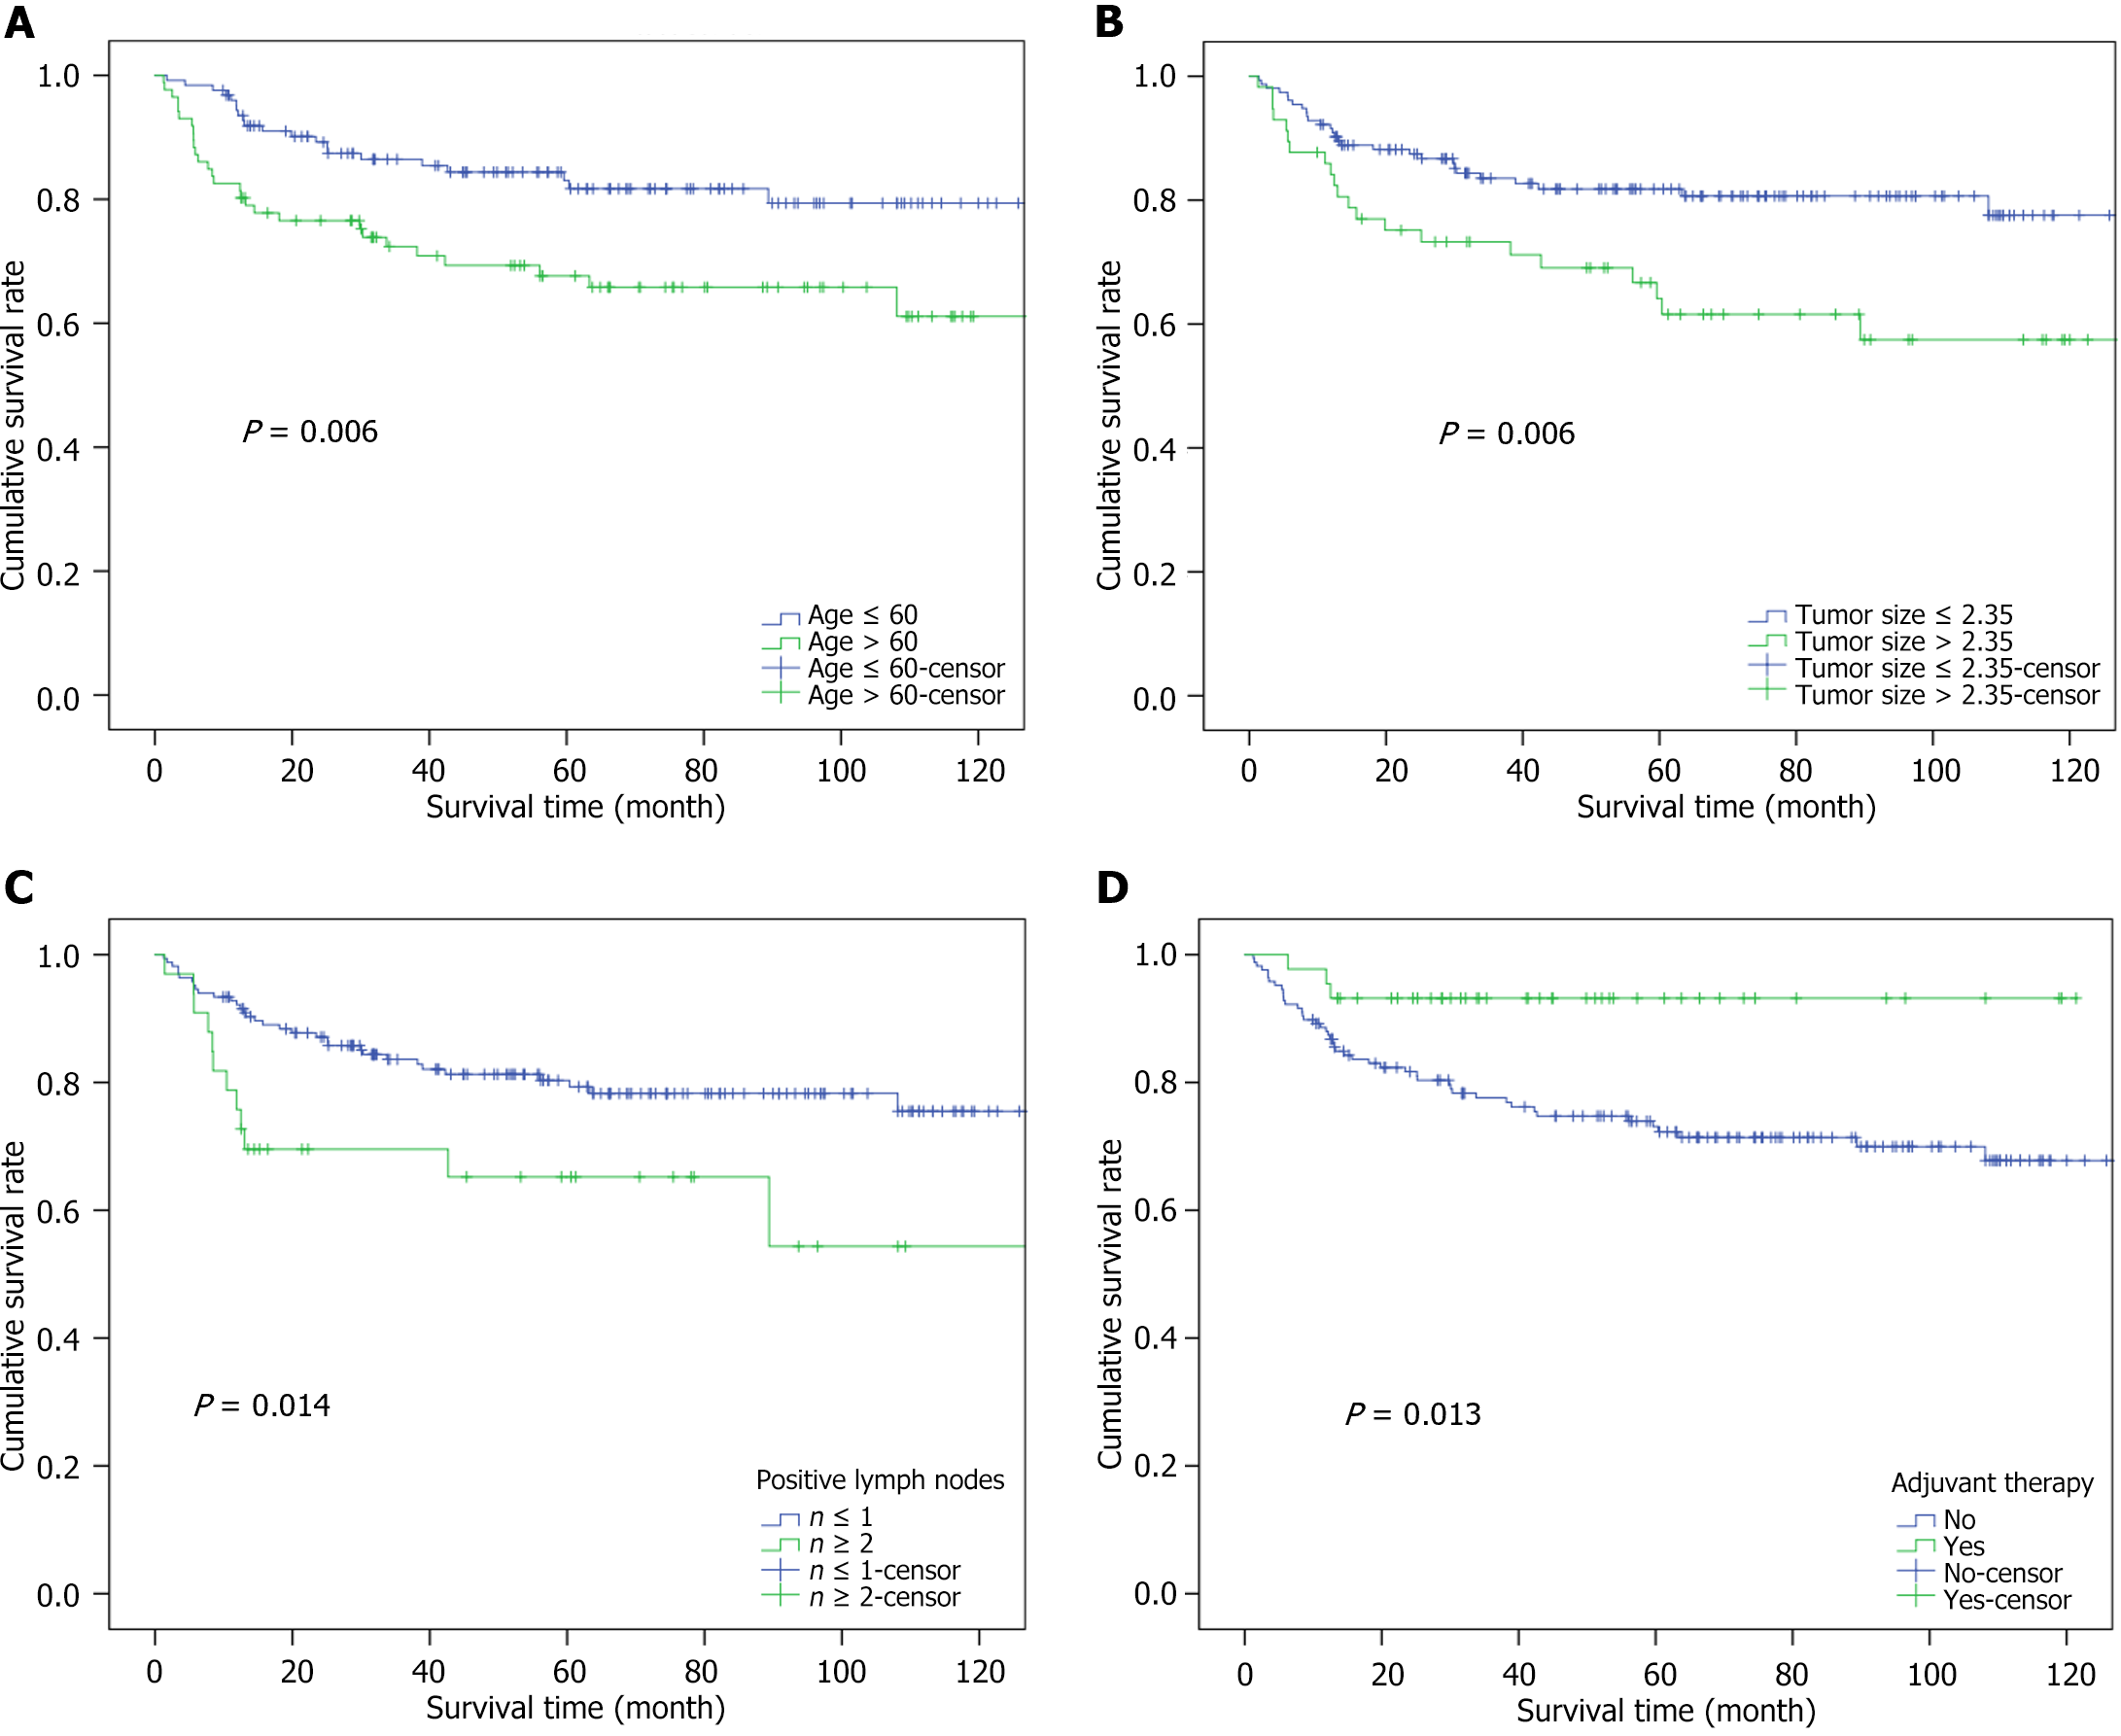
Figure 4 Kaplan-Meier survival curves for the impact of four risk factors on the overall survival of duodenal papilla cancer.
A: Kaplan-Meier survival curve for the impact of age on the overall survival of duodenal papilla cancer (DPC); B: Kaplan-Meier survival curve for the impact of tumor size on the overall survival of DPC; C: Kaplan-Meier survival curve for the impact of the number of positive lymph nodes on the overall survival of DPC; D: Kaplan-Meier survival curve for the impact of adjuvant therapy on the overall survival of DPC.
- Citation: Zhang JZ, Zhang ZW, Guo XY, Zhu DS, Huang XR, Cai M, Guo T, Yu YH. Comparison of clinical characteristics and prognostic factors in two site-specific categories of ampullary cancer. World J Gastroenterol 2024; 30(39): 4281-4294
- URL: https://www.wjgnet.com/1007-9327/full/v30/i39/4281.htm
- DOI: https://dx.doi.org/10.3748/wjg.v30.i39.4281


