Copyright
©The Author(s) 2023.
World J Gastroenterol. Jan 21, 2024; 30(3): 252-267
Published online Jan 21, 2024. doi: 10.3748/wjg.v30.i3.252
Published online Jan 21, 2024. doi: 10.3748/wjg.v30.i3.252
Figure 1 SLC6A14 in ulcerative colitis tissues.
A: Hematoxylin and eosin staining and immunohistochemical (IHC) analysis of SLC6A14 expression in normal and ulcerative colitis (UC) tissues (magnification, × 200; scale bar = 100 μm); B: SLC6A14 mRNA levels were assessed by real-time polymerase chain reaction in UC (n = 55) and normal tissues (n = 29); C and D: SLC6A14 protein levels in UC (n = 55) and normal tissue samples (n = 29); E: Quantification of the IHC scores for SLC6A14 expression; F and G: NLRP3 protein levels in UC (n = 55) and normal tissue samples (n = 29); H: Association between SLC6A14 and NLRP3 levels in human colonic tissues. The data represent the means ± SD. aP < 0.01 vs the controls. UC: Ulcerative colitis.
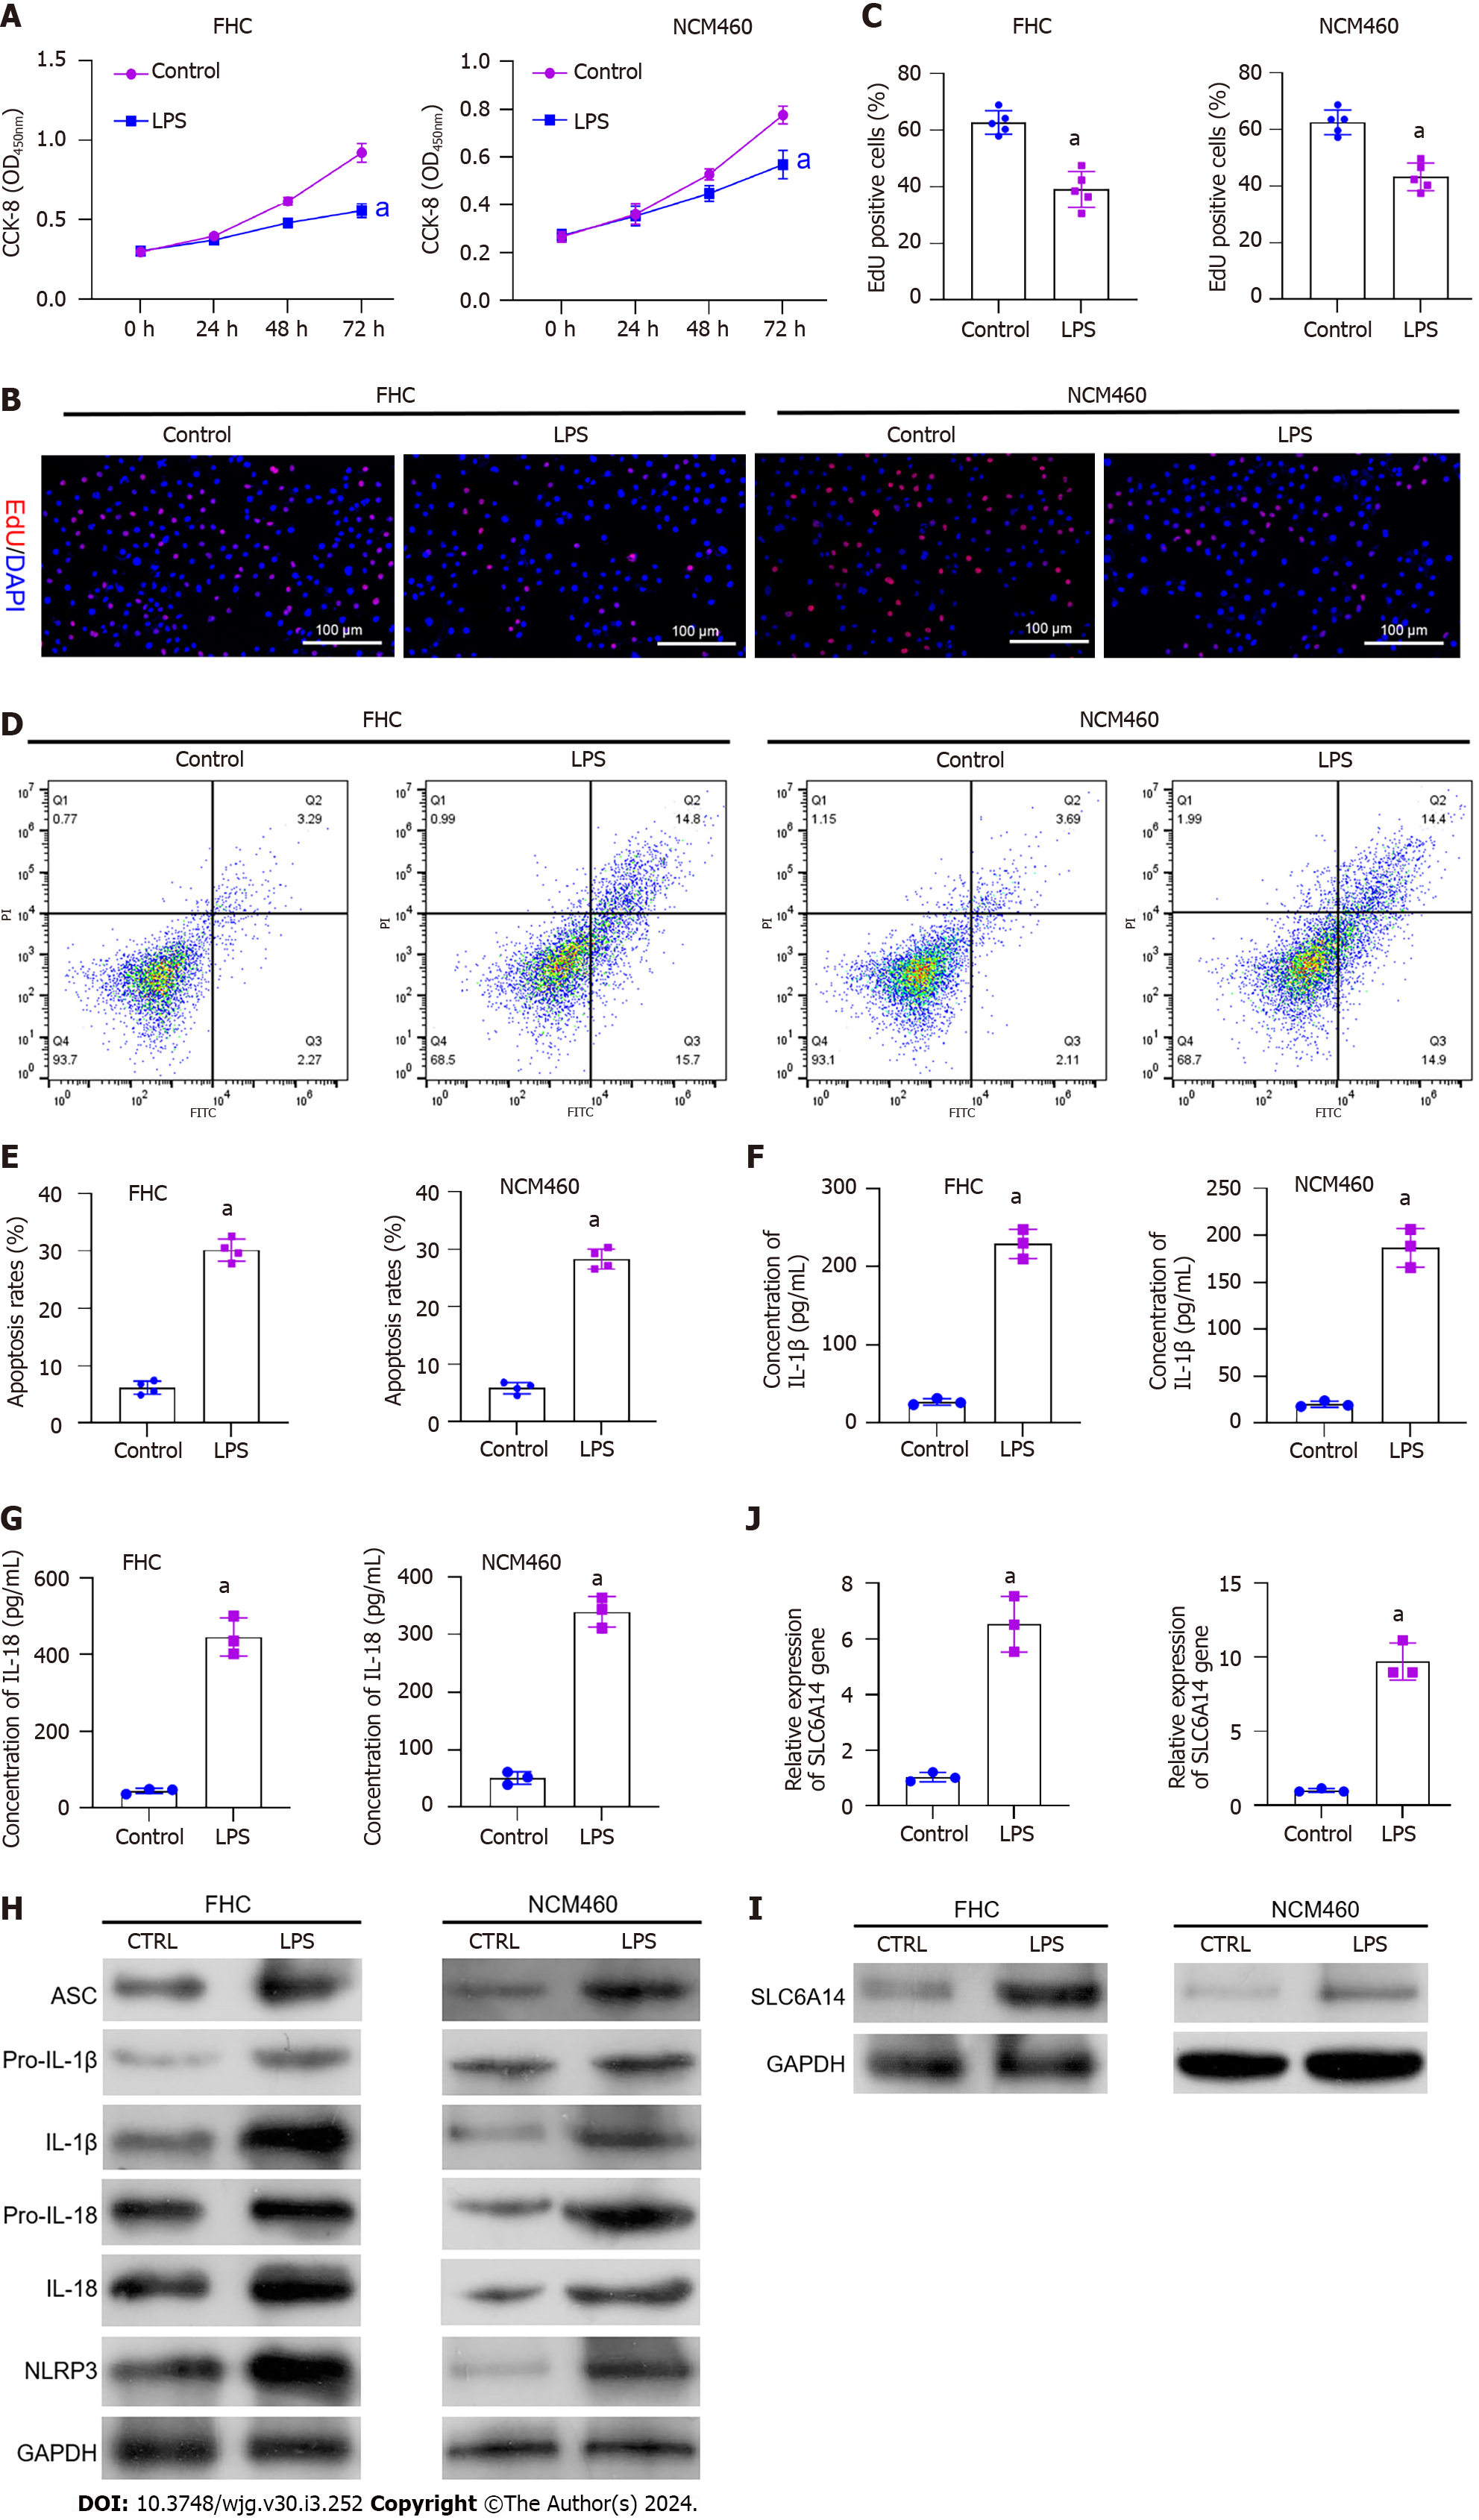
Figure 2 Induction of pyroptosis by lipopolysaccharide in FHC and NCM460 intestinal epithelial cells.
A: CCK-8 assay showing the impact of lipopolysaccharide (LPS) on FHC and NCM460 cell proliferation; B: EdU assay showing the proliferation of LPS-treated and untreated FHC and NCM460 cells; C: Quantification of EdU-positive cells; D and E: Flow cytometric analysis of apoptosis in cells with and without LPS treatment; F and G: Enzyme-linked immunosorbent assay analysis of the effects of LPS on IL-1β and IL-18 secretion; H: Western blot analysis showing the levels of pyroptosis-associated proteins in LPS-treated and untreated cells; I and J: Western blot analysis showing SLC6A14 levels in LPS-treated and control cells. aP < 0.01 vs controls. LPS: Lipopolysaccharide.
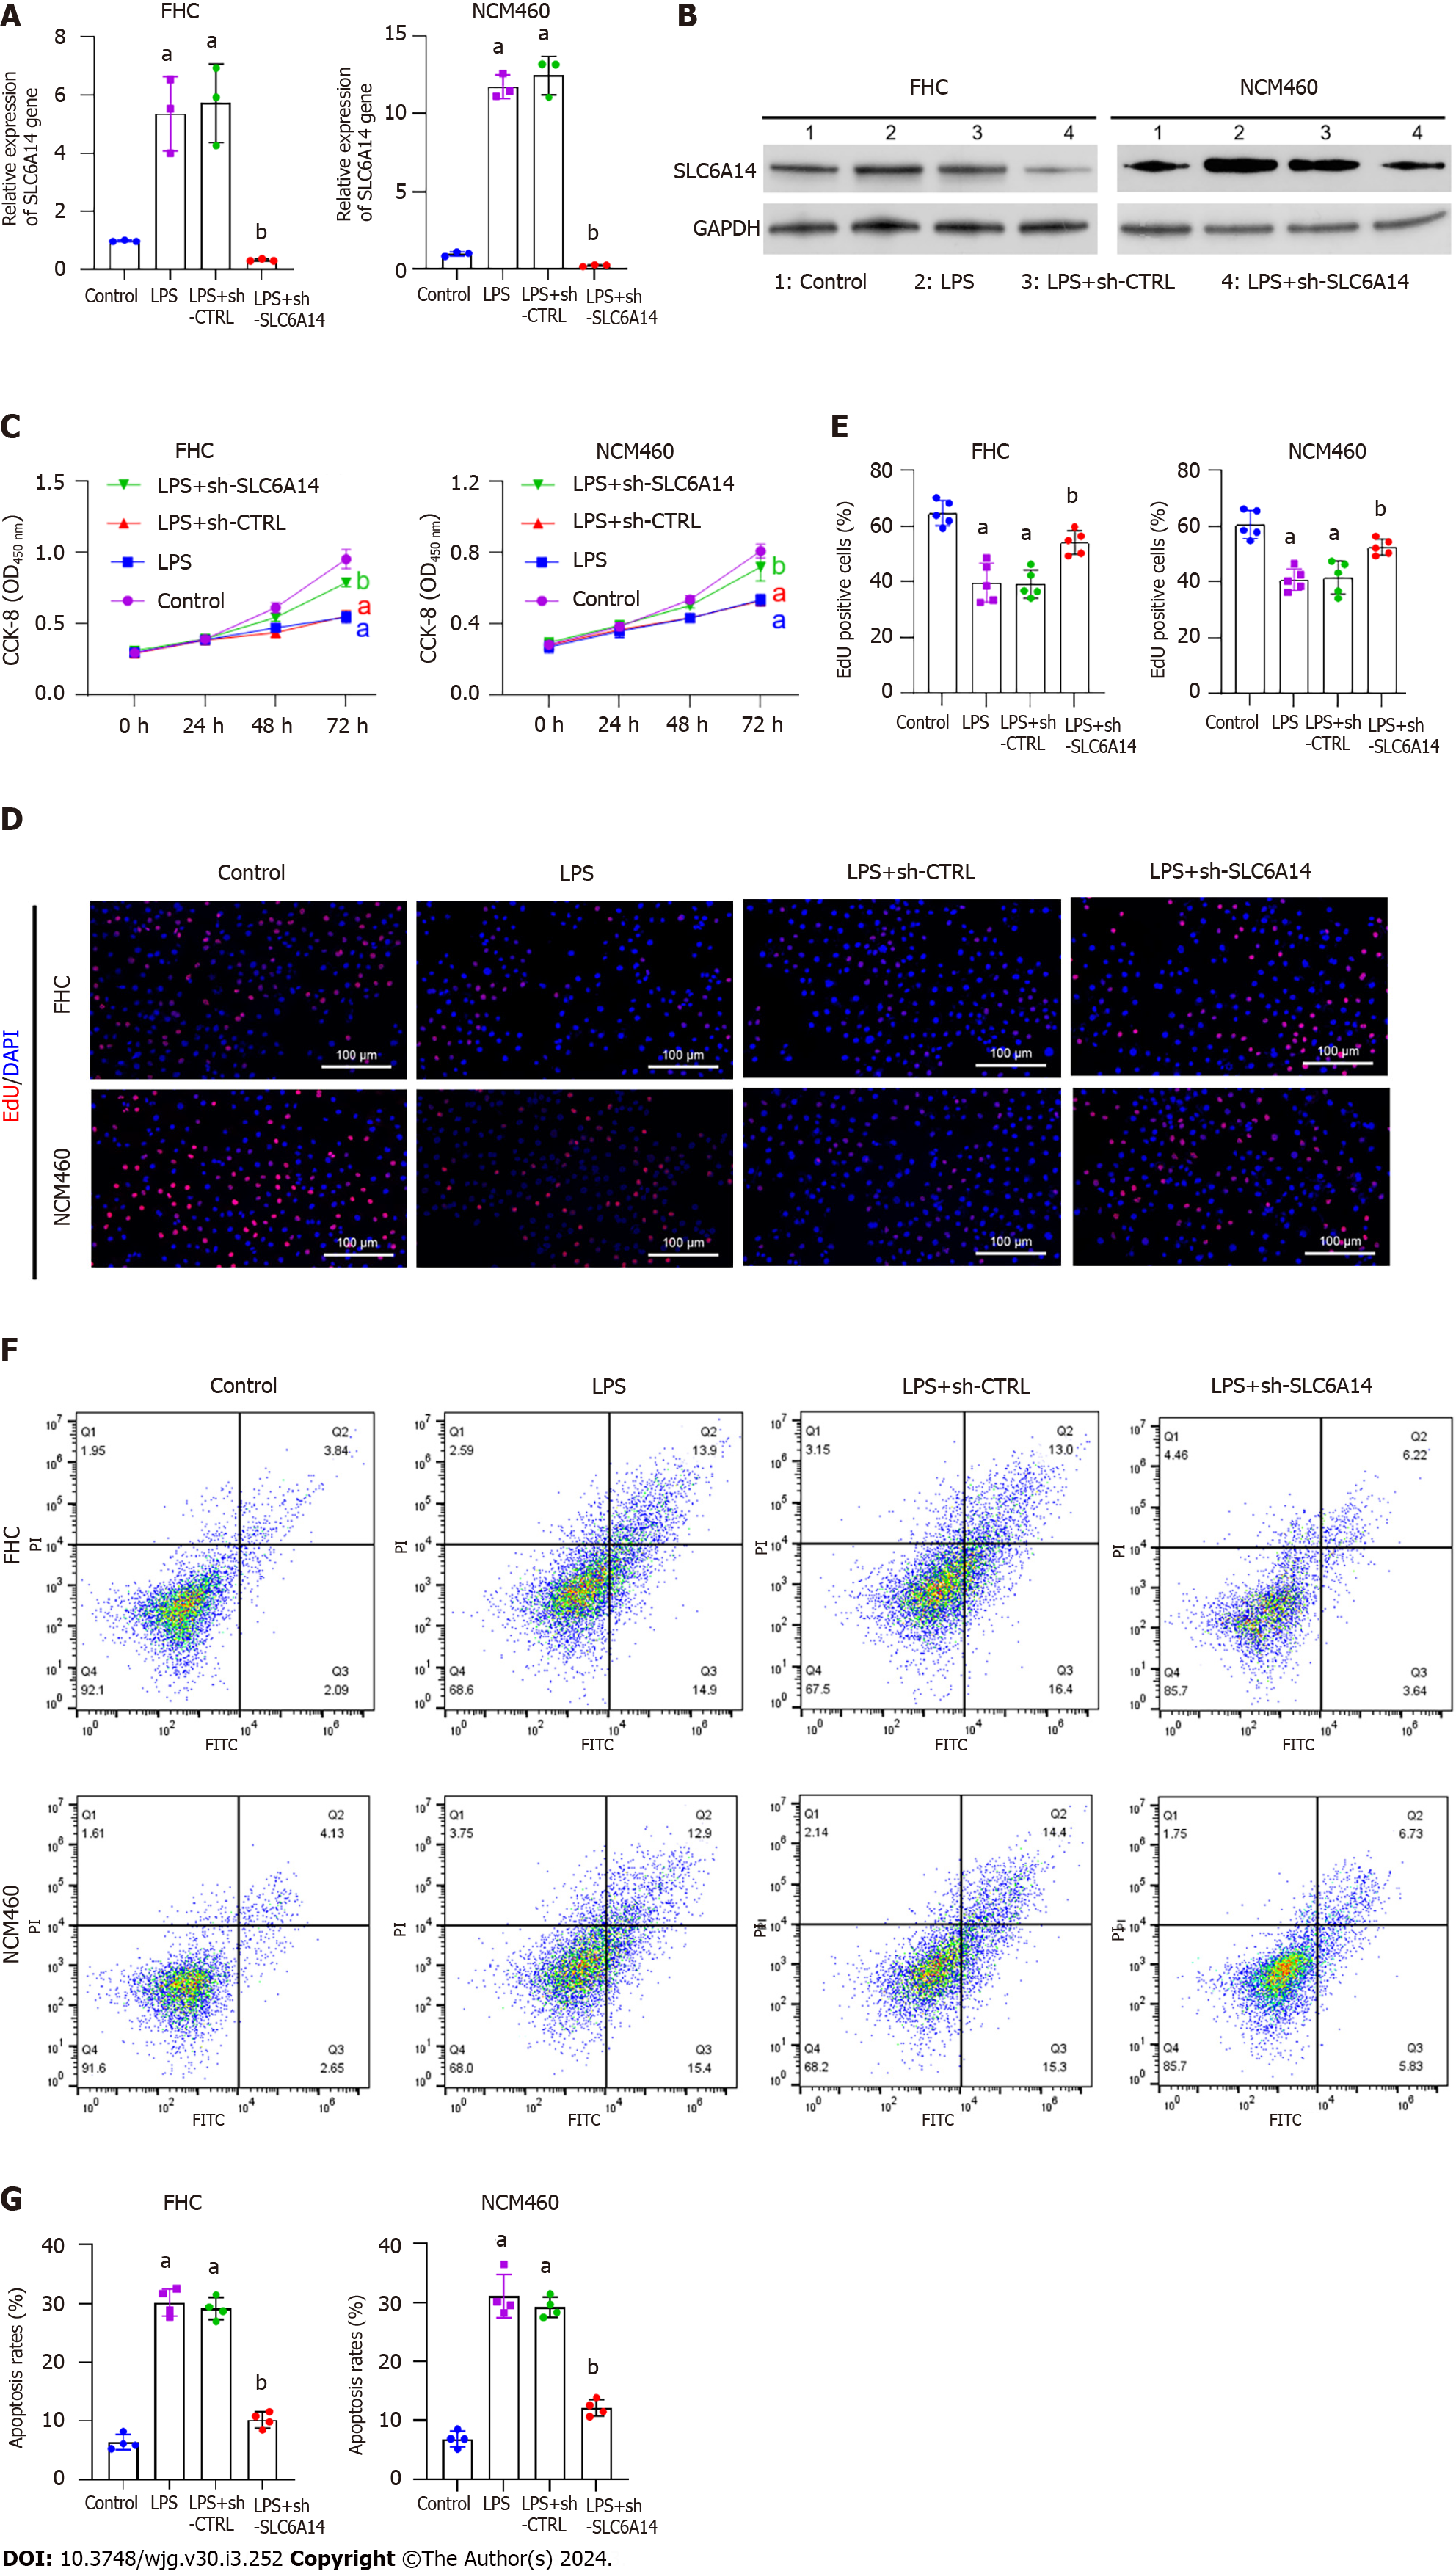
Figure 3 Downregulating SLC6A14 promotes proliferation and inhibits apoptosis in lipopolysaccharide-treated intestinal epithelial cells.
A and B: The expression of SLC6A14 in lipopolysaccharide (LPS)-, LPS+shCTRL-, and LPS+sh-SLC6A14-treated FHC and NCM460 cells was assessed by quantitative real-time polymerase chain reaction (A) and Western blotting (B); C: Cell viability was determined by CCK-8 assays; D and E: An EdU assay was used to detect cell proliferation, and the scale bar represents 100 μm; F and G: Flow cytometry showing apoptosis in FHC and NCM460 cells, followed by quantitative analyses. aP < 0.01 vs controls; bP < 0.01 vs LPS+sh-CTRL. LPS: Lipopolysaccharide.
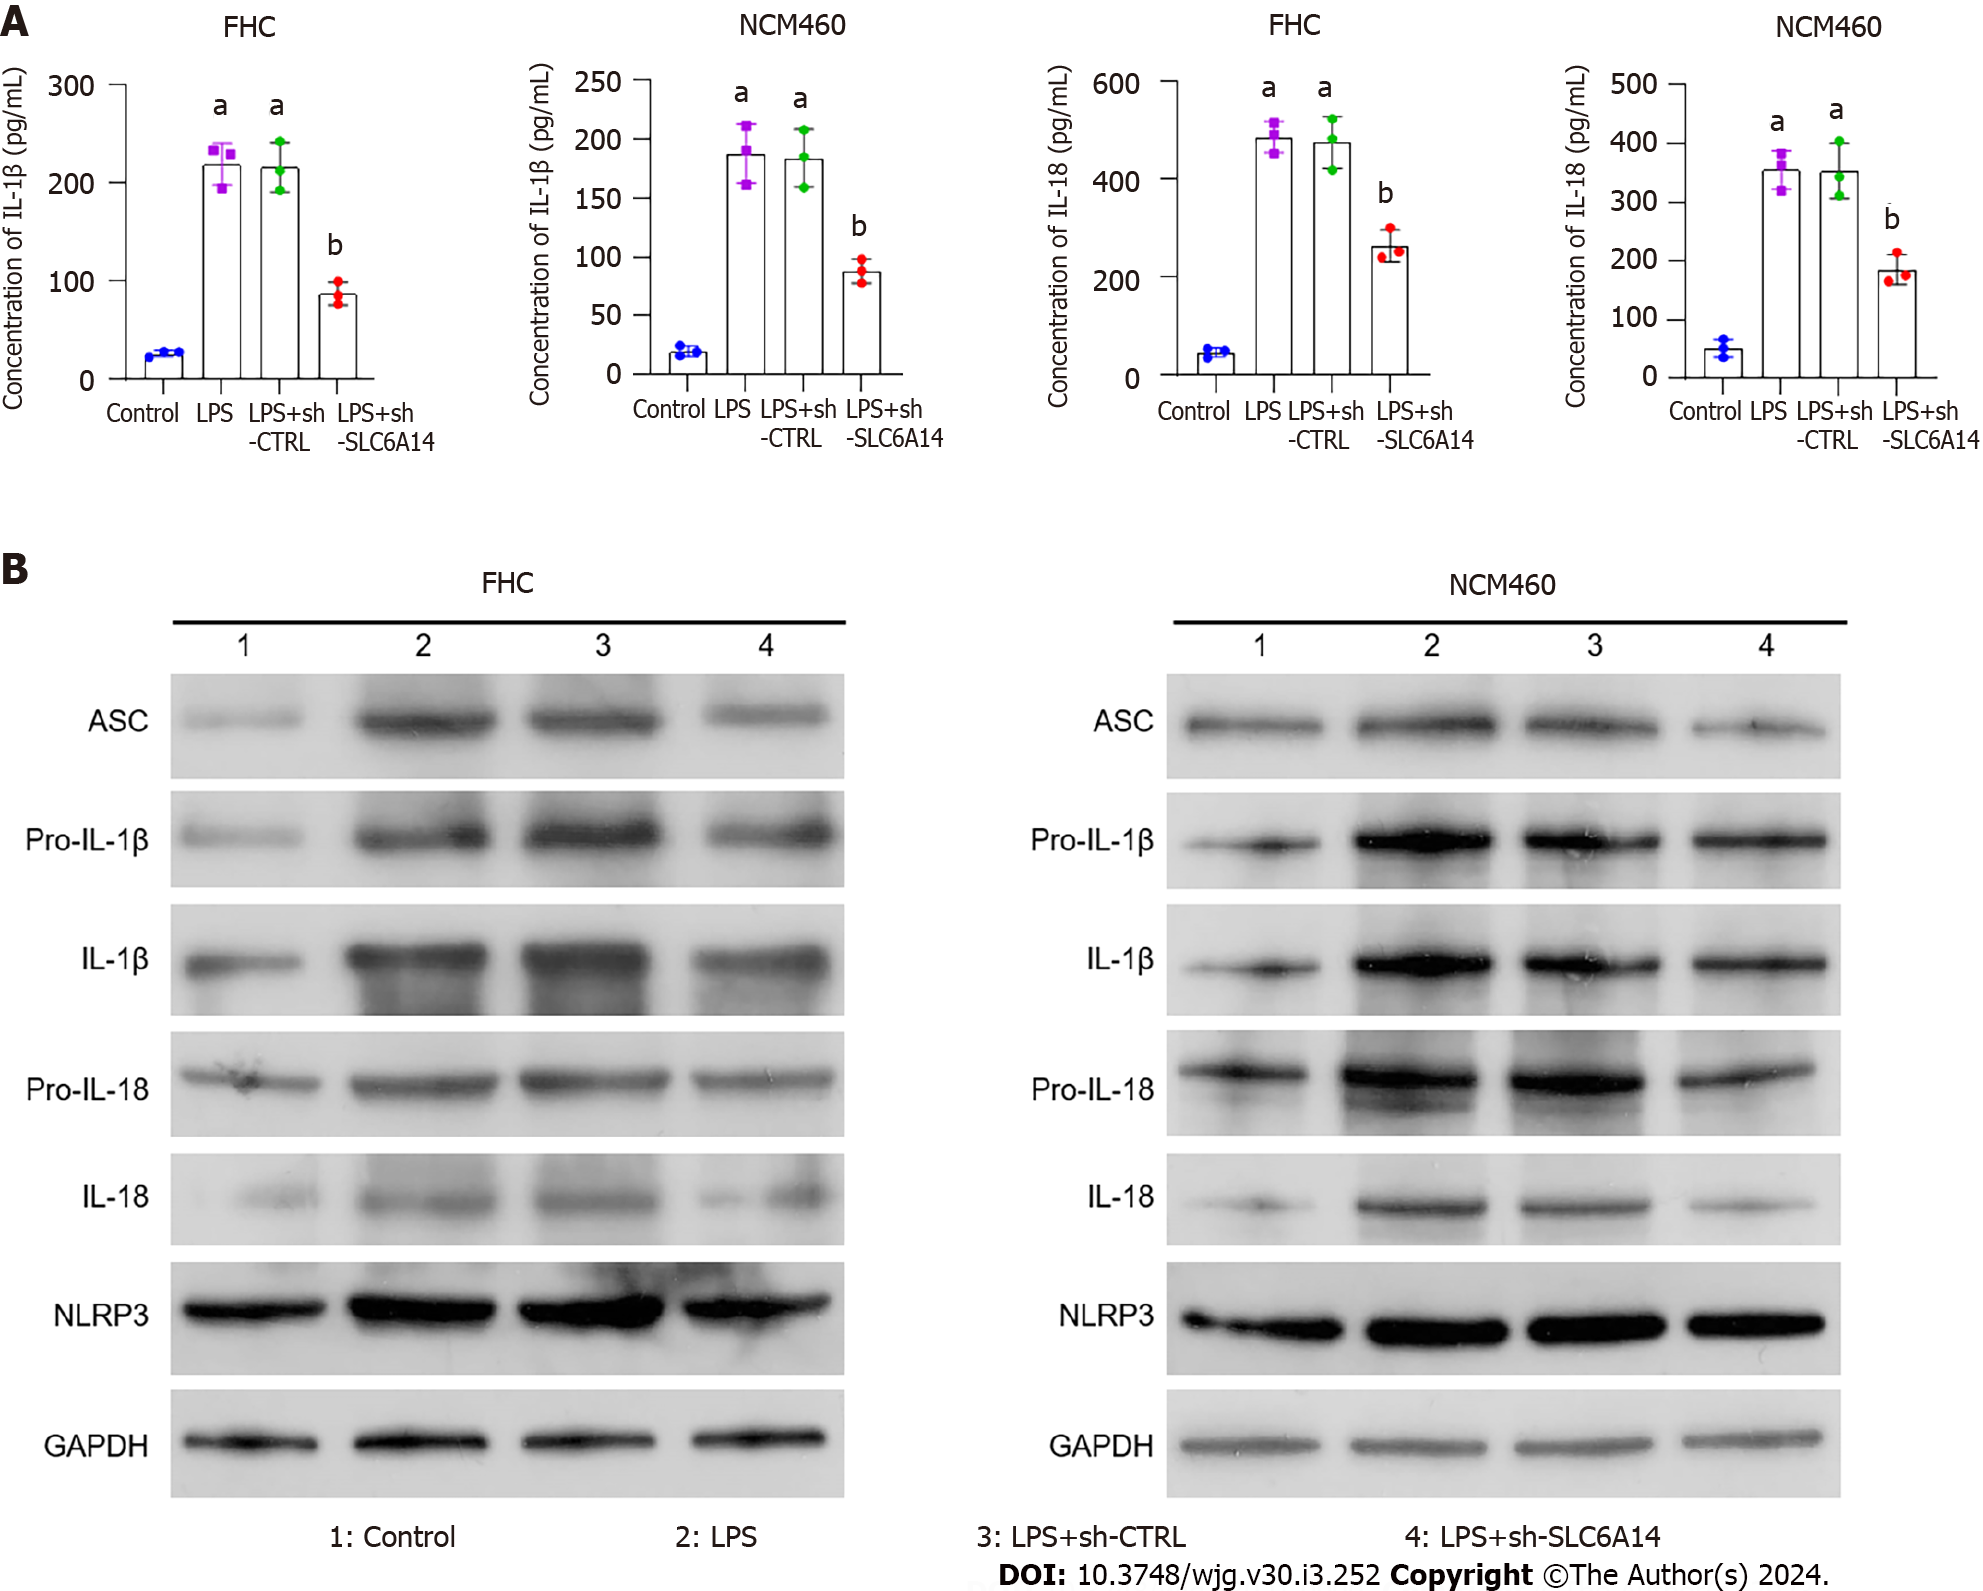
Figure 4 SLC6A14 enhances lipopolysaccharide-induced inflammatory cytokine secretion.
A: Enzyme-linked immunosorbent assay analysis of IL-1β and IL-18; B: Western analysis of the levels of pyroptosis-associated proteins. The data are means ± SD (n = 5). aP < 0.01 vs controls; bP < 0.01 vs LPS+sh-CTRL. LPS: Lipopolysaccharide.
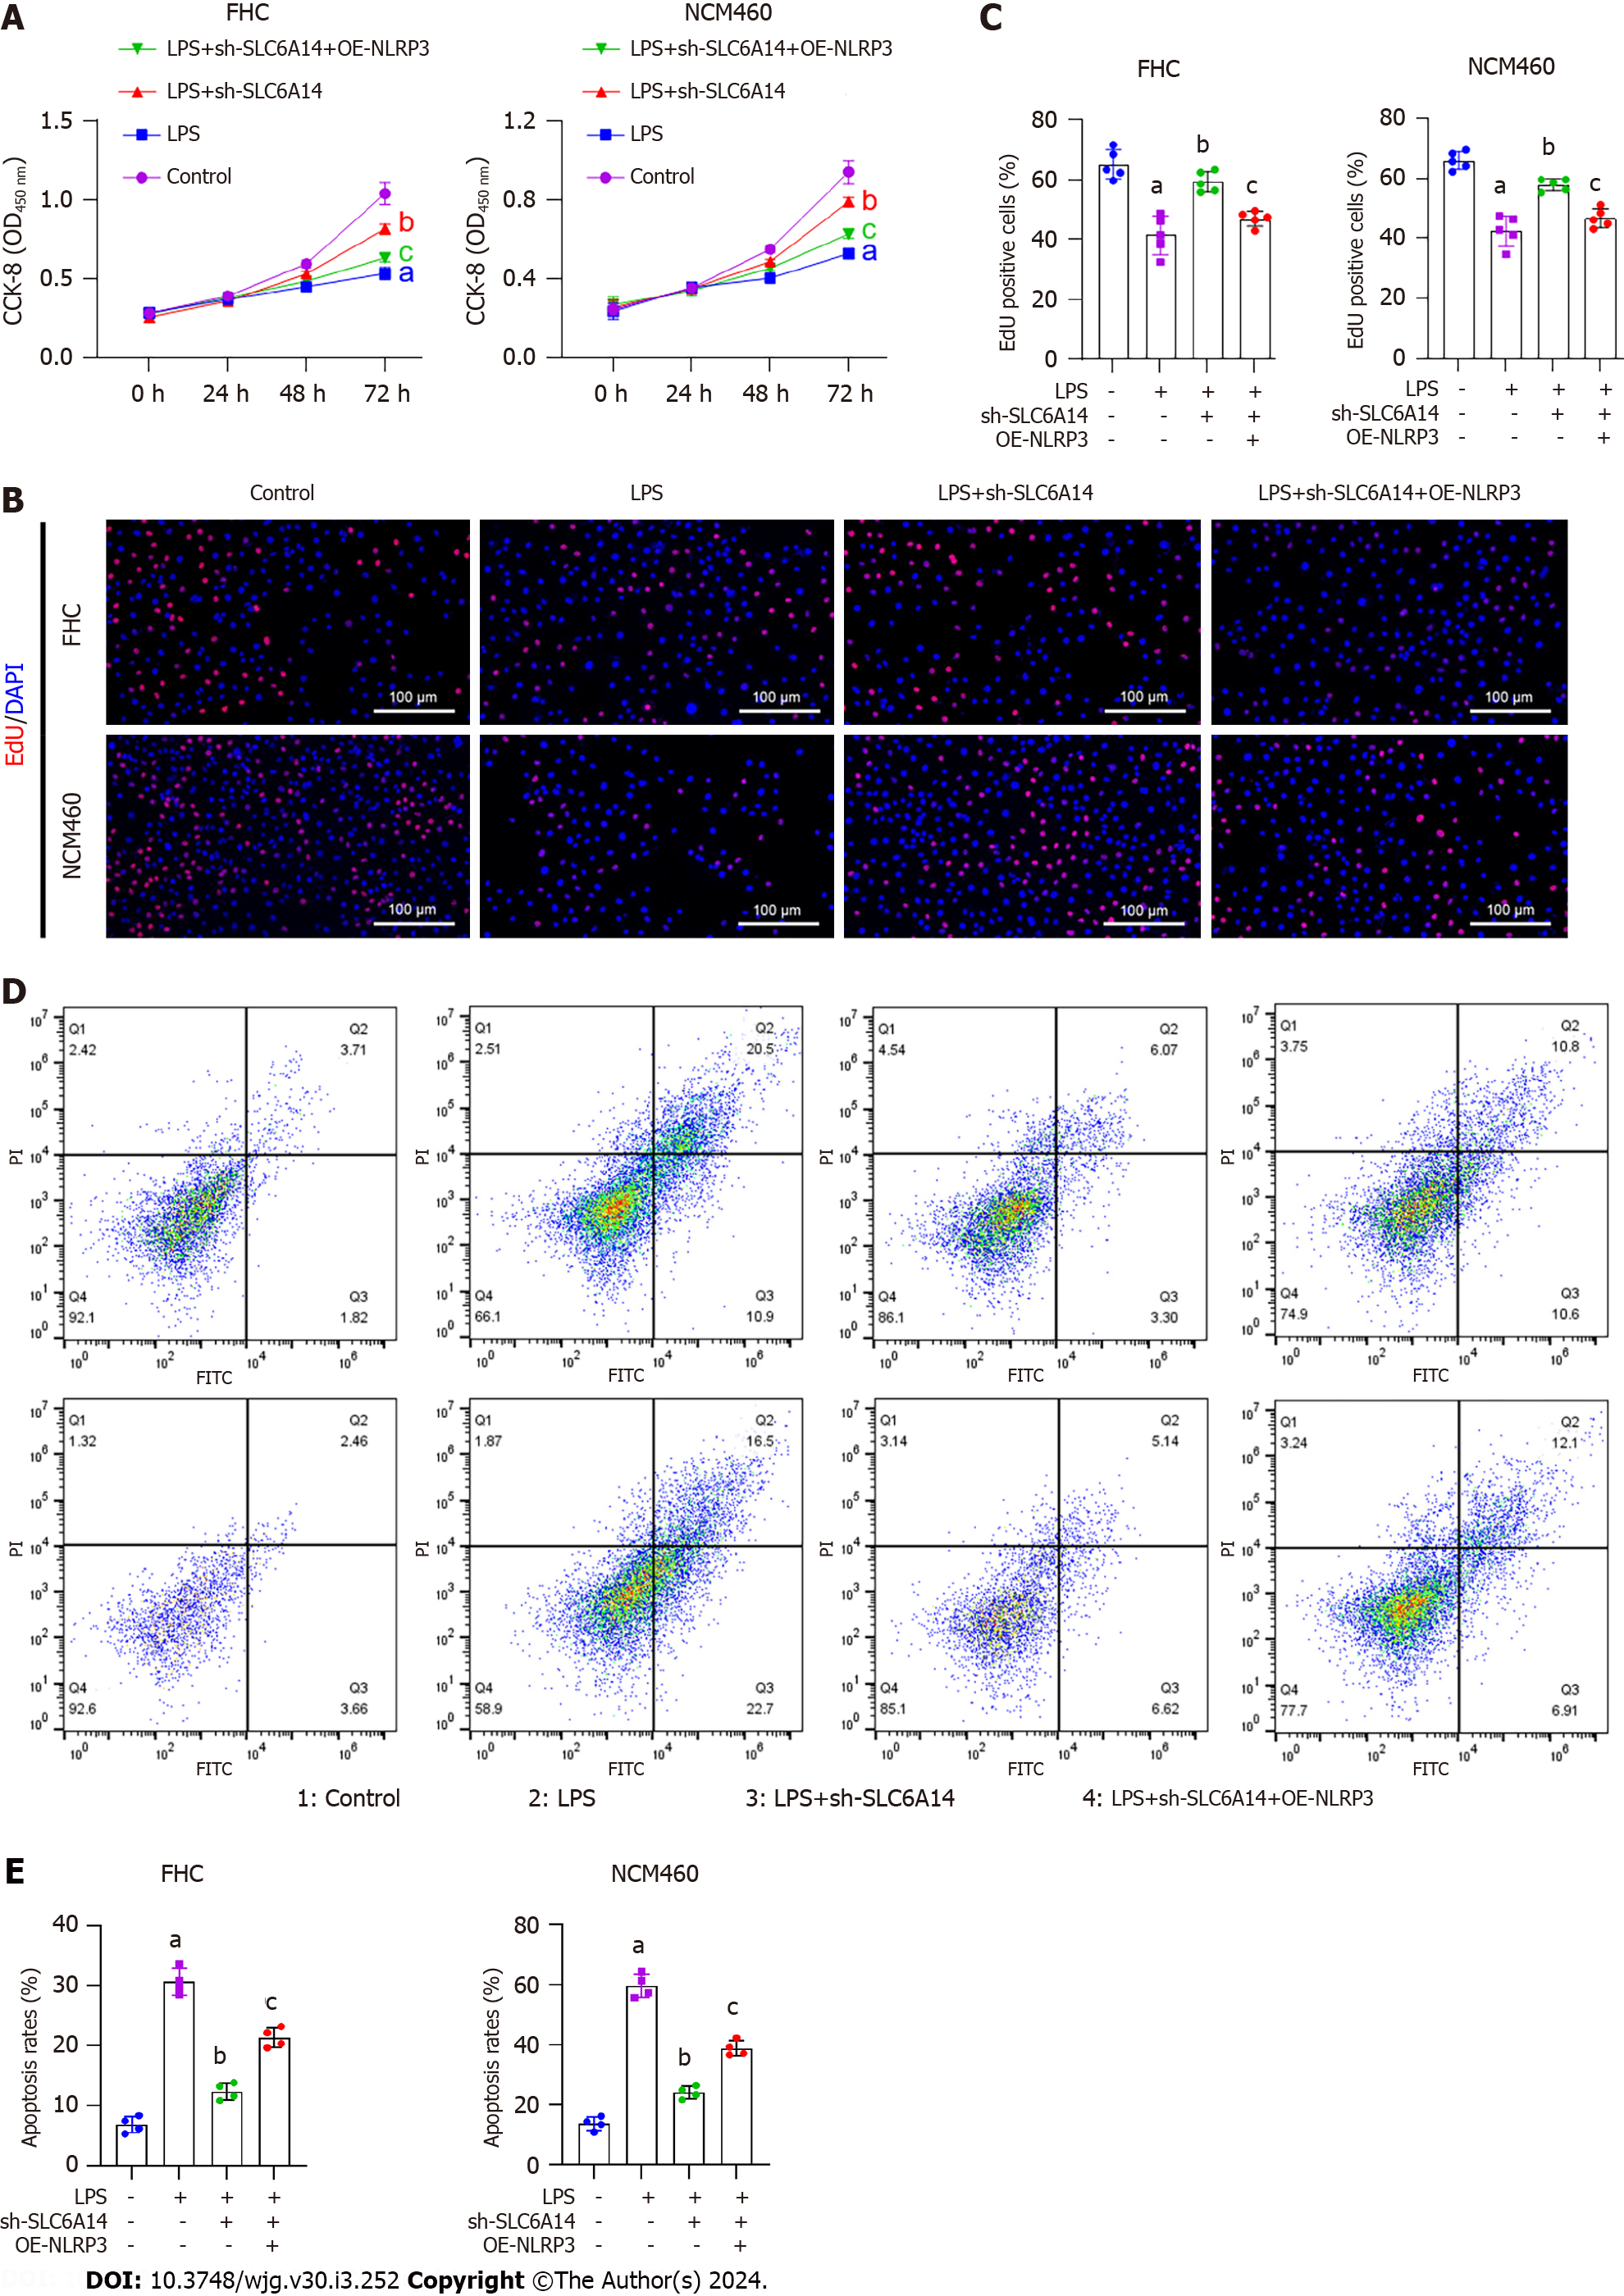
Figure 5 NLRP3 overexpression reverses the suppressive effect of SLC6A14 knockdown on lipopolysaccharide-induced FHC cell pyroptosis.
A: CCK-8 assays were performed to determine whether NLRP3 overexpression counteracted the inhibitory effect of SLC6A14 knockdown on lipopolysaccharide (LPS)-induced intestinal epithelial cell (IEC) proliferation; B and C: EdU staining was performed to assess whether NLRP3 overexpression could reverse SLC6A14-mediated promotion of proliferation in LPS-stimulated epithelial cell models; D: Flow cytometry was used to investigate whether NLRP3 overexpression could reverse the proapoptotic effects of SLC6A14 silencing on LPS-treated IECs; E: Quantification of apoptosis. aP < 0.01 vs controls; bP < 0.01 vs LPS; cP < 0.01 vs LPS+sh-SLC6A14. LPS: Lipopolysaccharide; OE: Overexpression.
Figure 6 NLRP3 overexpression reverses the inhibitory effect of SLC6A14 knockdown on lipopolysaccharide-induced FHC cell pyroptosis.
A: Effects of NLRP3 overexpression on IL-1β and IL-18 production facilitated by SLC6A14 in lipopolysaccharide (LPS)-treated intestinal epithelial cells (IECs), as shown by enzyme-linked immunosorbent assay; B: Western analysis of the effects of NLRP3 overexpression on pyroptosis-associated protein levels mediated by SLC6A14 in IECs after LPS treatment. aP < 0.01 vs controls; bP < 0.01 vs LPS; cP < 0.01 vs LPS+sh-SLC6A14. LPS: Lipopolysaccharide; OE: Overexpression.
Figure 7 SLC6A14 reduces pyroptosis induced by NLRP3 activation in ulcerative colitis mouse models.
A: Measurement of colon length; B: Assessment of body weight changes; C: Disease-activity index; D: Histology (magnification 200 ×, scale bar = 100 μm); E and F: Western blot analysis of SLC6A14; G: Effects of SLC6A14 on IL-1β and IL-18 production in the ulcerative colitis mouse model, as measured by enzyme-linked immunosorbent assay; H: Western blot analysis of the levels of pyroptosis-associated proteins. The data are means ± SD. aP < 0.01 vs controls, bP < 0.01 vs DSS+LV-sh-CTRL. DSS: Dextran sulfate sodium.
- Citation: Gu Q, Xia H, Song YQ, Duan J, Chen Y, Zhang Y, Chen HP, Zhang L. SLC6A14 promotes ulcerative colitis progression by facilitating NLRP3 inflammasome-mediated pyroptosis. World J Gastroenterol 2024; 30(3): 252-267
- URL: https://www.wjgnet.com/1007-9327/full/v30/i3/252.htm
- DOI: https://dx.doi.org/10.3748/wjg.v30.i3.252


