Copyright
©The Author(s) 2024.
World J Gastroenterol. Aug 7, 2024; 30(29): 3488-3510
Published online Aug 7, 2024. doi: 10.3748/wjg.v30.i29.3488
Published online Aug 7, 2024. doi: 10.3748/wjg.v30.i29.3488
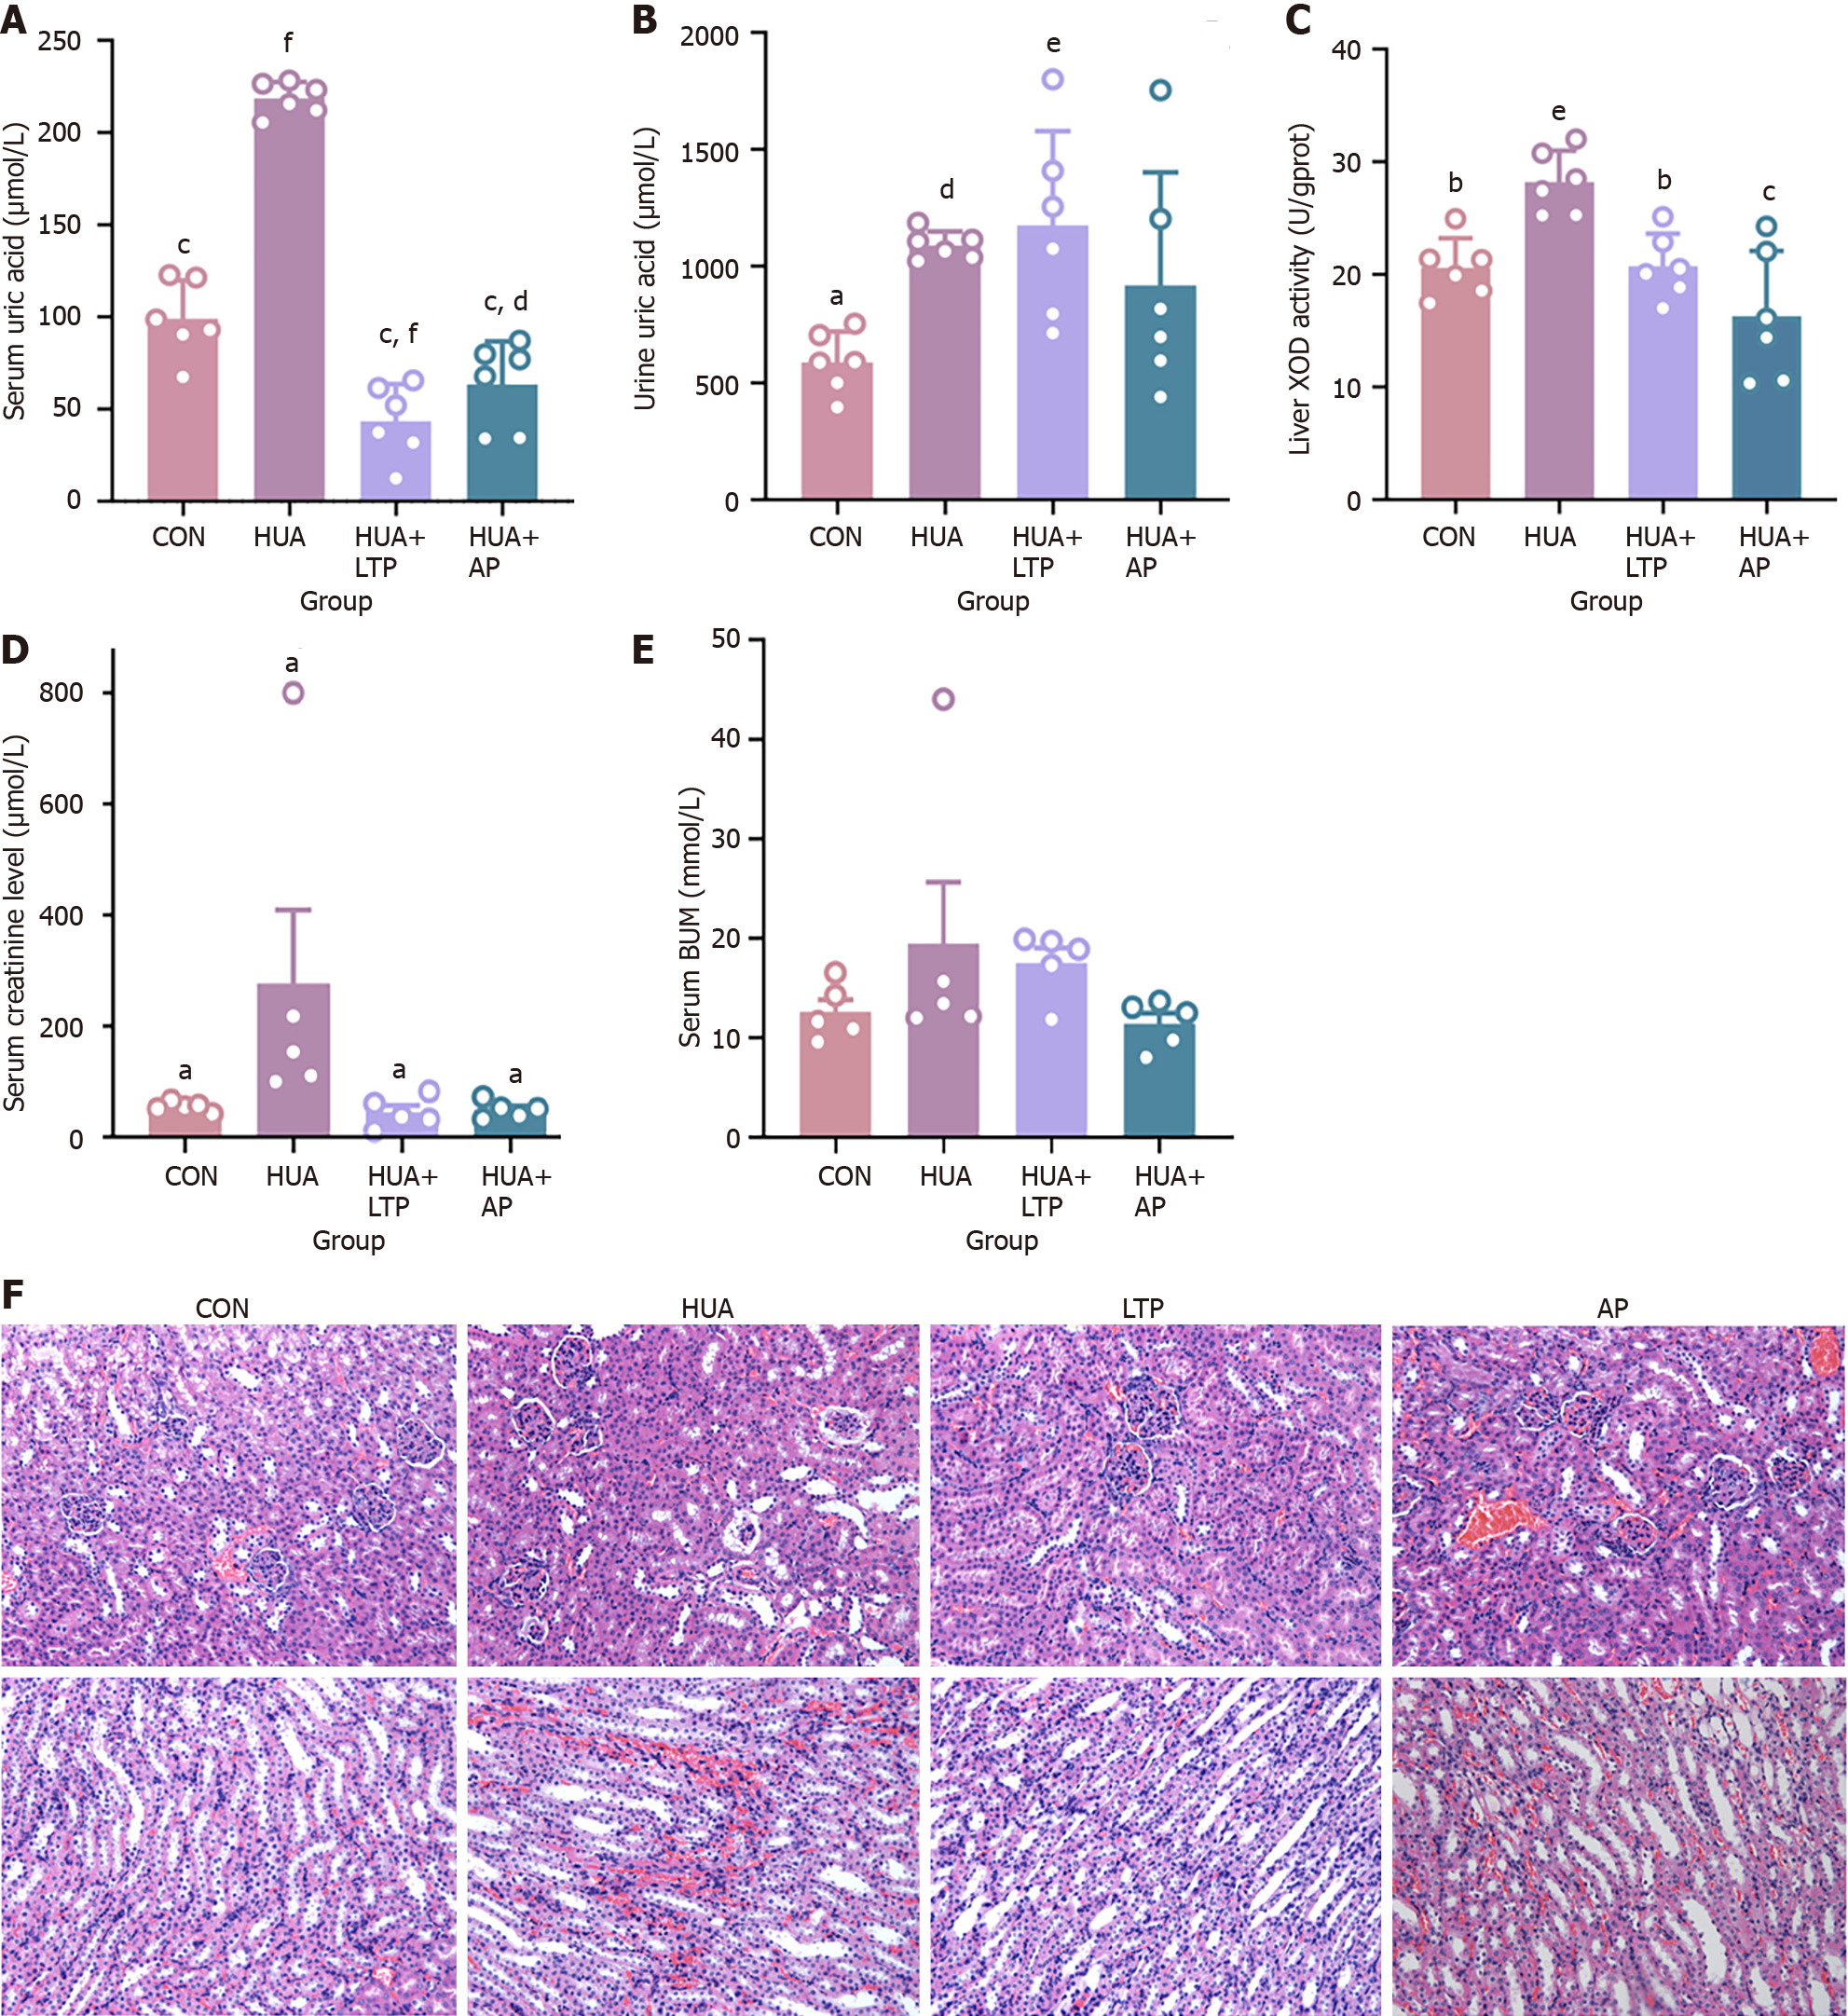
Figure 1 Effect of leech Poecilobdella manillensis total protein extract treatment on hyperuricemia.
A: Serum uric acid levels; B: Urine uric acid levels; C: Liver xanthine oxidase activity; D: Serum creatinine levels; E: Blood urea nitrogen levels; F: Renal tissue hematoxylin and eosin staining pathology under 200 × magnification. Statistical significance determined by ANOVA is indicated as follows: aP < 0.05 vs hyperuricemia model group (HUA); bP < 0.01 vs HUA; cP < 0.001 vs HUA; dP < 0.05 vs normal control group (CON); eP < 0.01 vs CON; fP < 0.001 vs CON. CON: Normal control group; HUA: Hyperuricemia model group; AP: Allopurinol treatment group; LTP: Leech Poecilobdella manillensis total protein extract treatment group; XOD: Xanthine oxidase; BUN: Blood urea nitrogen.
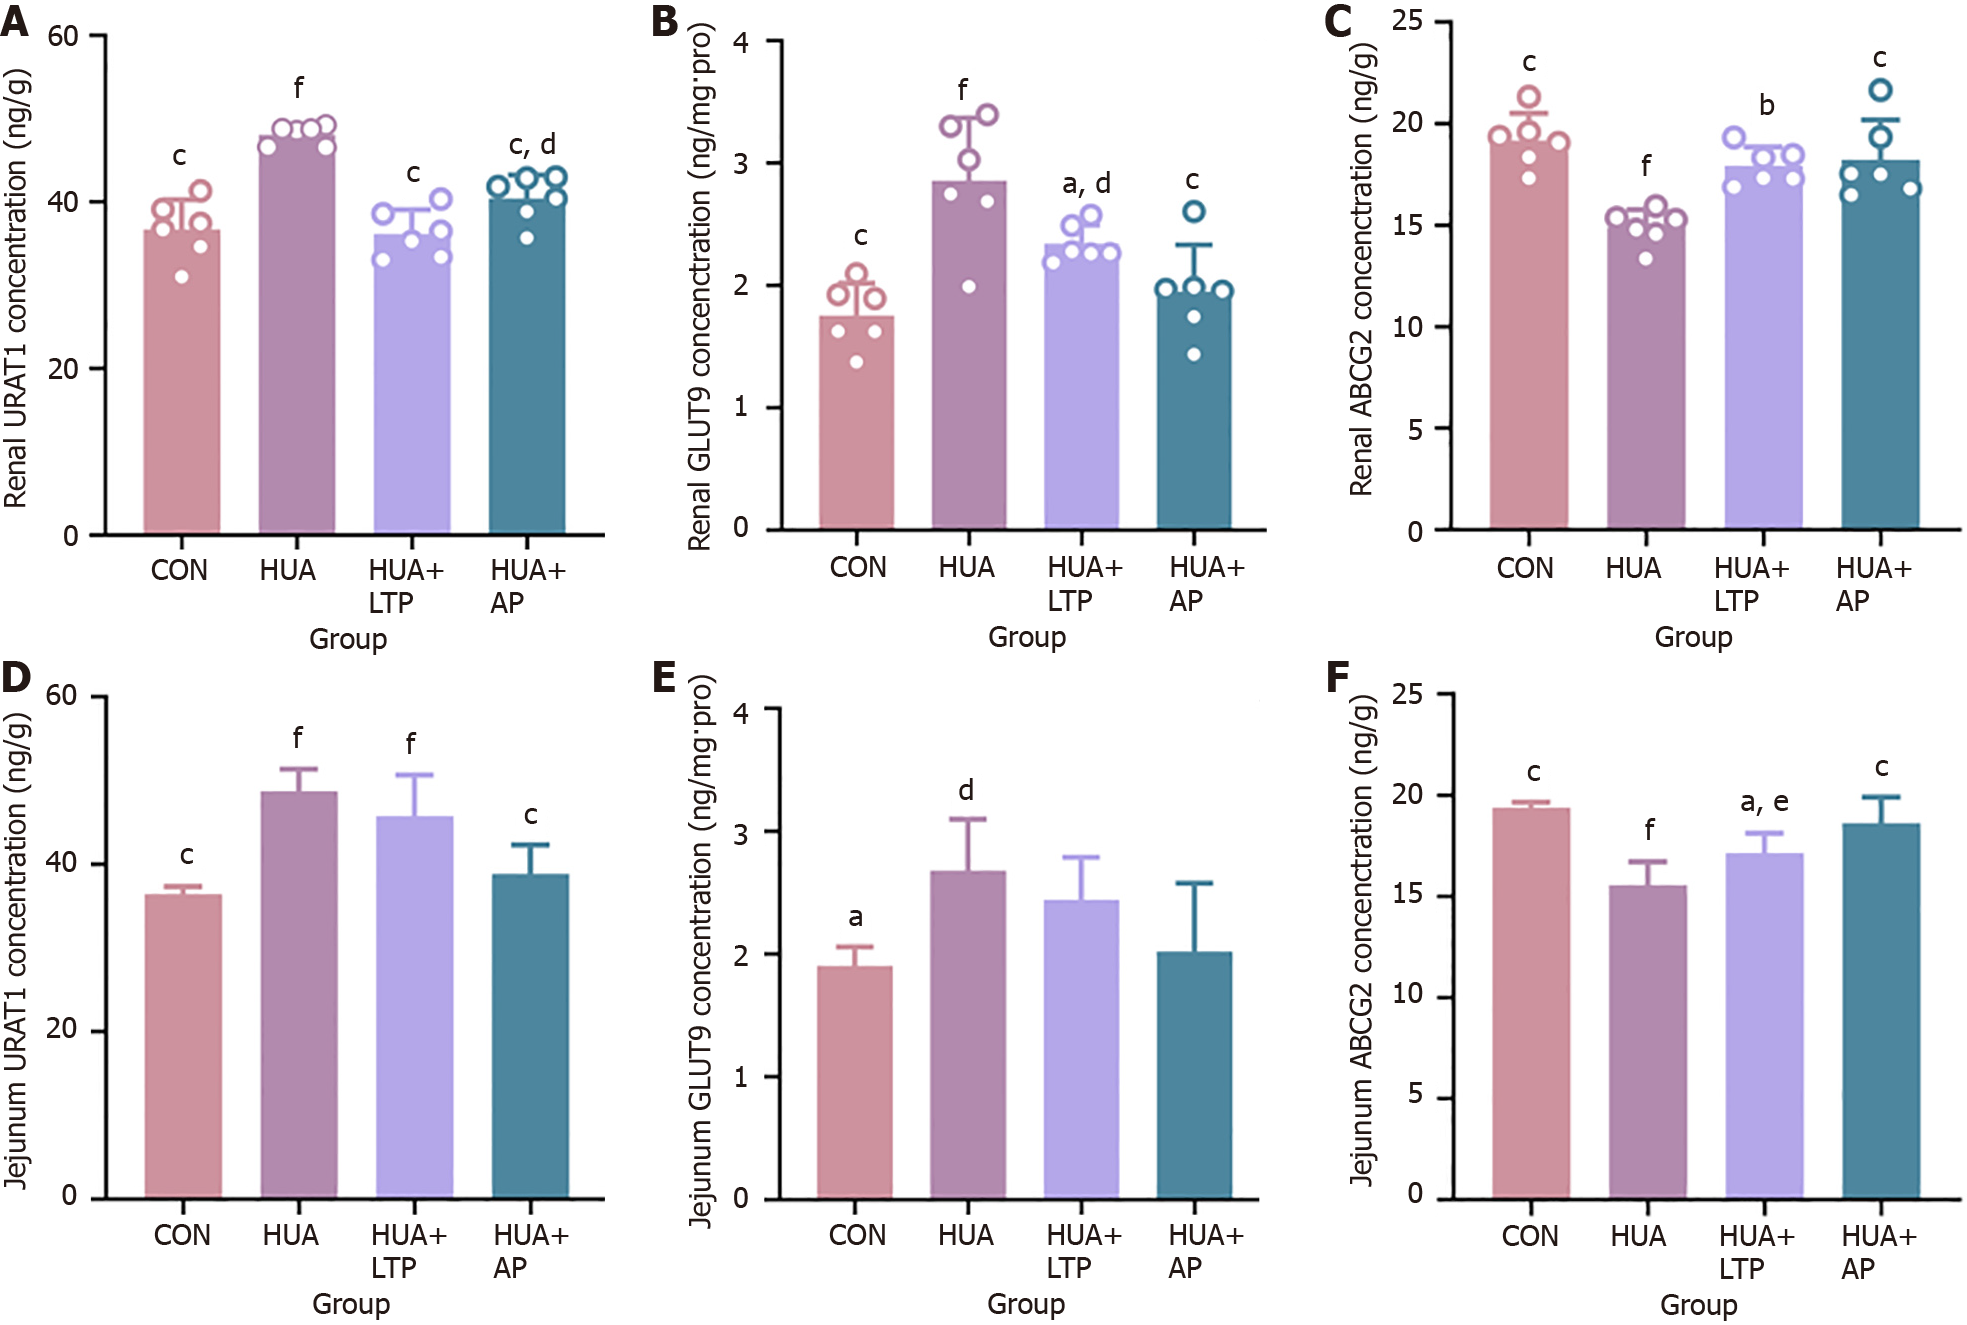
Figure 2 Effect of leech Poecilobdella manillensis total protein extract on facilitating uric acid excretion, evaluated by enzyme-linked immunosorbent assay.
A: Renal urate transporter 1 (URAT1) concentration level; B: Renal glucose transporter 9 (GLUT9) concentration level; C: Renal ATP-binding cassette transporter G2 (ABCG2) concentration level; D: Jejunum URAT1 concentration level; E: Jejunum GLUT9 concentration level; F: Jejunum ABCG2 concentration level. Statistical significance determined by ANOVA is indicated as follows: aP < 0.05 vs hyperuricemia model group (HUA); bP < 0.01 vs HUA; cP < 0.001 vs HUA; dP < 0.05 vs normal control group (CON); eP < 0.01 vs CON; fP < 0.001 vs CON. Sample sizes: Renal tissue n = 6 for each group; Jejunum tissue n = 4 for each group. CON: Normal control group; HUA: Hyperuricemia model group; AP: Allopurinol treatment group; LTP: Leech Poecilobdella manillensis total protein extract treatment group; URAT1: Urate transporter 1; GLUT9: Glucose transporter 9; ABCG2: ATP-binding cassette transporter G2.
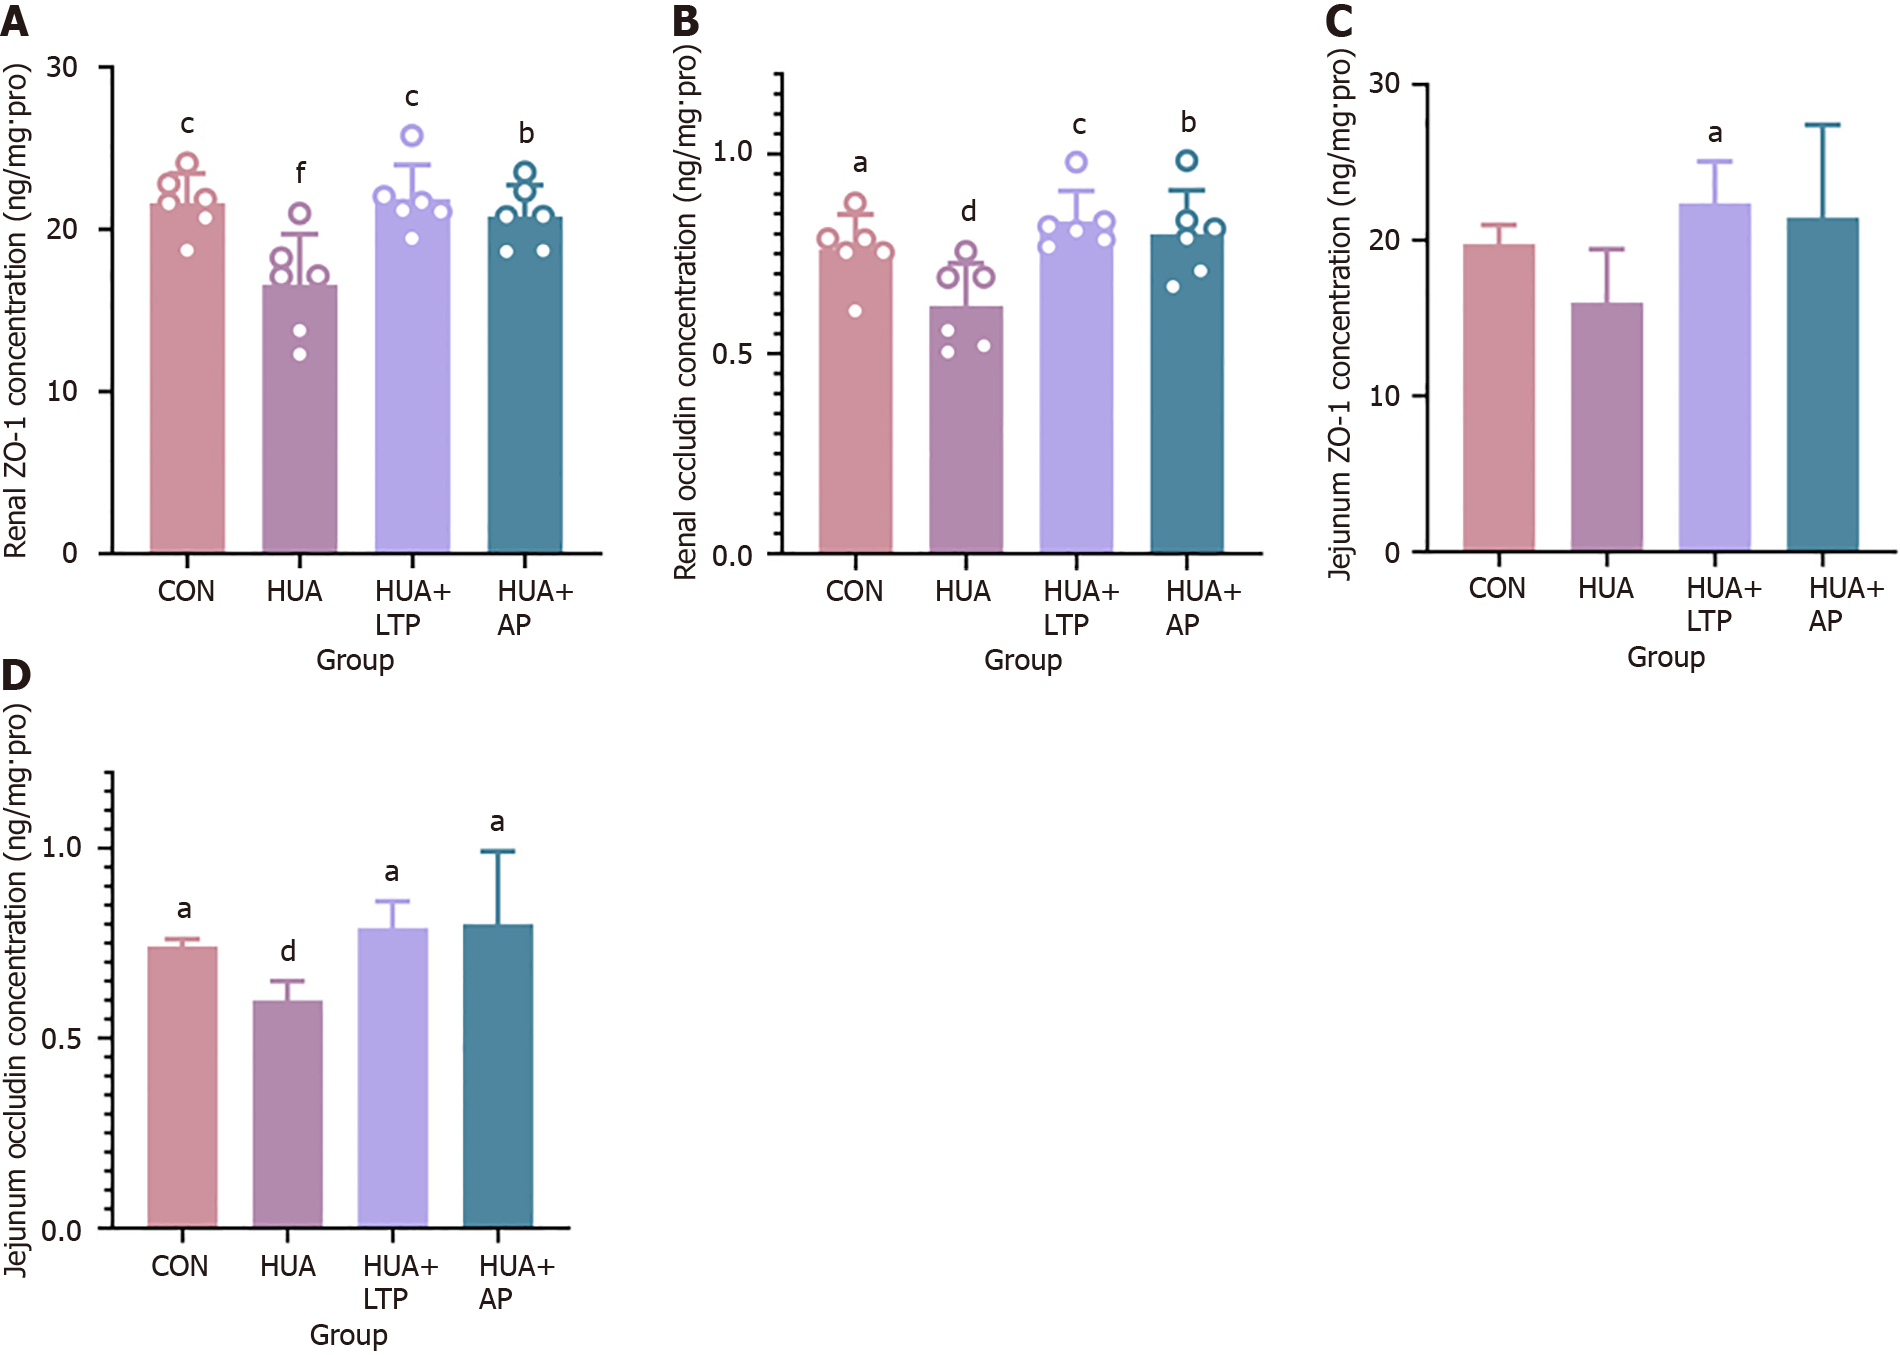
Figure 3 Effect of leech Poecilobdella manillensis total protein extract on epithelial tight junction proteins, evaluated by enzyme-linked immunosorbent assay.
A: Renal zonula occludens-1 (ZO-1) concentration level; B: Renal occludin concentration level; C: Jejunum ZO-1 concentration level; D: Jejunum occludin concentration level. Statistical significance determined by ANOVA is indicated as follows: aP < 0.05 vs hyperuricemia model group (HUA); bP < 0.01 vs HUA; cP < 0.001 vs HUA; dP < 0.05 vs normal control group (CON); fP < 0.001 vs CON. Sample sizes: Renal tissue n = 6 for each group; Jejunum tissue n = 4 for each group. CON: Normal control group; HUA: Hyperuricemia model group; AP: Allopurinol treatment group; LTP: Leech Poecilobdella manillensis total protein extract treatment group; ZO-1: Zonula occludens-1.
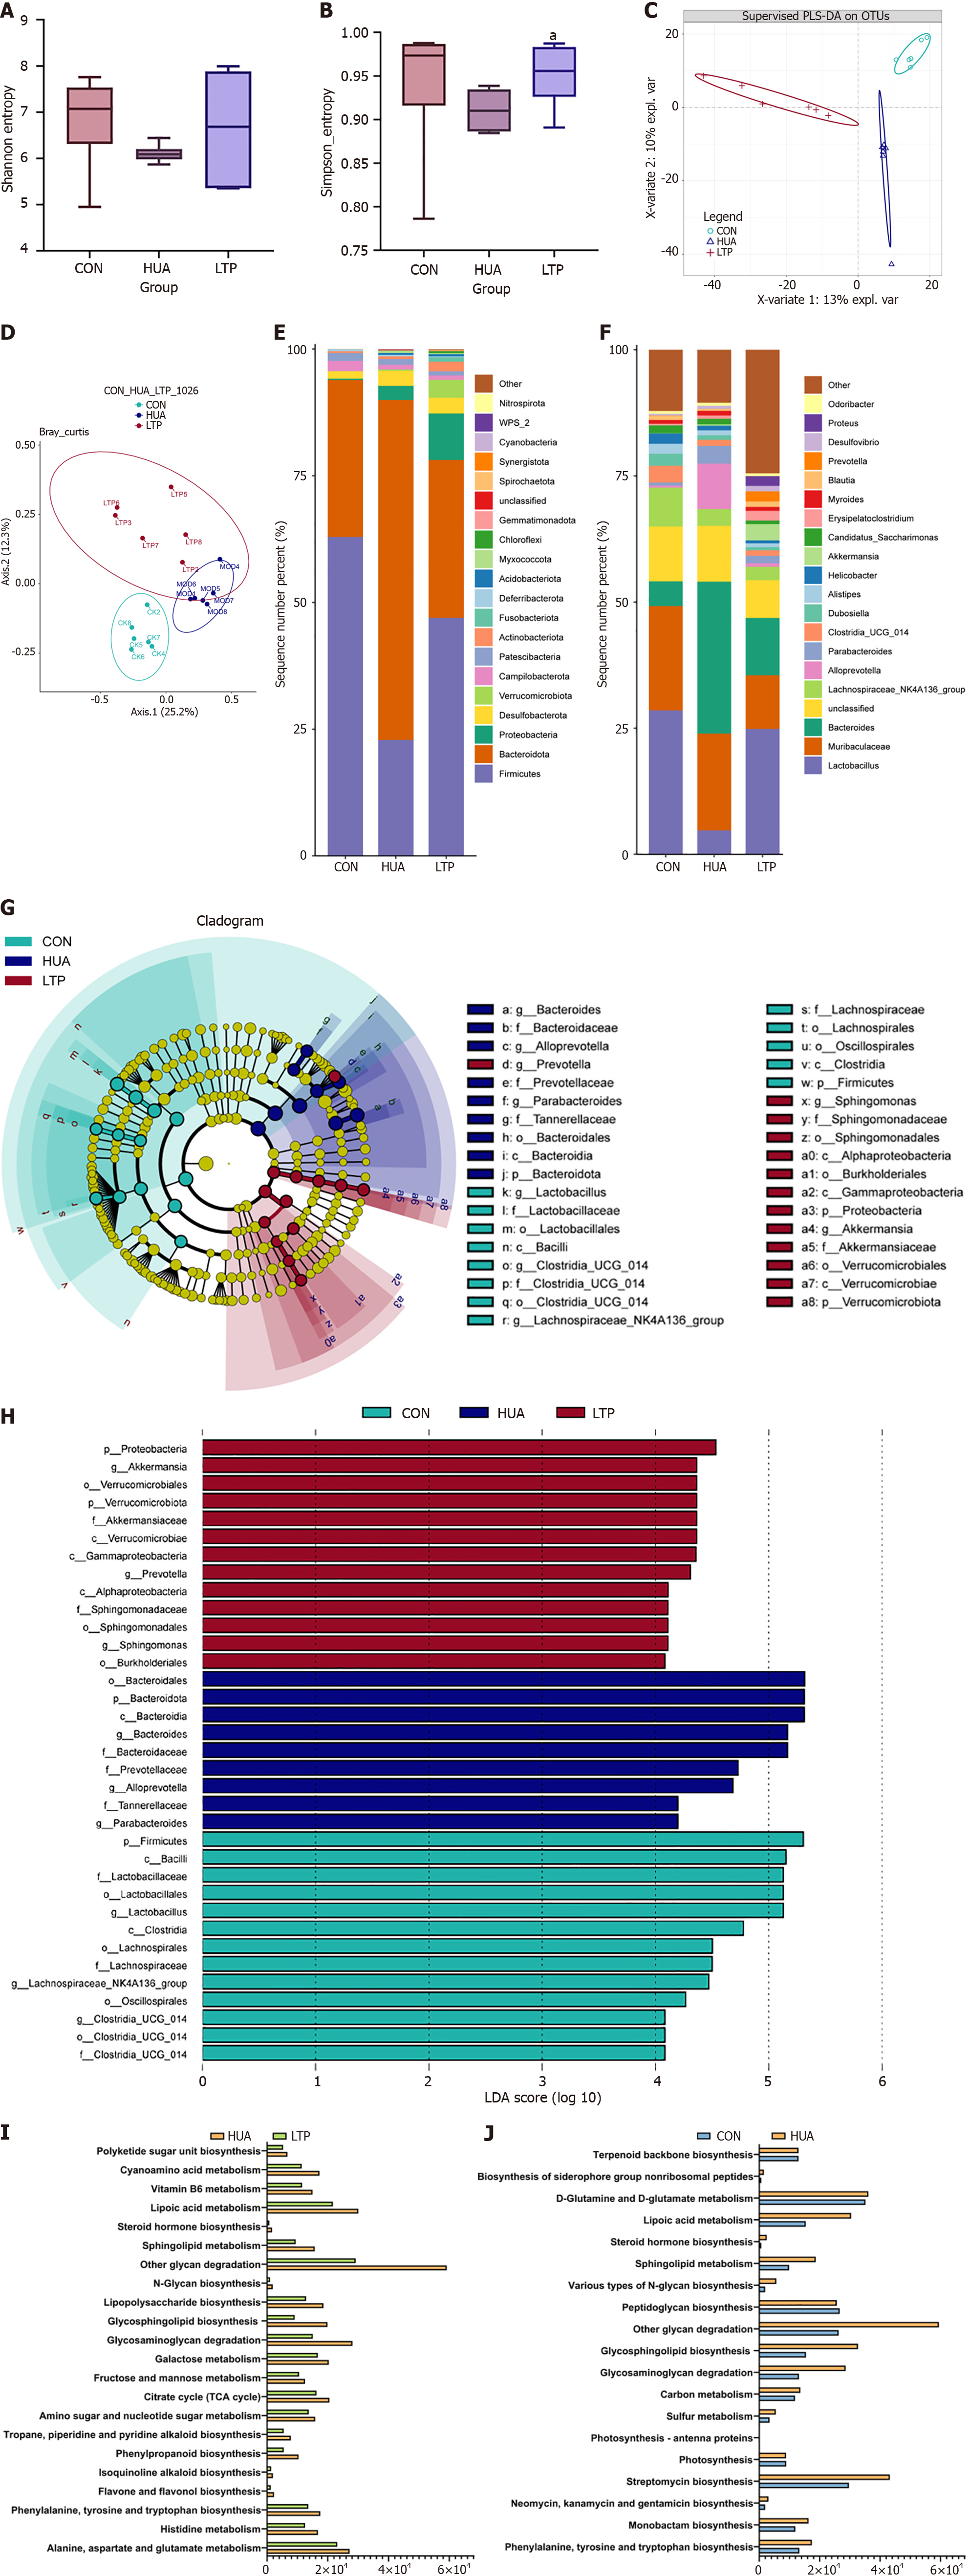
Figure 4 Leech Poecilobdella manillensis total protein extract alters the gut microbiota in potassium oxonate-induced hyperuricemia mice.
A: Shannon index across three groups; B: Simpson index across three groups; C: Partial least squares discriminant analysis of three groups; D: Principal coordinate analysis of three groups; E: Distribution plot of relative abundance at the phylum level of bacteria; F: Distribution plot of relative abundance at the genus level of bacteria; G: Cladogram from linear discriminant analysis effect size (LEfSe) analysis identifying highly differentiated taxa from phylum to genus levels; H: Linear discriminant analysis graph from LefSe analysis identifying highly differentiated taxa from phylum to genus levels; I: Predicted functional pathways of gut microbiota in hyperuricemia model group (HUA) vs leech Poecilobdella manillensis total protein extract treatment group; J: Predicted functional pathways of gut microbiota in normal control group vs HUA. Statistical significance is indicated as follows: aP < 0.05 vs hyperuricemia model group. Sample size: n = 6 per group. CON: Normal control group; HUA: Hyperuricemia model group; LTP: Leech Poecilobdella manillensis total protein extract treatment group; LDA: Linear discriminant analysis.
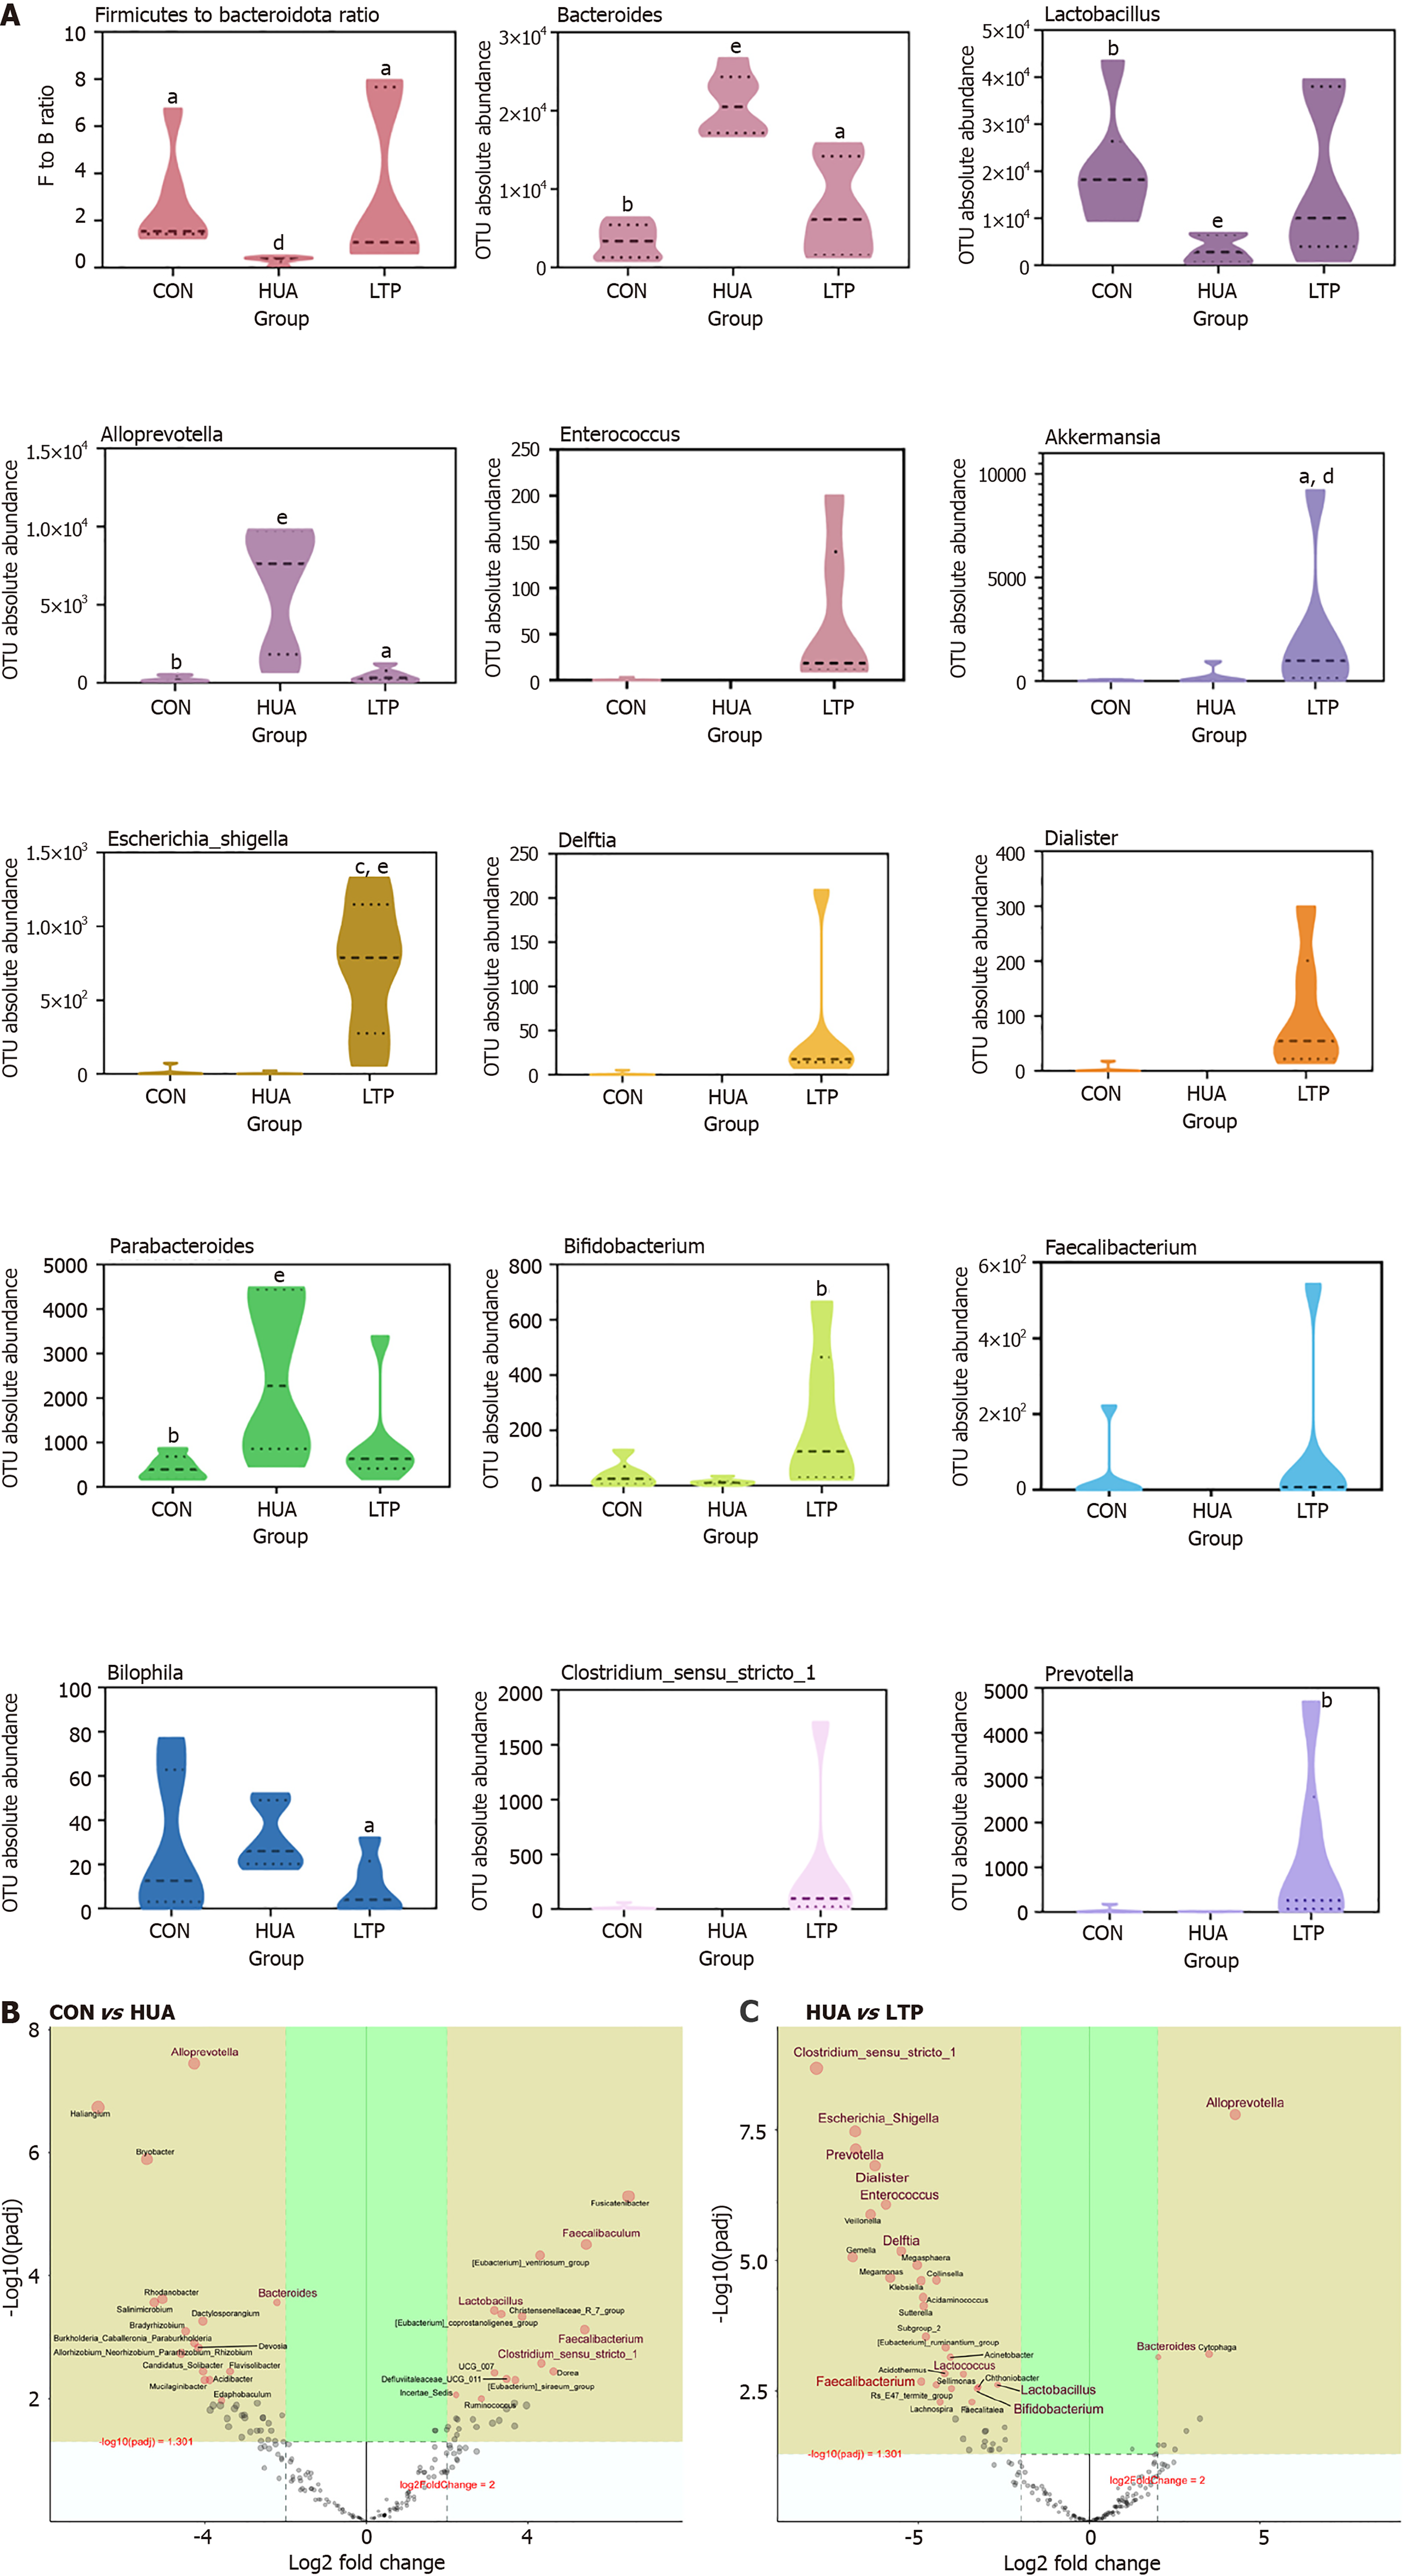
Figure 5 Effect of leech Poecilobdella manillensis total protein extract on vital microbial genus.
A: The absolute abundance of vital microbial genera in all groups, assessed through the Kruskal-Wallis ANOVA; B and C: Significant differences between each two groups at the genus level of gut microbiota, determined by DESeq2 method [B: normal control group vs hyperuricemia model group (HUA); C: HUA vs leech Poecilobdella manillensis total protein extract treatment group; n = 6 for each group]. Statistical significance is indicated as follows: aP < 0.05 vs hyperuricemia model group (HUA); bP < 0.01 vs HUA; cP < 0.001 vs HUA; dP < 0.05 vs normal control group (CON); eP < 0.01 vs CON. CON: Normal control group; HUA: Hyperuricemia model group; LTP: Leech Poecilobdella manillensis total protein extract treatment group.
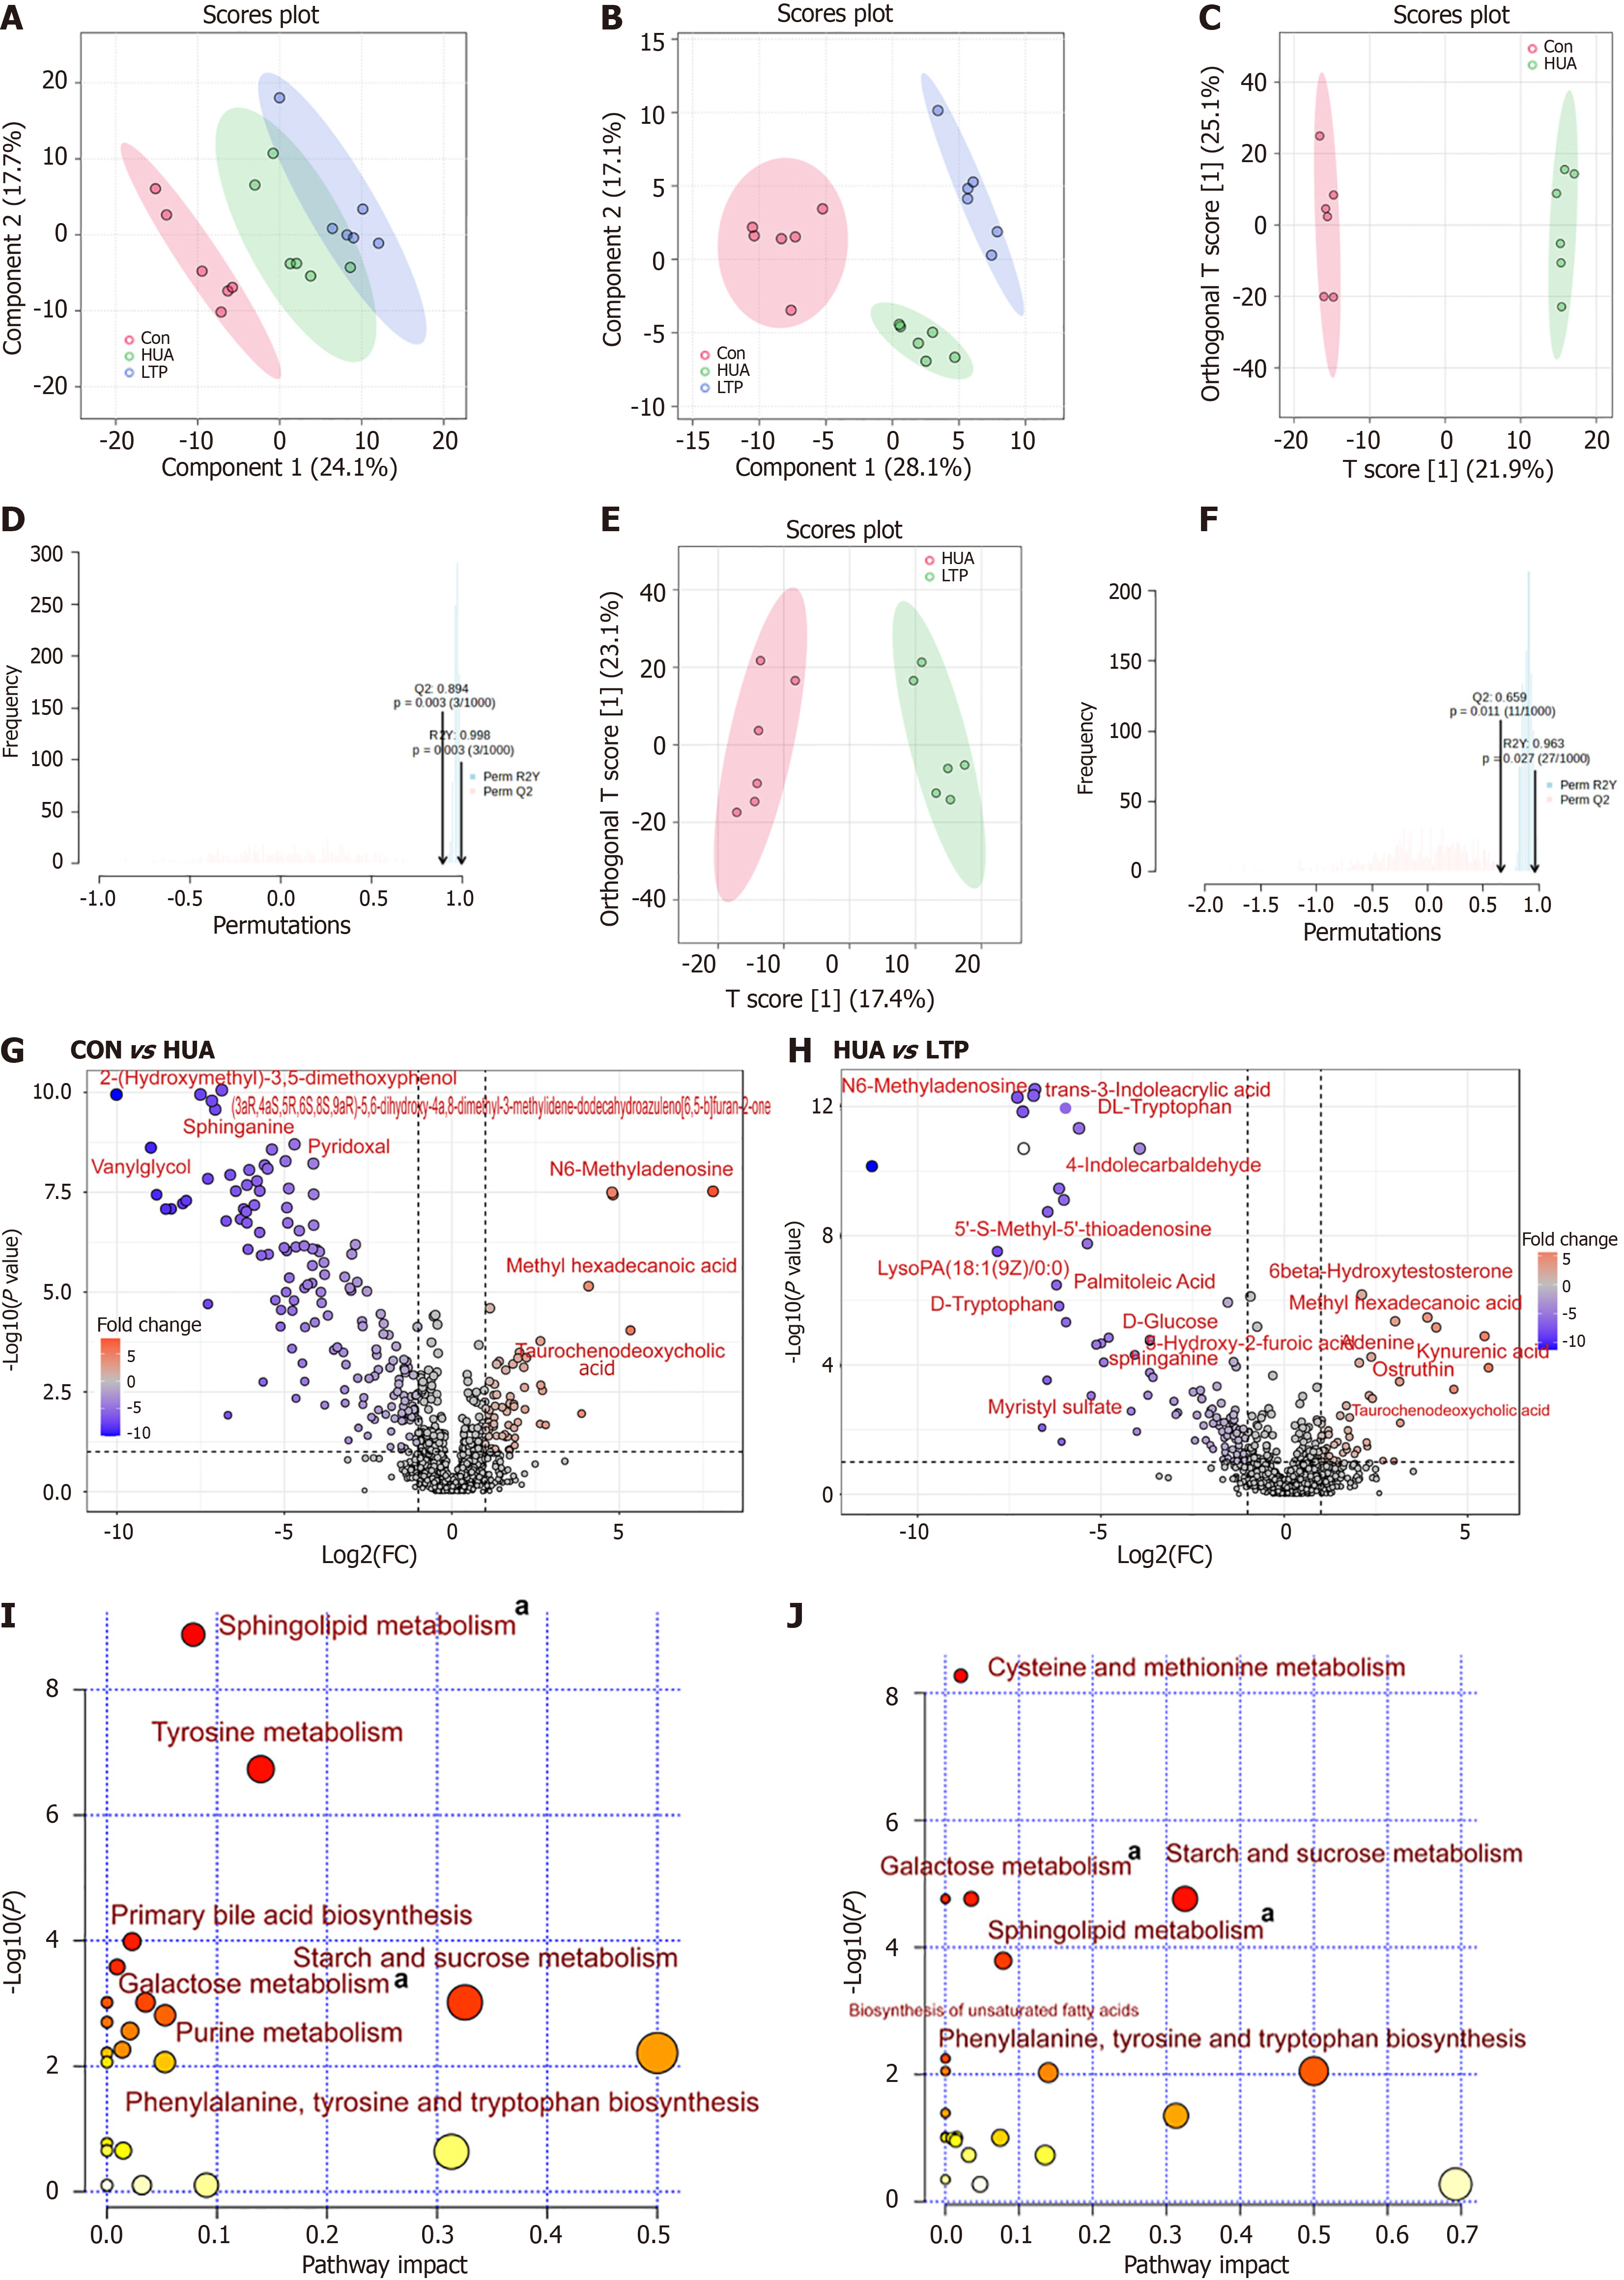
Figure 6 Leech Poecilobdella manillensis total protein extract alters the plasma metabolites in potassium oxonate-induced hyper
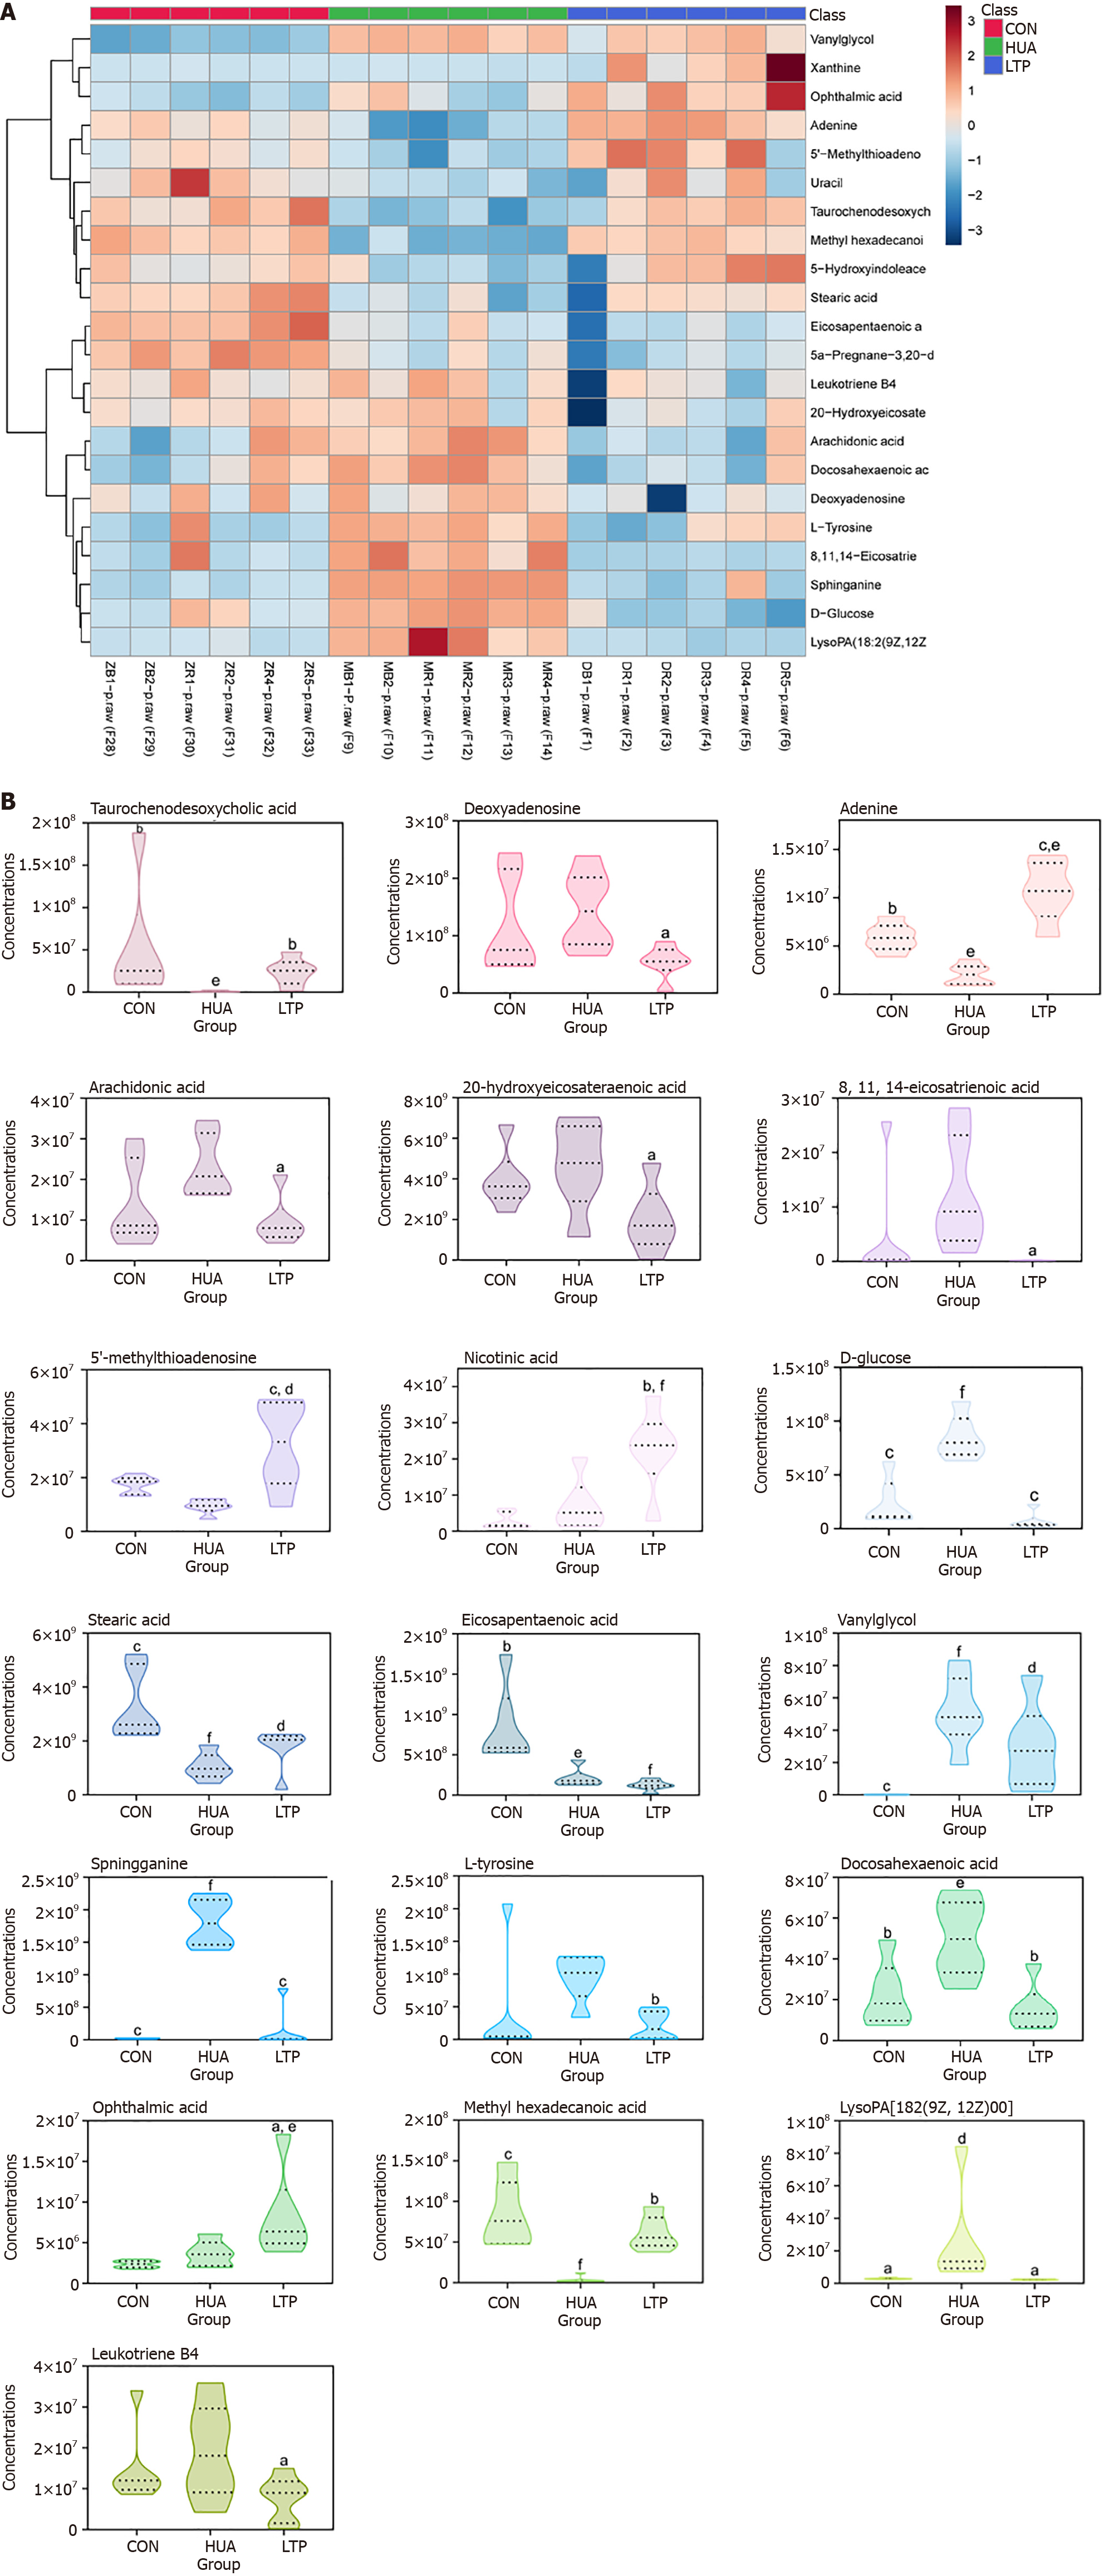
Figure 7 Effect of leech Poecilobdella manillensis total protein extract on vital metabolites.
A: Heatmaps showing the trends in differential metabolites between groups; B: The concentrations of vital metabolites for all groups, assessed through the Kruskal-Wallis ANOVA. Statistical significance is indicated as follows: aP < 0.05 vs hyperuricemia model group (HUA); bP < 0.01 vs HUA; cP < 0.001 vs HUA; dP < 0.05 vs normal control group (CON); eP < 0.01 vs CON; fP < 0.001 vs CON. CON: Normal control group; HUA: Hyperuricemia model group; LTP: Leech Poecilobdella manillensis total protein extract treatment group.
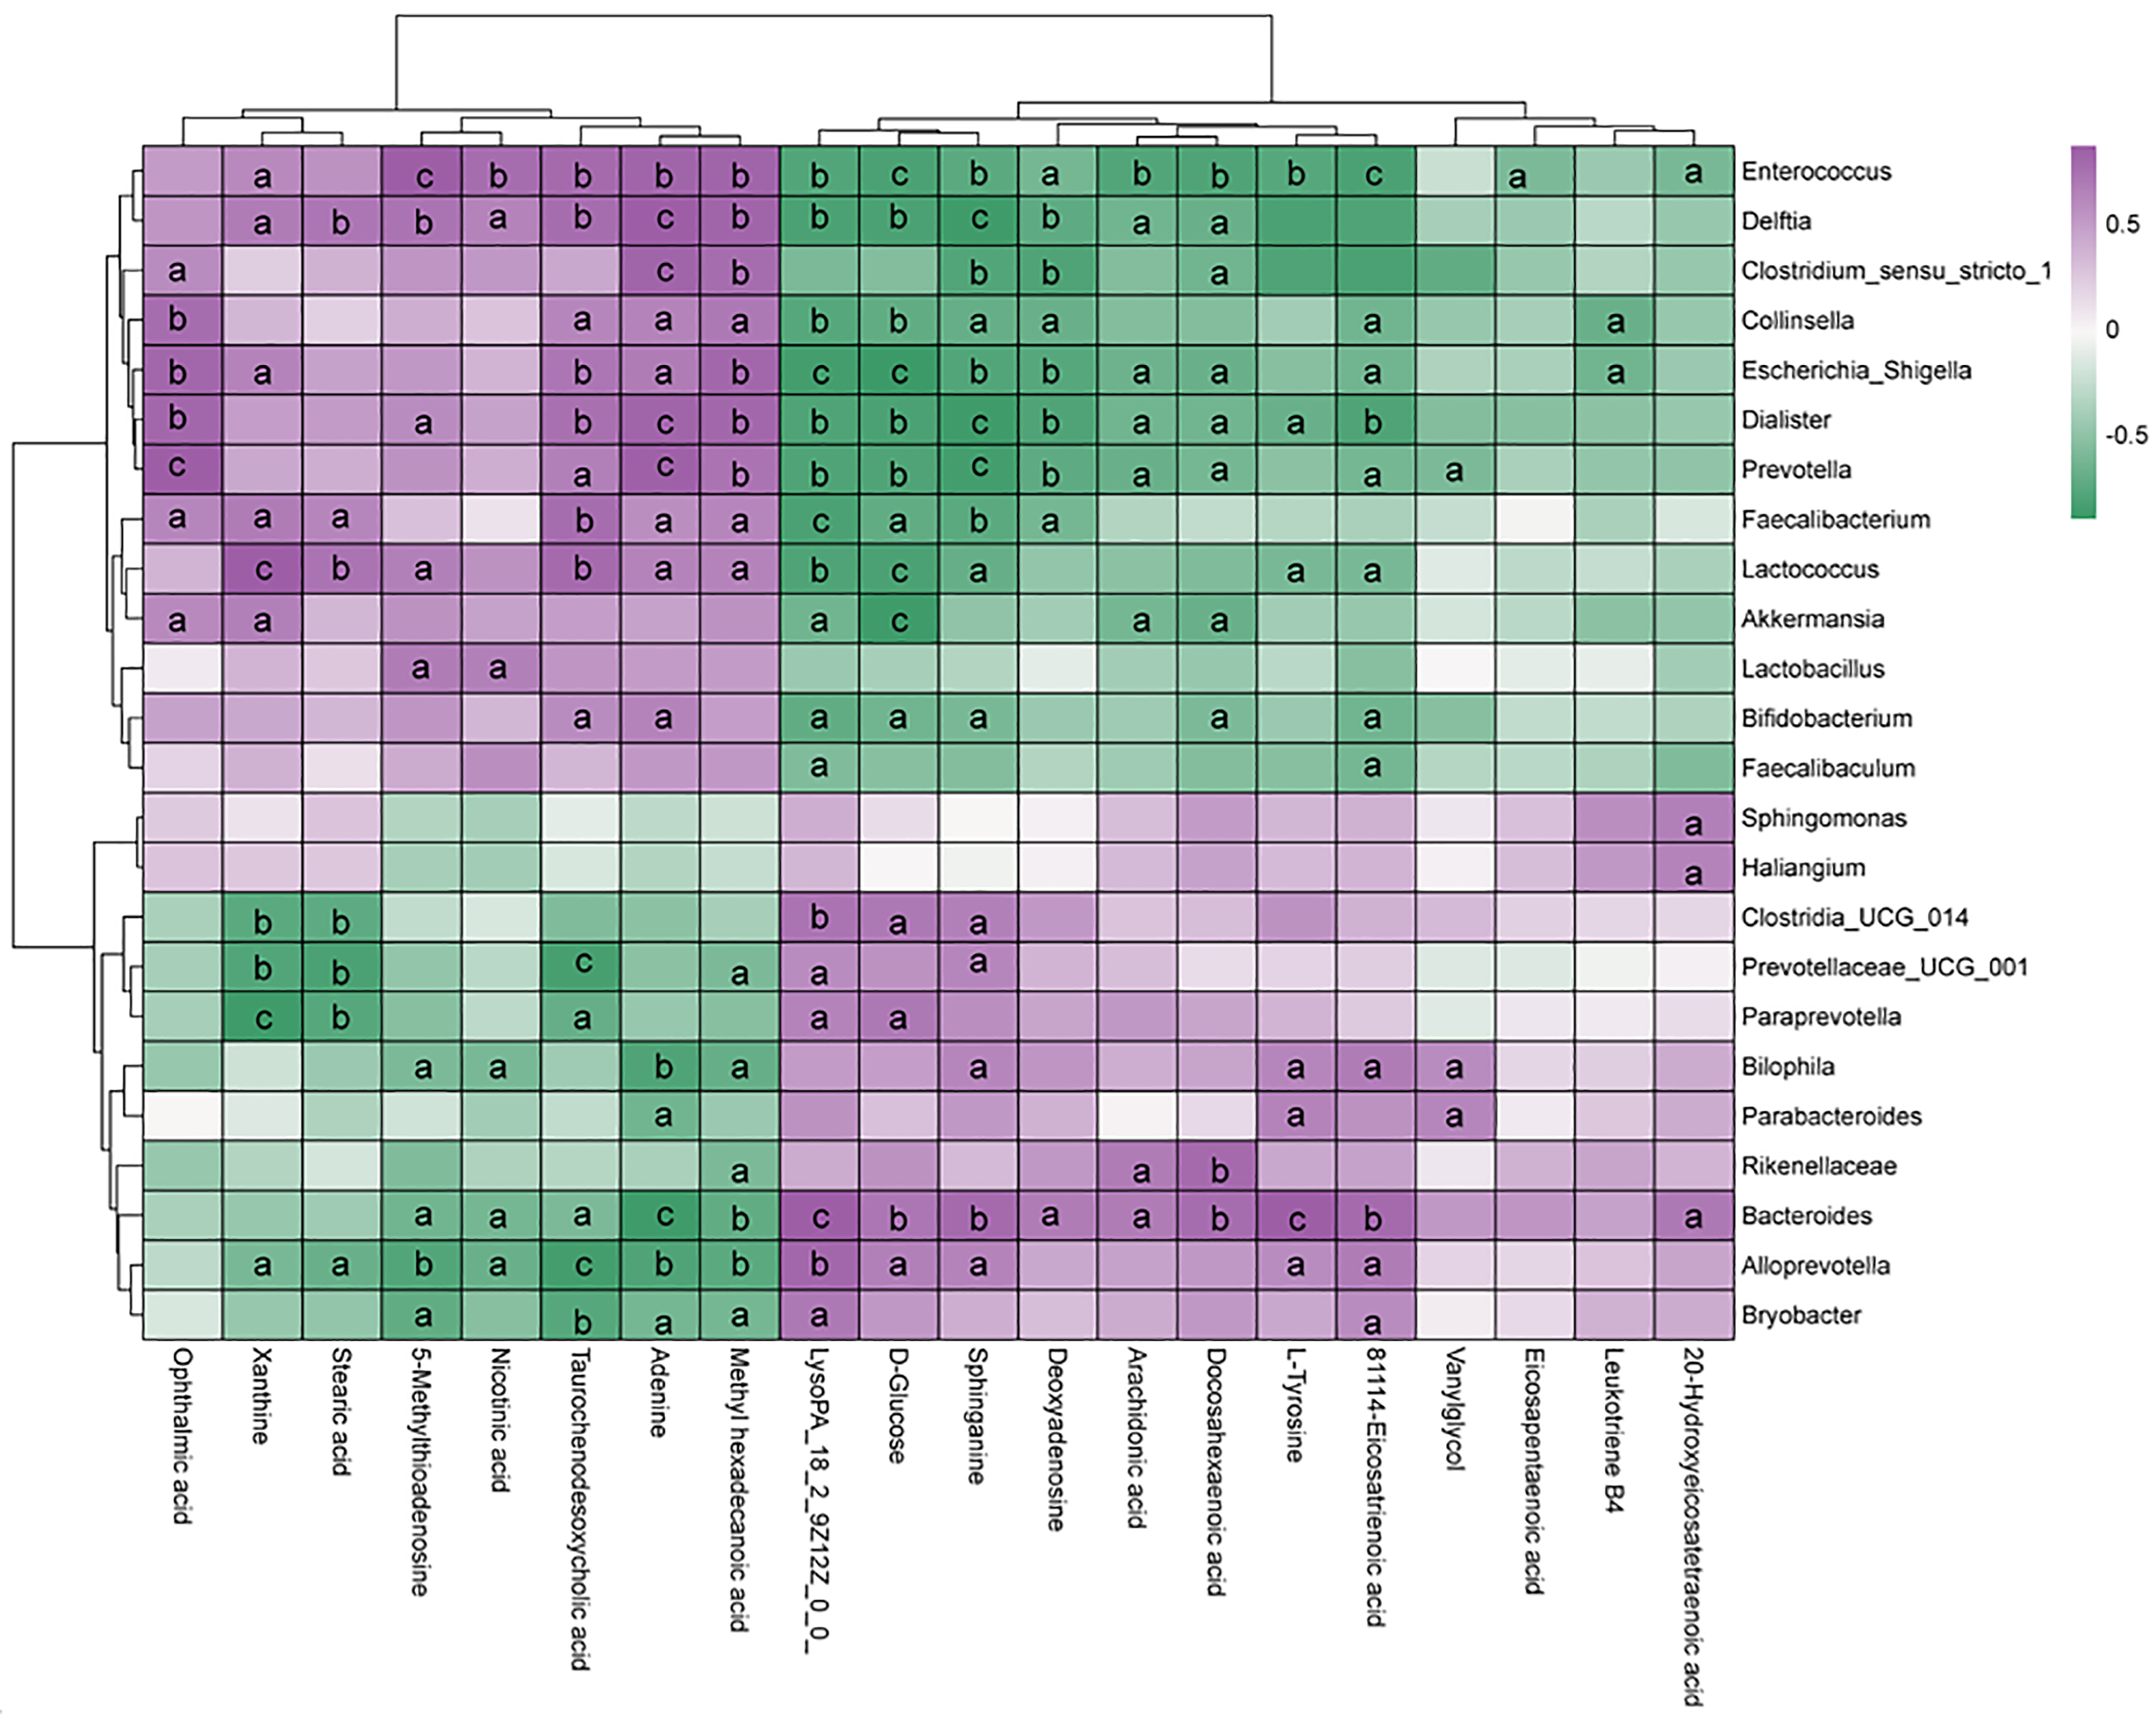
Figure 8 Correlation analysis between the gut microbiota and metabolites from hyperuricemia and leech Poecilobdella manillensis total protein extract groups.
The R values are represented by gradient colors, where purple cells indicate positive correlations and green cells indicate negative correlations, respectively. Statistical significance is denoted as follows: aP < 0.05, bP < 0.01, cP < 0.001.
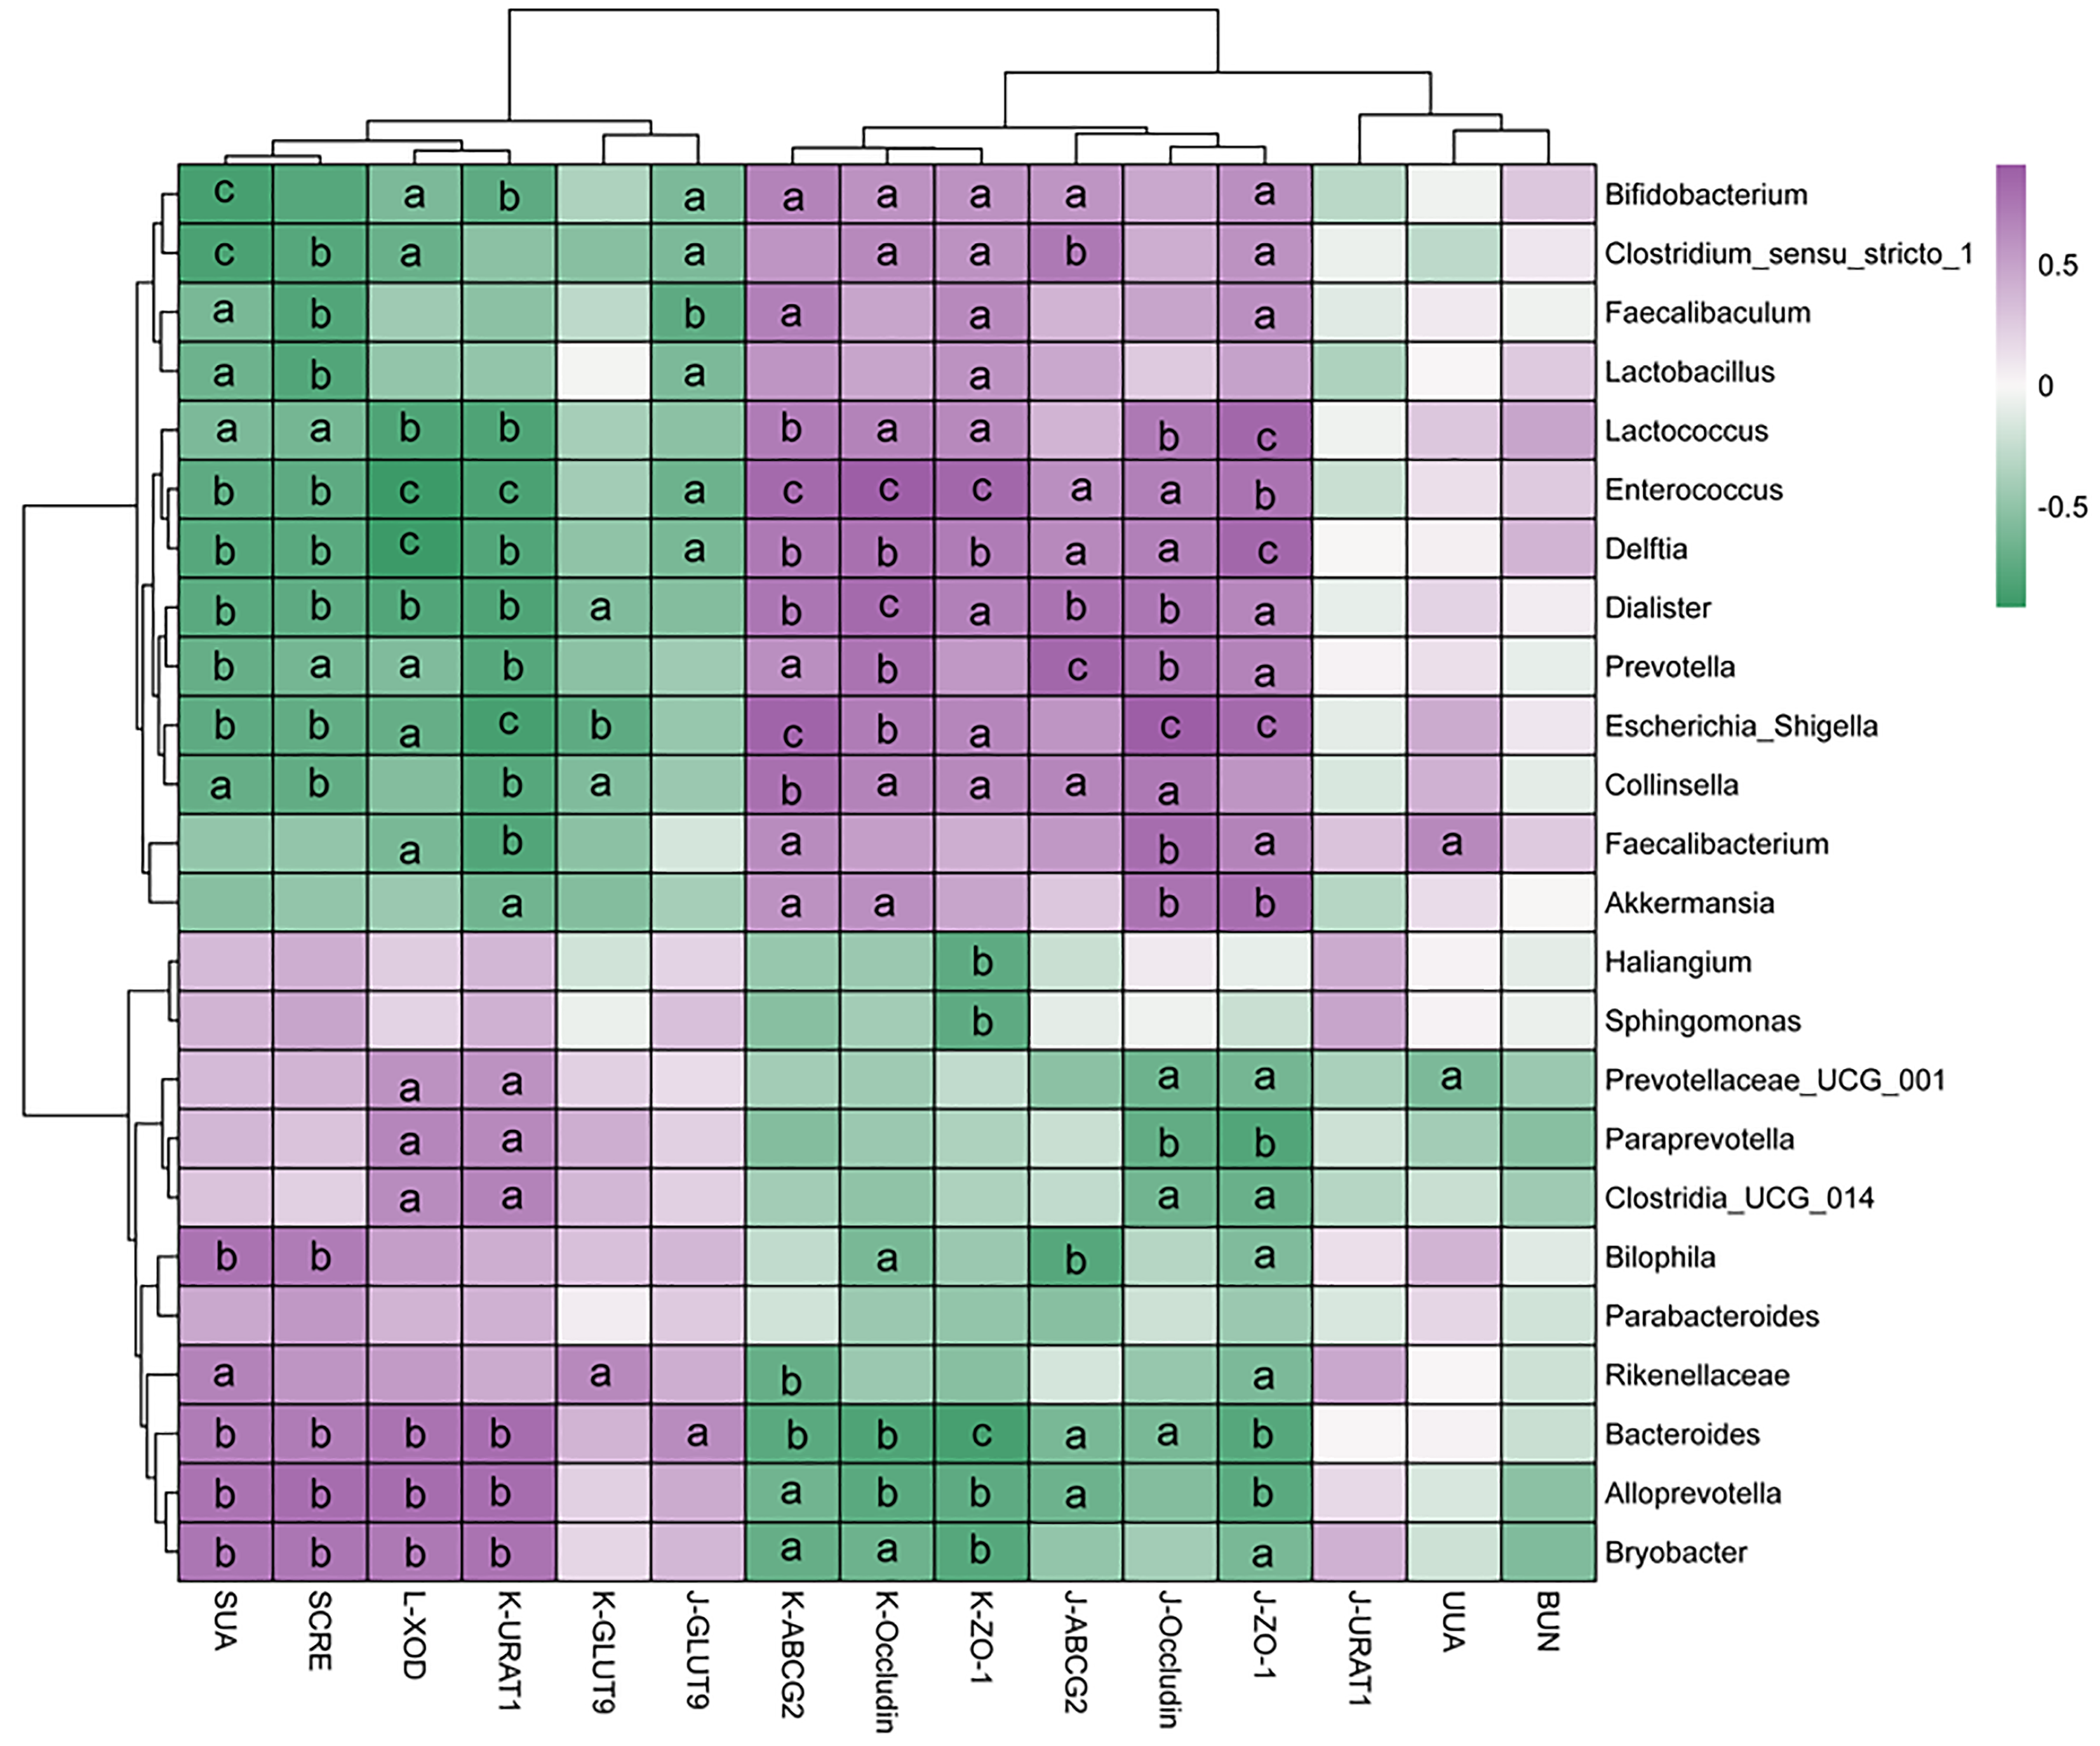
Figure 9 Correlation analysis between gut microbiota and hyperuricemia-related parameters.
The R values are represented by gradient colors, where purple cells indicate positive correlations and green cells indicate negative correlations, respectively. Statistical significance is denoted as follows: aP < 0.05, bP < 0.01, cP < 0.001. BUN: Blood urea nitrogen; UUA: Urinary uric acid; ZO-1: Zonula occludens-1; URAT1: Urate transporter 1; GLUT9: Glucose transporter 9; ABCG2: ATP-binding cassette transporter G2; XOD: Xanthine oxidase; SCRE: Serum creatinine; SUA: Serum uric acid.
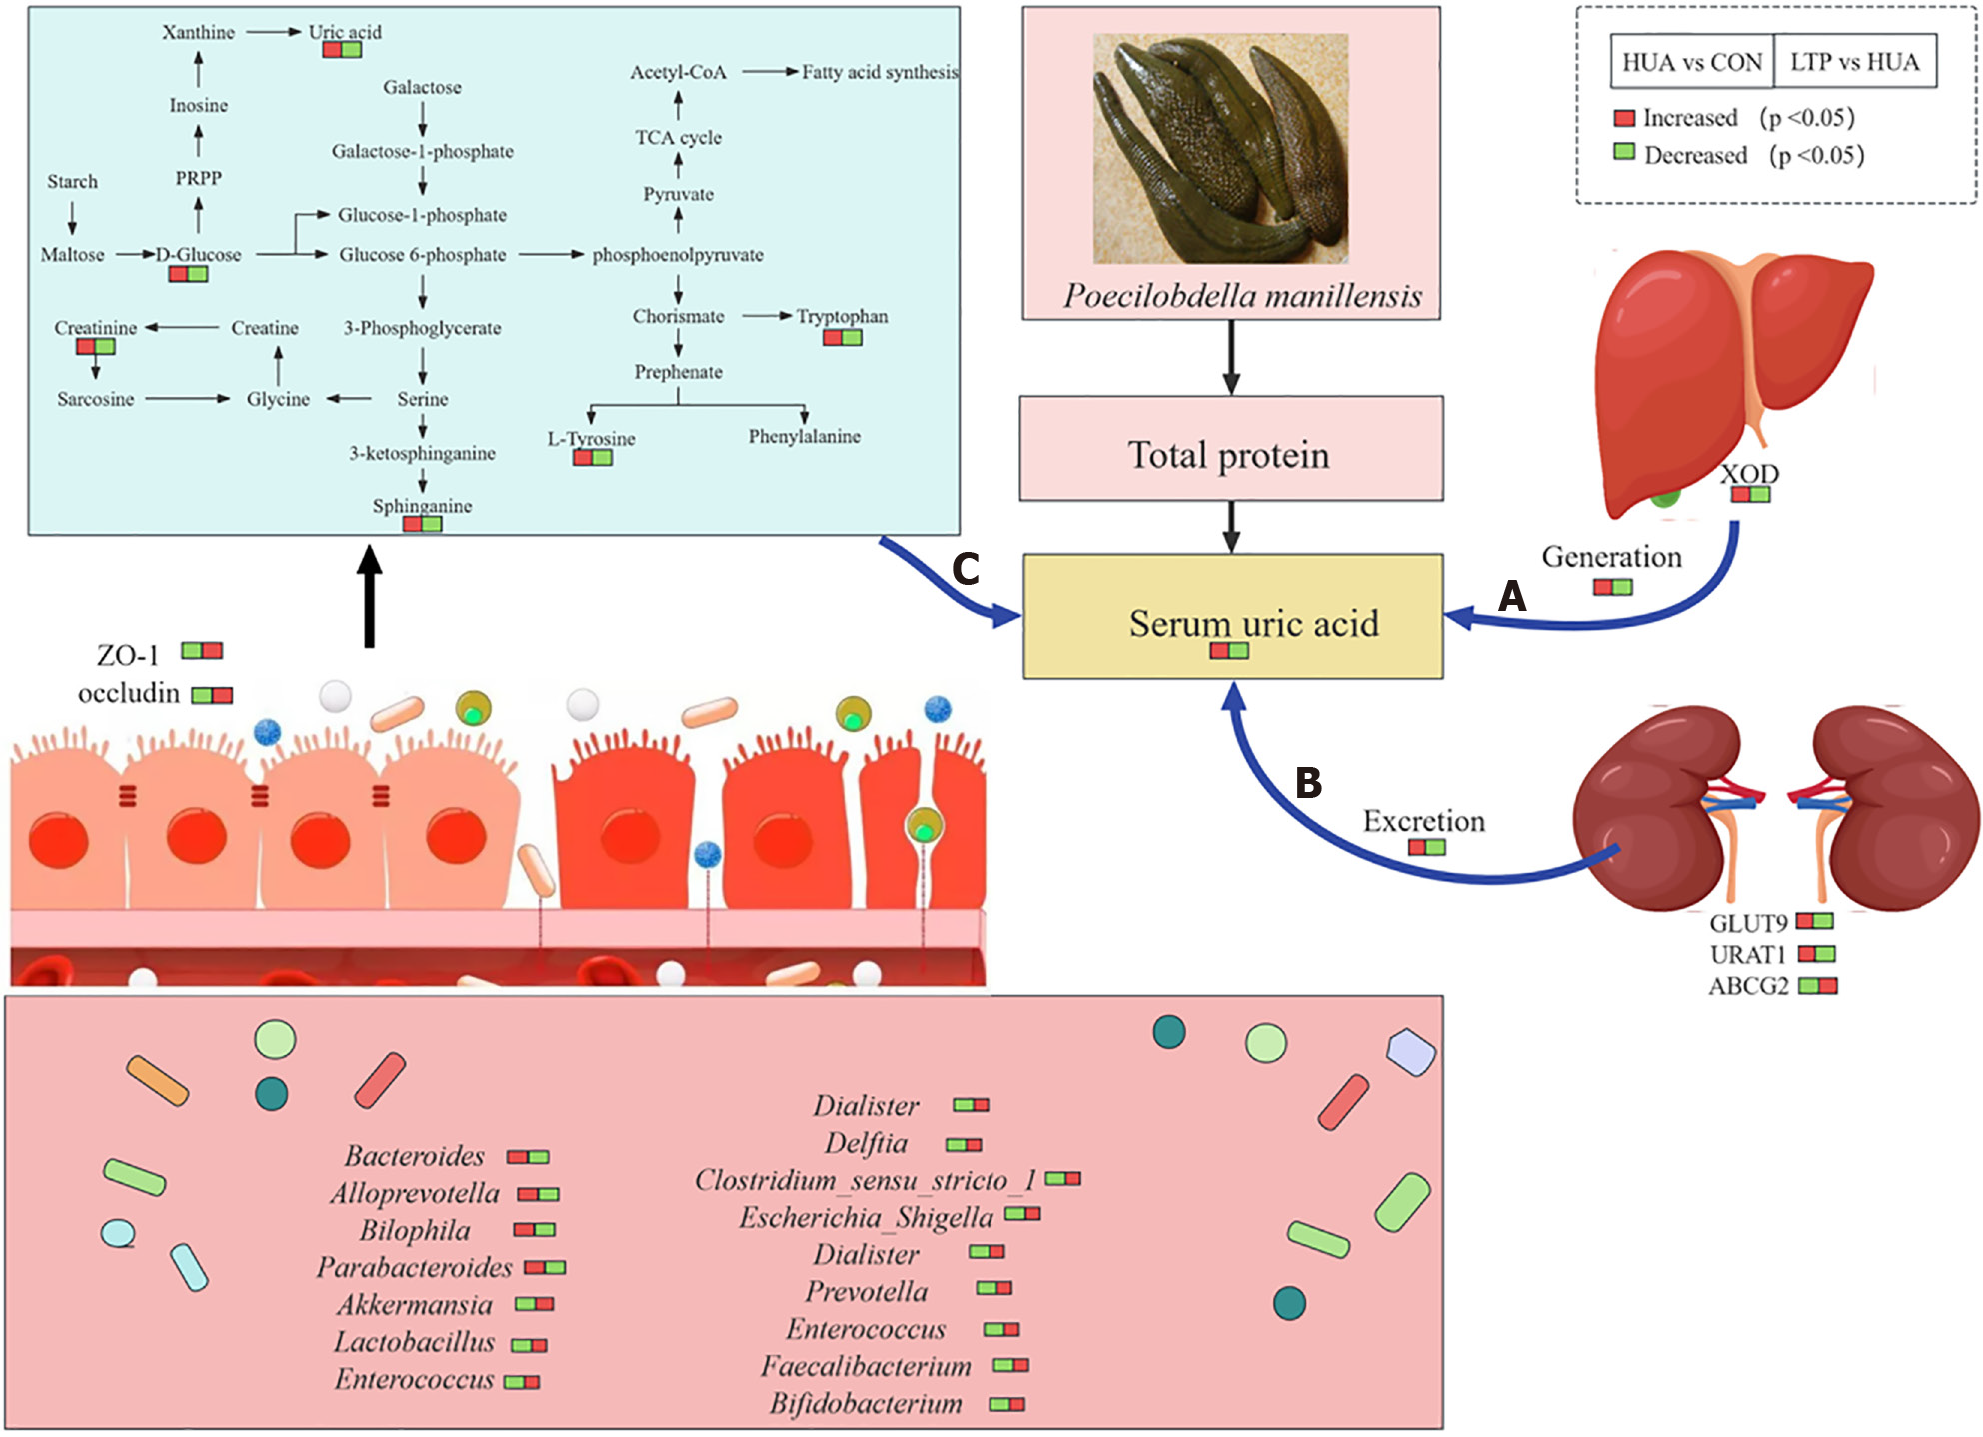
Figure 10 Mechanisms associated with treatment of Poecilobdella manillensis for hyperuricemia.
A: decreased of uric acid generation in liver by reducing levels of xanthine oxidase; B: Reduction of uric acid excretion from kidney by regulating the expression of glucose transporter 9, urate transporter 1, and ATP-binding cassette transporter G2; C: Improvement of gut microbiota dysbiosis and regulation of sphingolipid metabolism and galactose metabolism. CON: Normal control group; HUA: Hyperuricemia model group; LTP: Leech Poecilobdella manillensis total protein extract treatment group; ZO-1: Zonula occludens-1; URAT1: Urate transporter 1; GLUT9: Glucose transporter 9; ABCG2: ATP-binding cassette transporter G2; XOD: Xanthine oxidase.
- Citation: Liu X, Liang XQ, Lu TC, Feng Z, Zhang M, Liao NQ, Zhang FL, Wang B, Wang LS. Leech Poecilobdella manillensis protein extract ameliorated hyperuricemia by restoring gut microbiota dysregulation and affecting serum metabolites. World J Gastroenterol 2024; 30(29): 3488-3510
- URL: https://www.wjgnet.com/1007-9327/full/v30/i29/3488.htm
- DOI: https://dx.doi.org/10.3748/wjg.v30.i29.3488


