Copyright
©The Author(s) 2024.
World J Gastroenterol. May 21, 2024; 30(19): 2575-2602
Published online May 21, 2024. doi: 10.3748/wjg.v30.i19.2575
Published online May 21, 2024. doi: 10.3748/wjg.v30.i19.2575
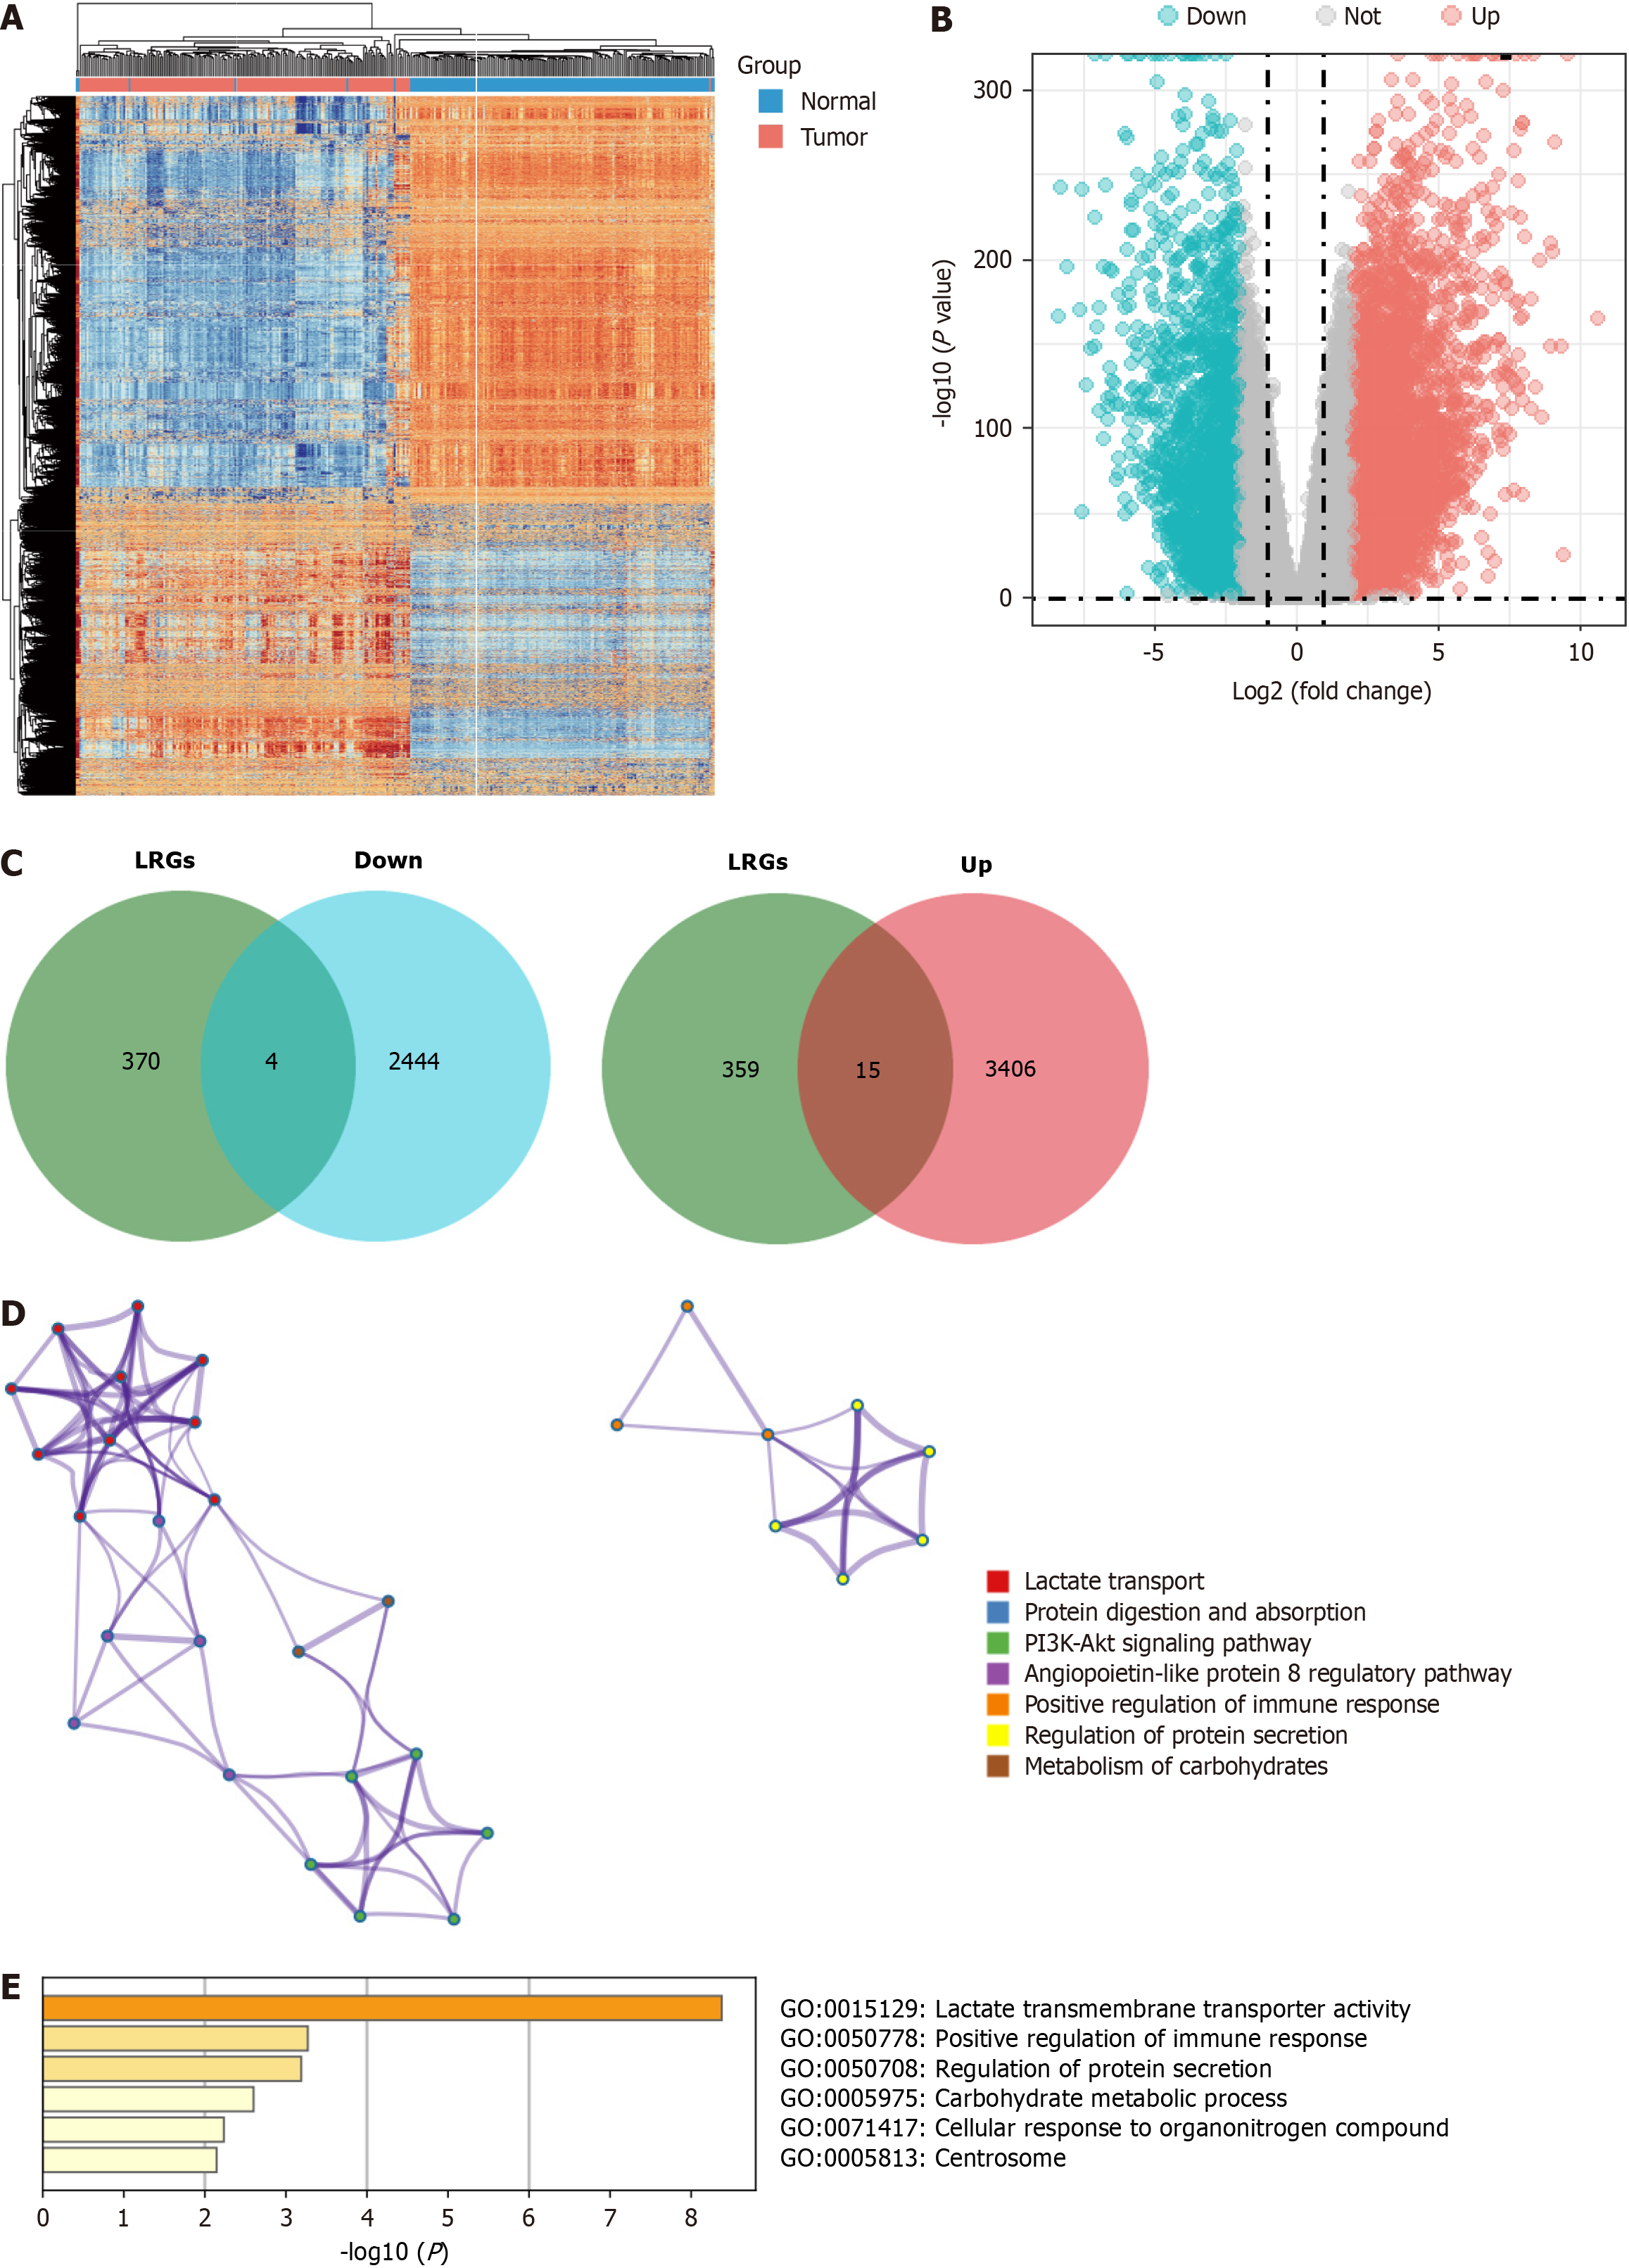
Figure 1 Identification of lactylation-related genes in pancreatic ductal adenocarcinoma.
A and B: The heatmap and volcano plots of the differentially expressed genes (DEGs); C: The Veen diagram of DEGs and lactylation-related gene set; D and E: The function of the lactylation-related genes in the Metascape database. LRGs: Lactylation-related genes.
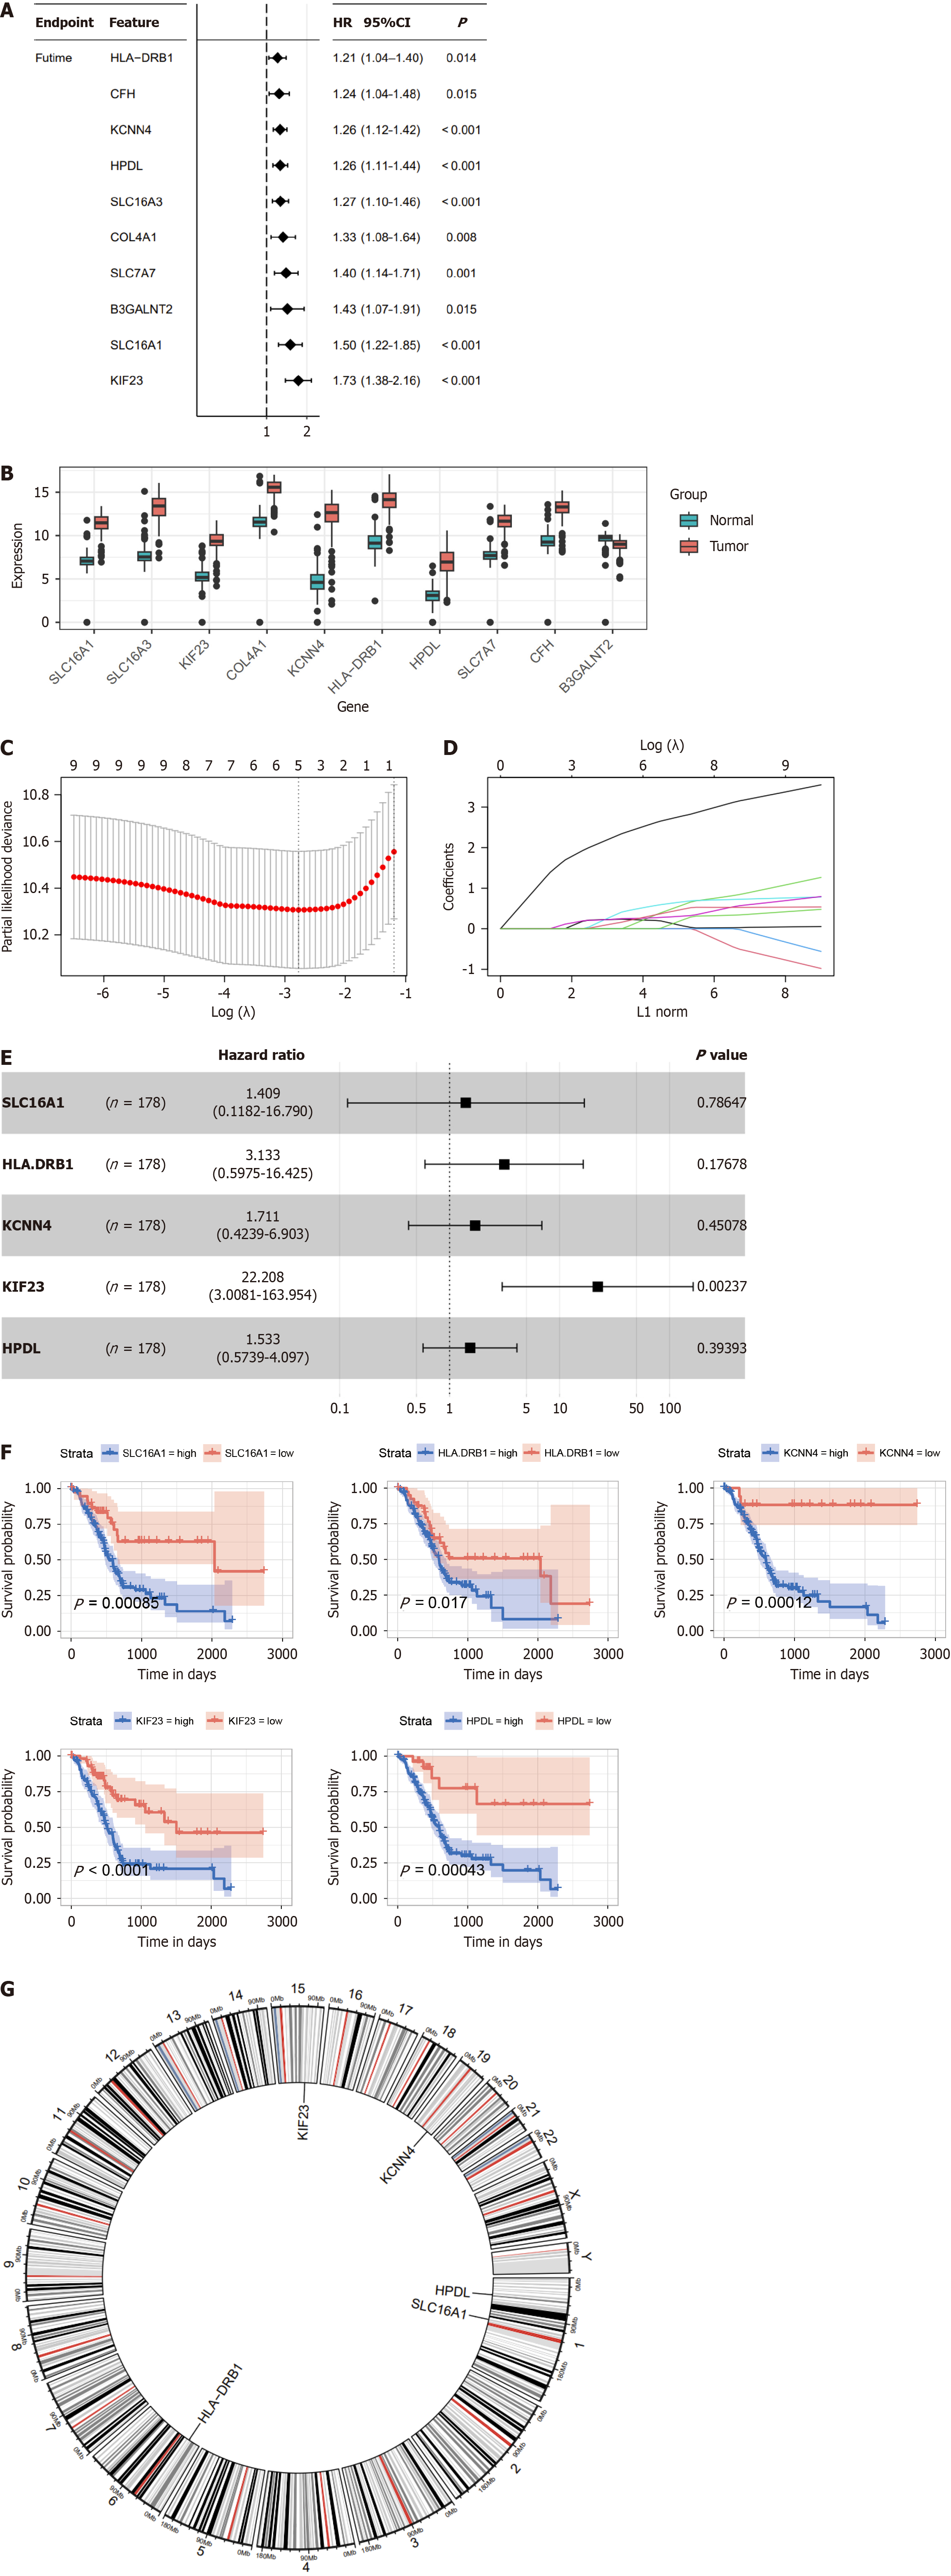
Figure 2 Construction of the lactylation-related prognostic model.
A: Univariate Cox regression analysis screened 10 prognostic lactylation-related genes (LRGs); B: Expression difference of LRGs between normal and pancreatic ductal adenocarcinoma tissues; C and D: Lasso regression analyses of LRGs using the overall survival (OS) model; E: Multivariate Cox regression analysis of LRGs was shown using a forest plot; F: The OS curve of the prognostic LRGs; G: Circle plot of the location of the five LRGs. HR: Hazard ratio.
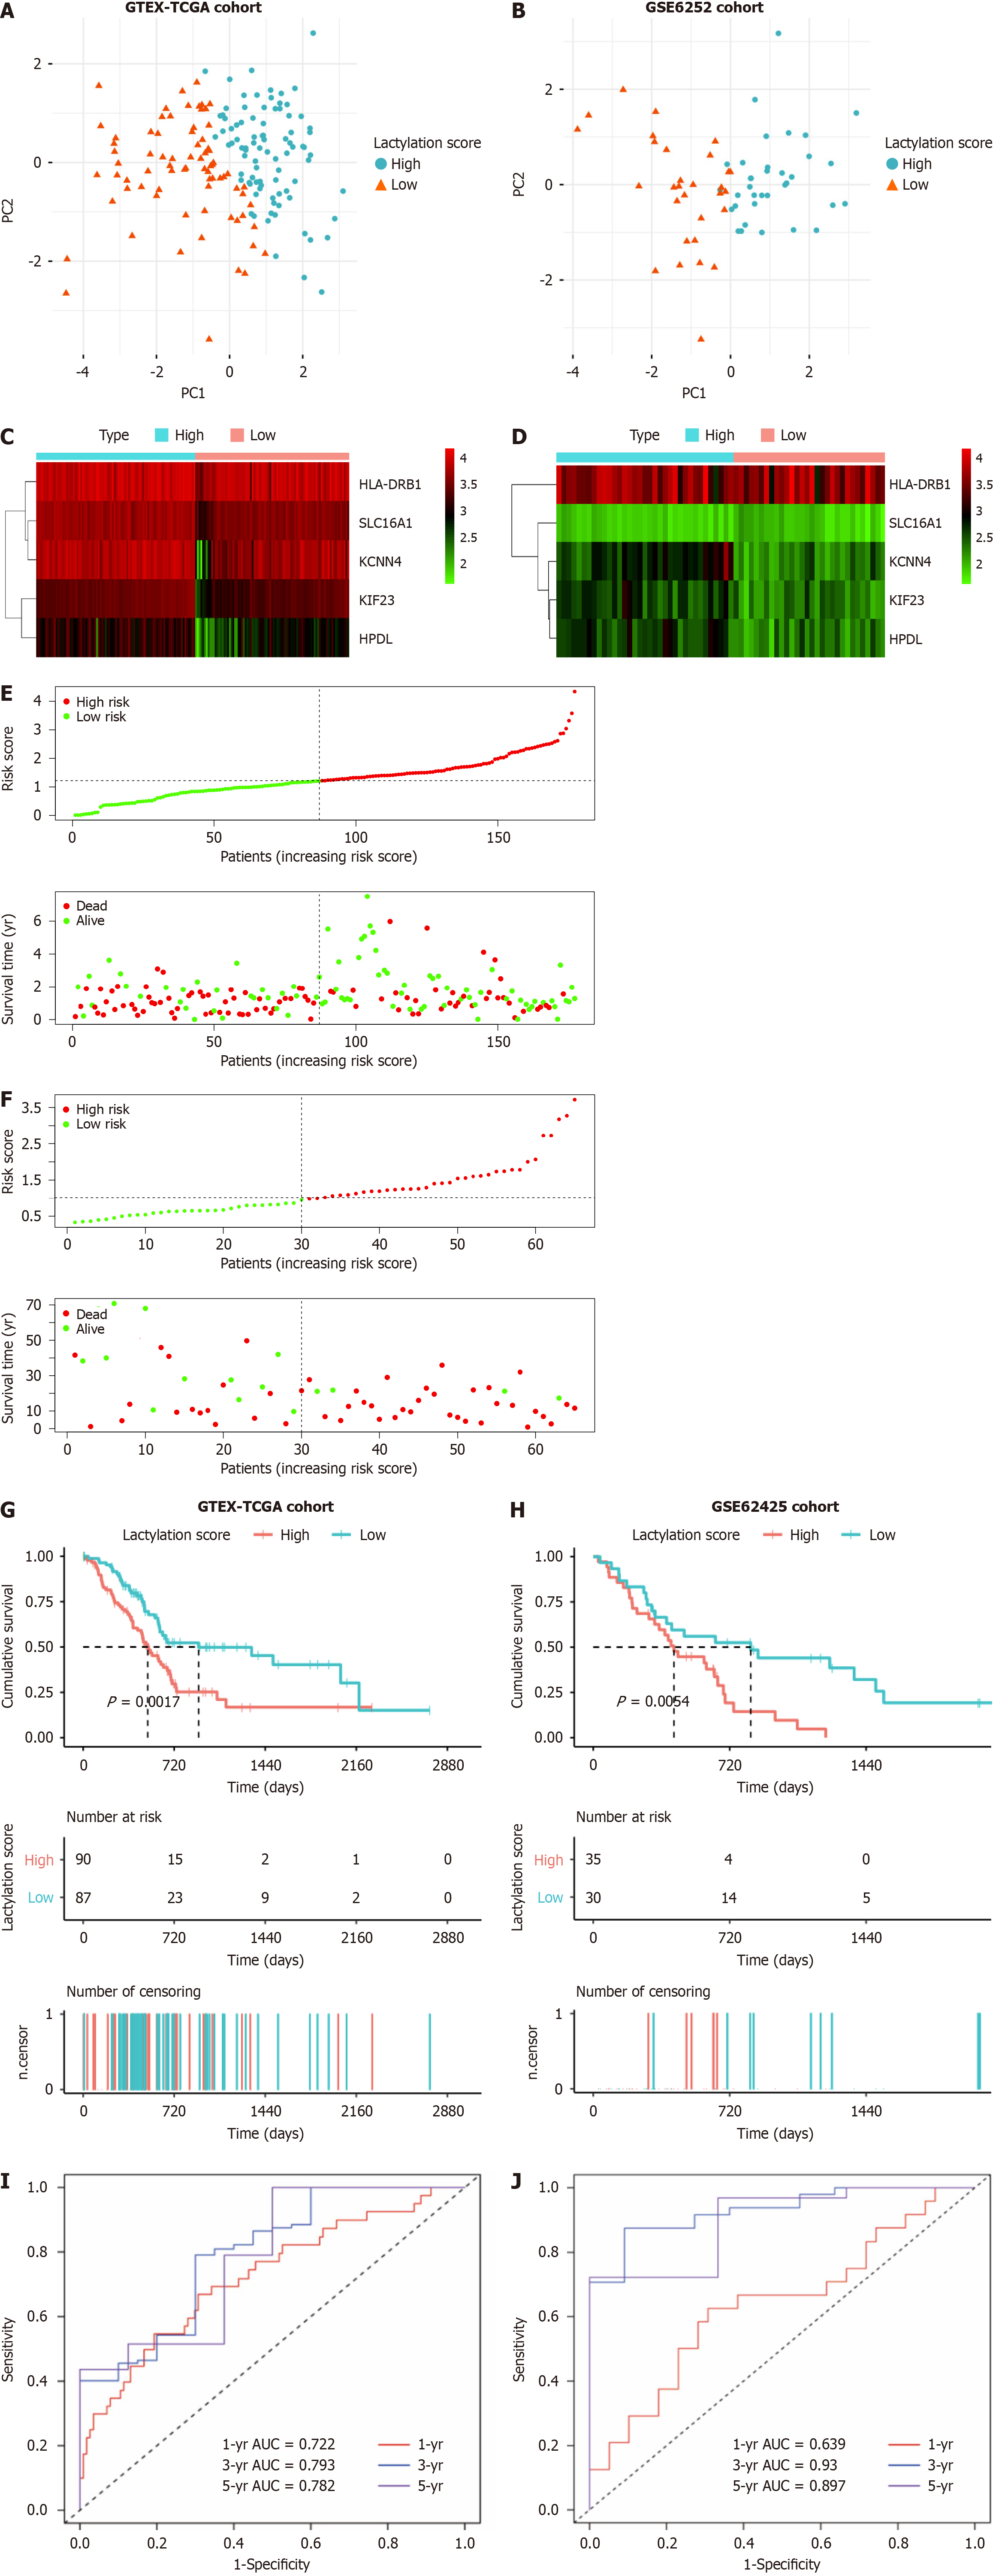
Figure 3 Prognostic value of lactylation-related genes in pancreatic ductal adenocarcinoma.
A and B: Principal component analysis was used to assess the accuracy of subgroups based on the lactylation score in training and validation sets; C and D: Heatmap for the expression of the prognostic lactylation-related genes (LRGs) of two groups in the training set and validation set; E and F: The distribution of lactylation score and survival status of the patients with pancreatic ductal adenocarcinoma with increasing scores in two sets; G and H: Kaplan-Meier survival analysis between lactylation score-low and lactylation score-high groups in two sets; I and J: Receiver operating characteristic curves analysis of LRGs on overall survival at 1 year, 3 years, and 5 years in two sets. AUC: The area under curve.
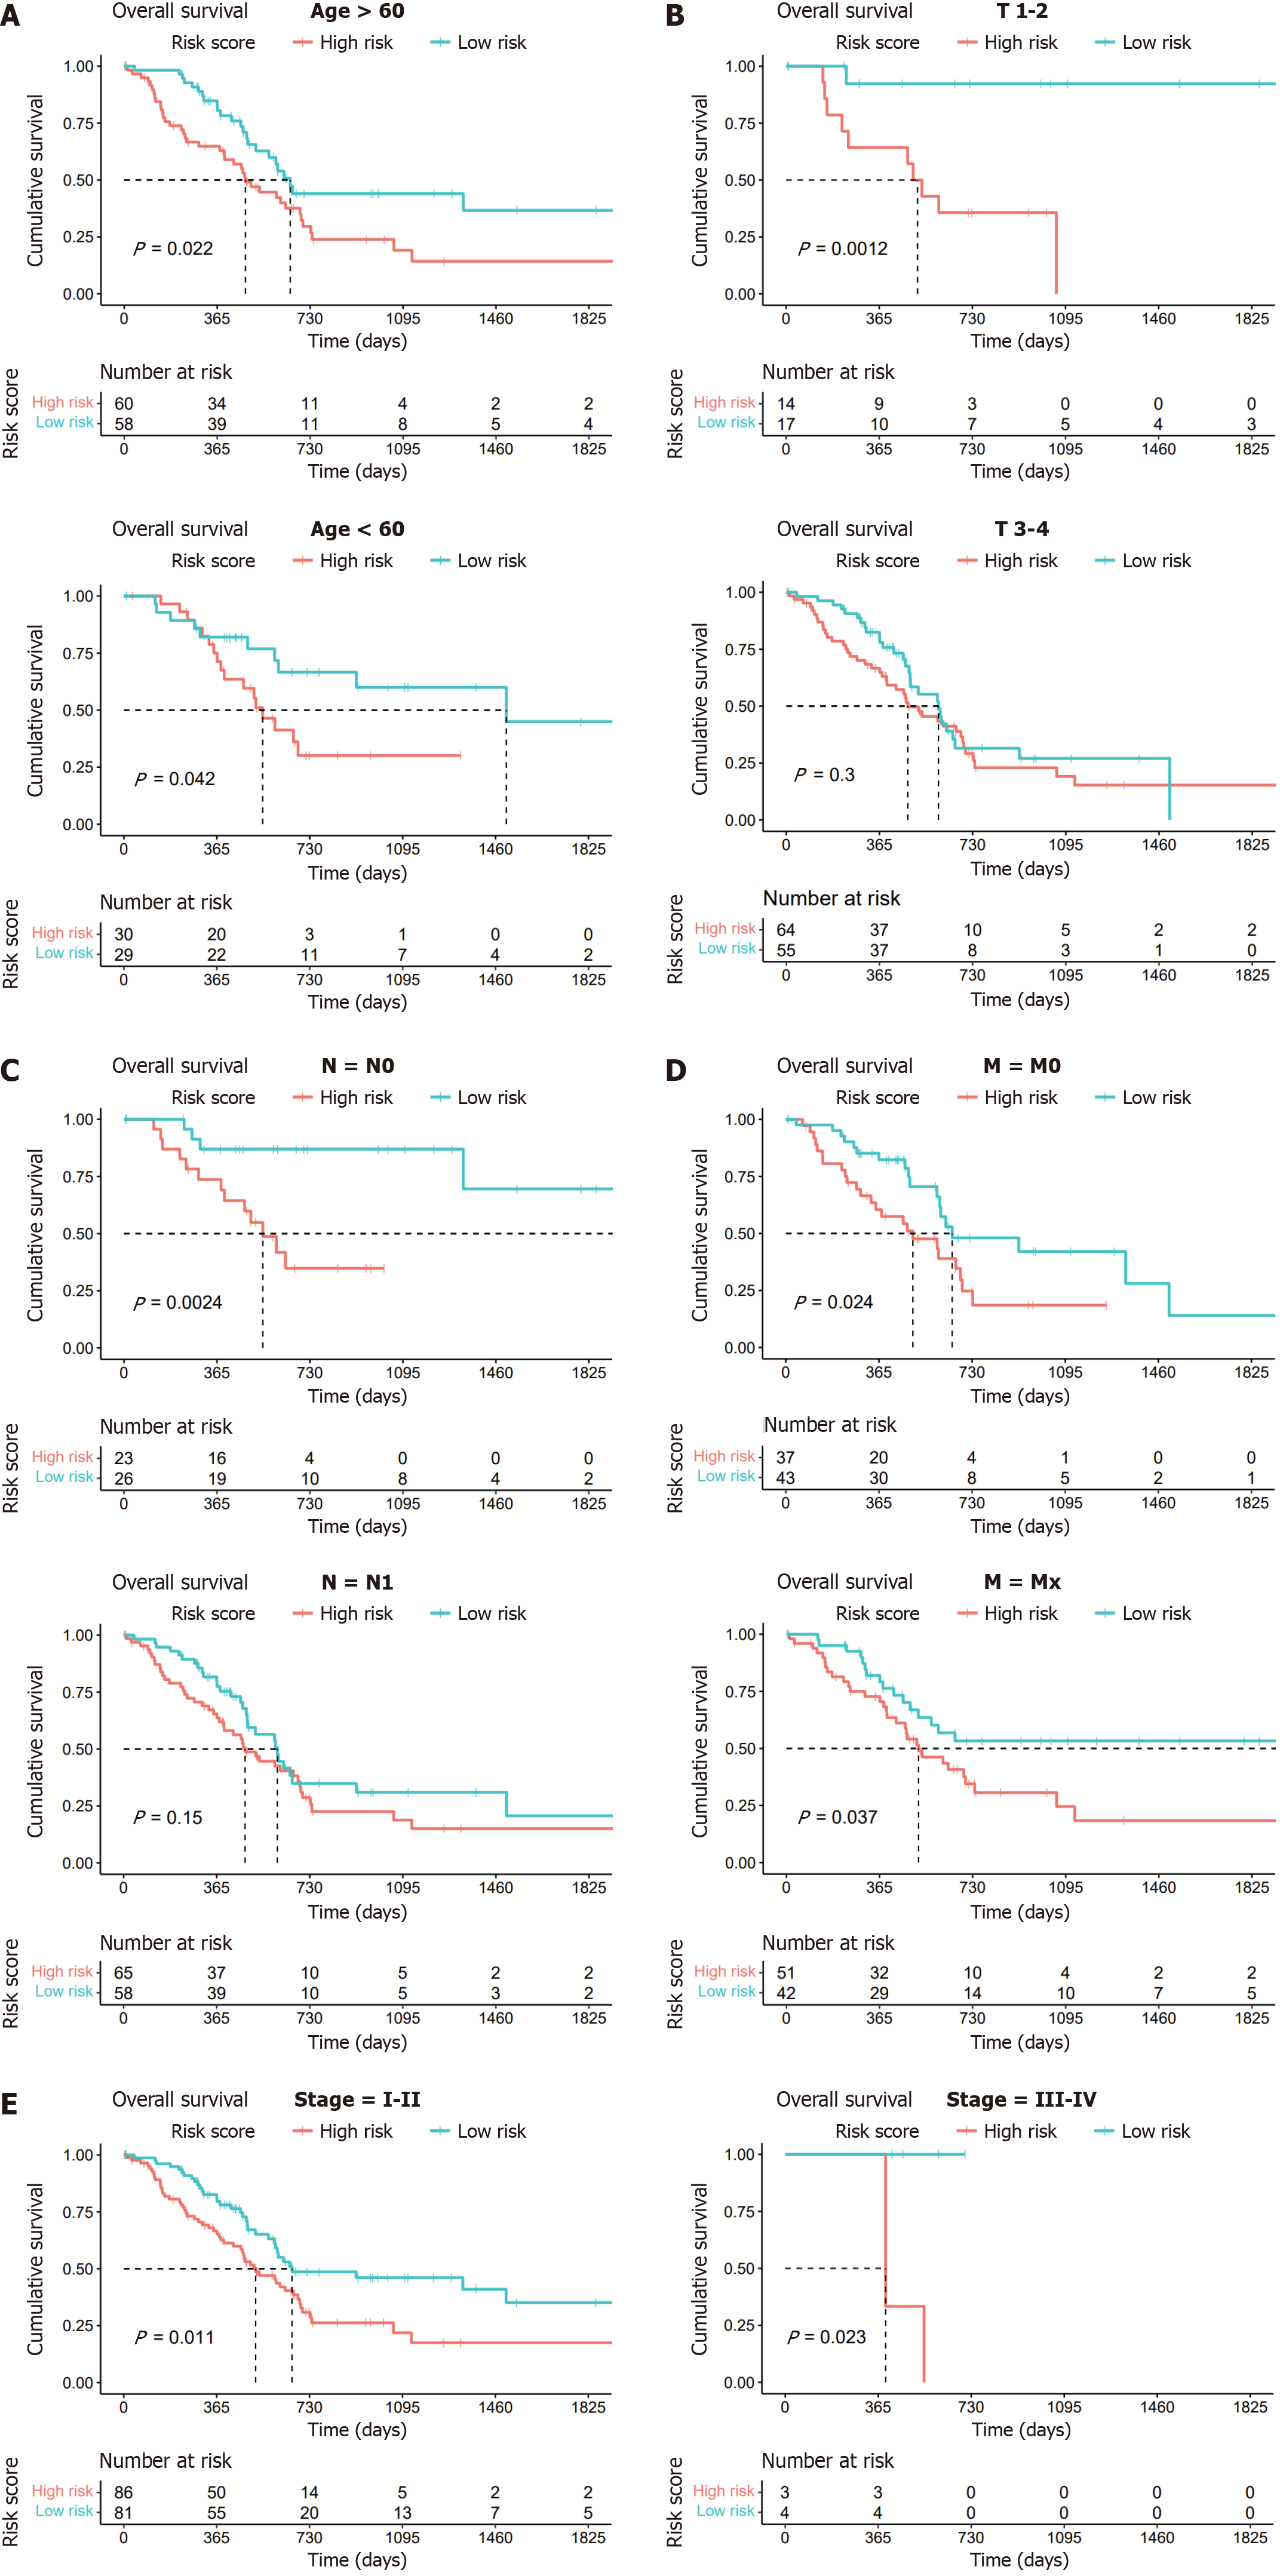
Figure 4 Kaplan-Meier survival analysis of two subgroups based on clinical characteristics.
A: Age (> 60 years and ≤ 60 years); B: T stage (T1–2 and T3–4); C: N stage (N0 and N1); D: M stage (M0 and Mx); E: Stages (stage I-II and stage III-IV).
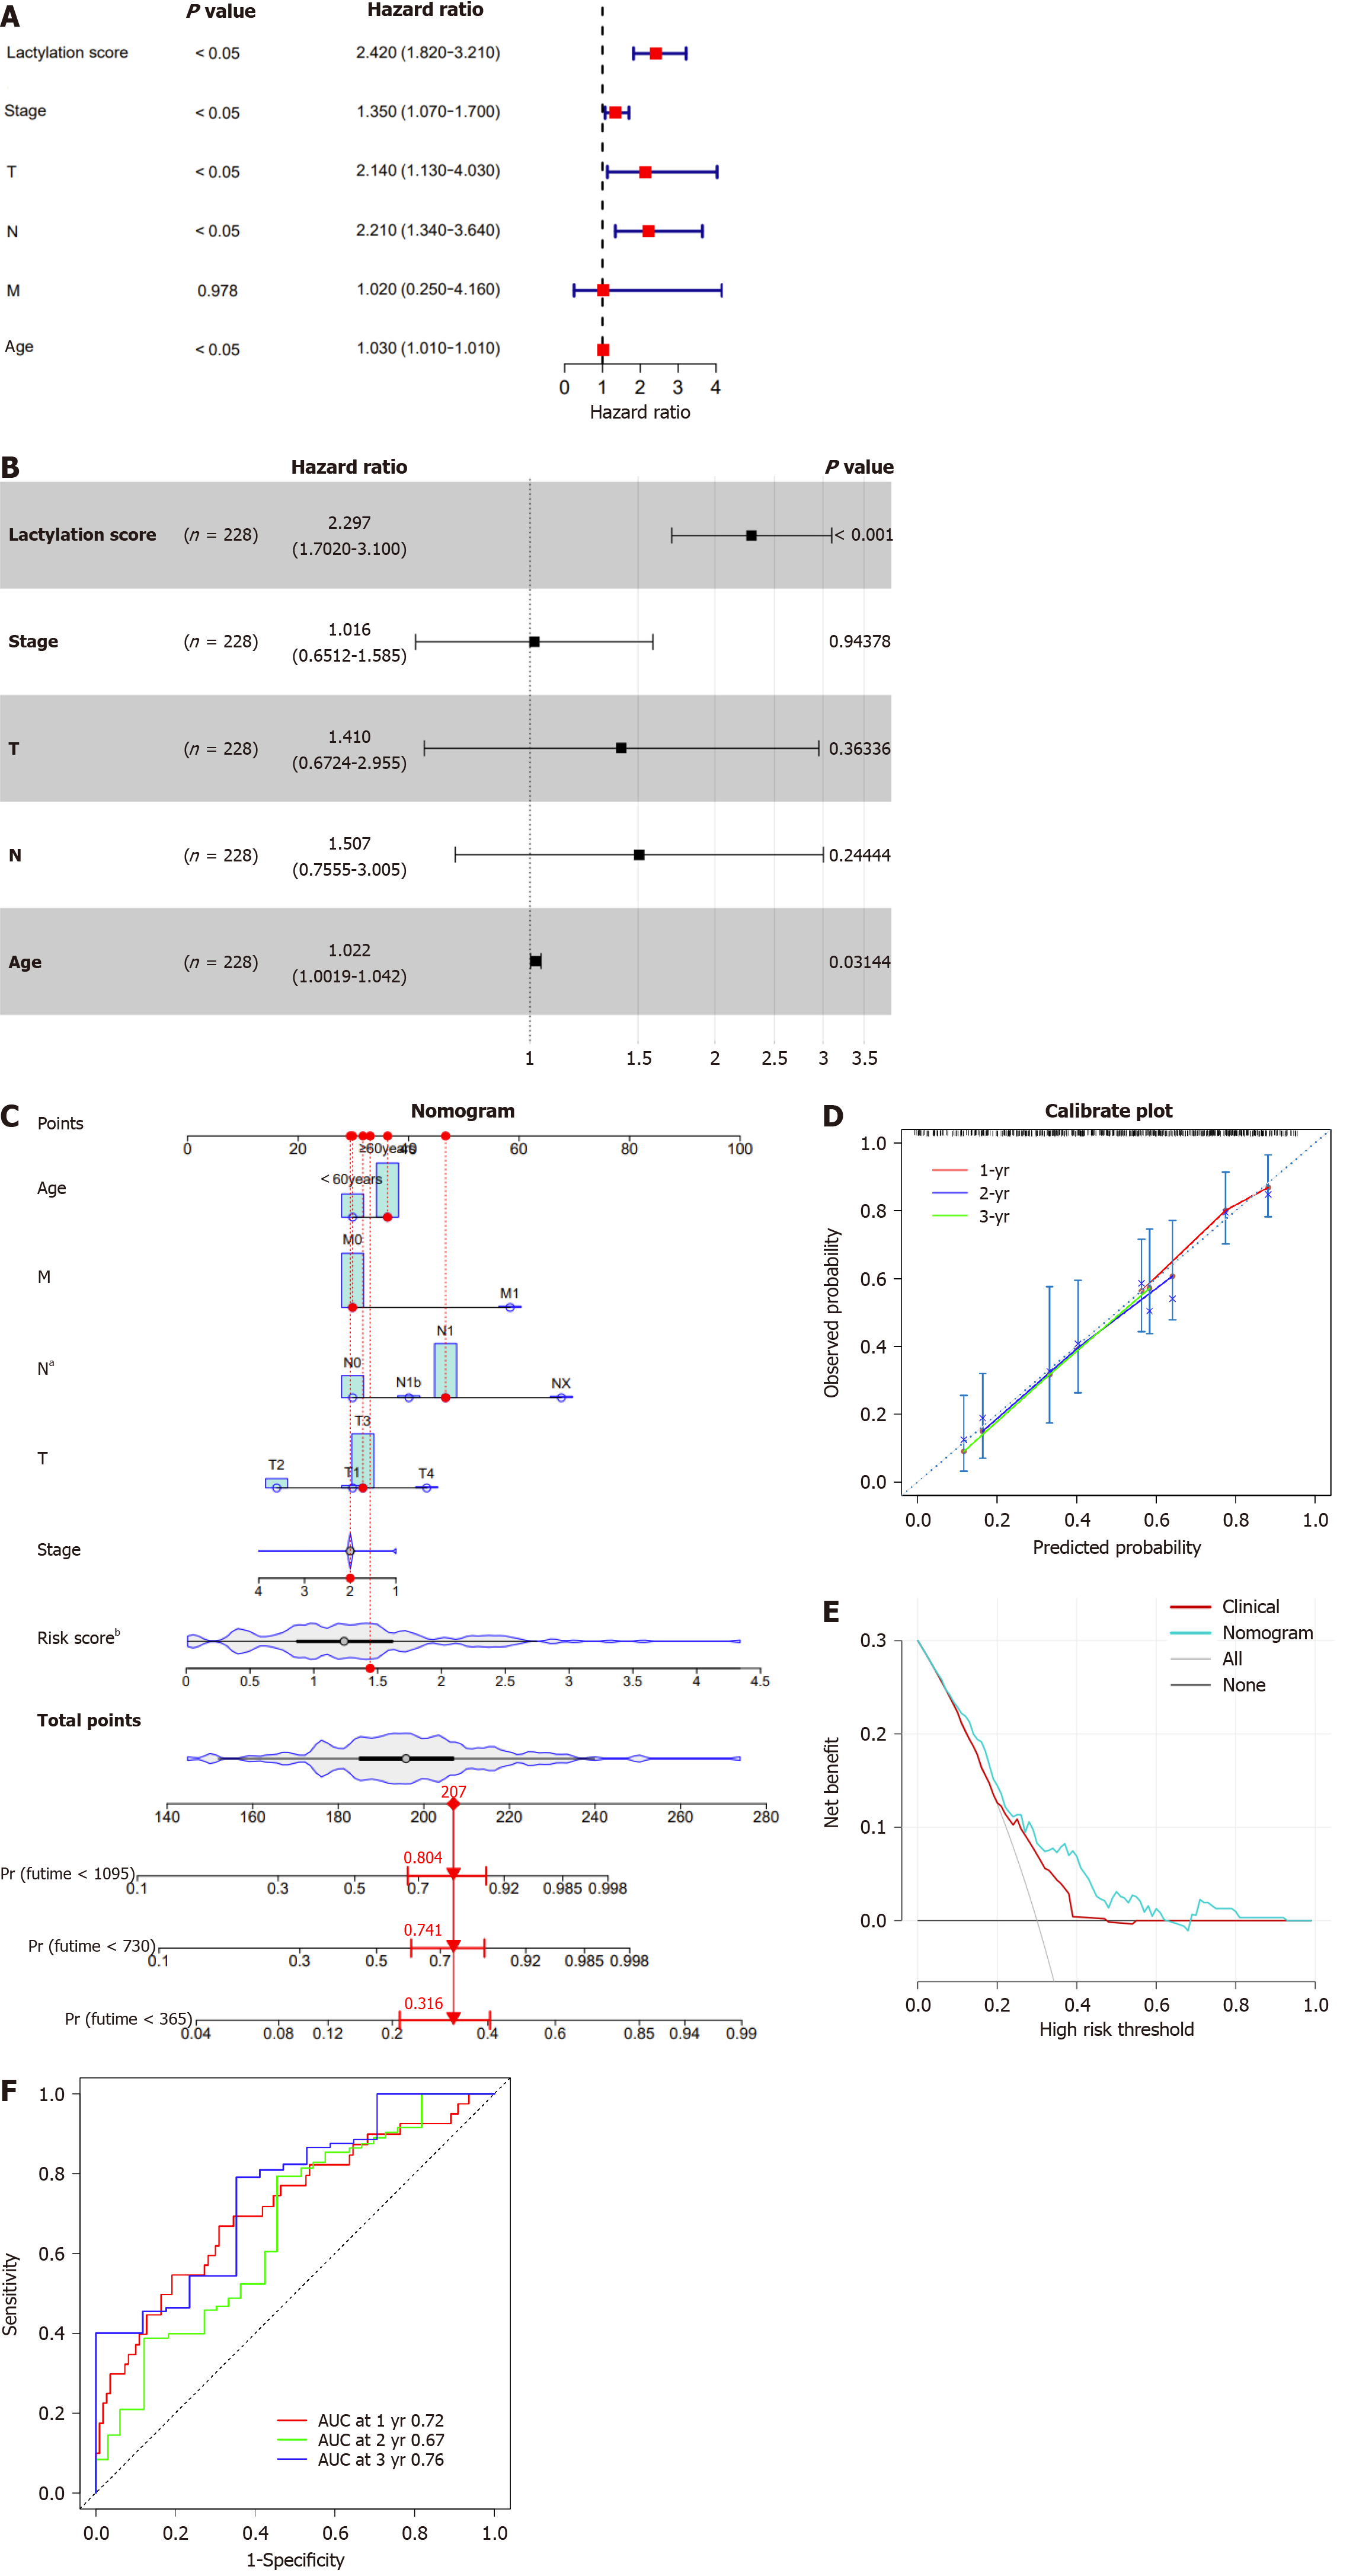
Figure 5 Construction and evaluation of the nomogram.
A and B: The univariate and multivariate Cox regression analyses in patients with pancreatic ductal adenocarcinoma (PDAC); C: The nomogram by combining lactylation score with age for predicting the 1-,3-, and 5-year survival probability of patients with PDAC; D: The calibration curves of the nomogram for predicting overall survival (OS) probability for 1-, 3-, and 5-years OS probabilities; E: Decision curve analysis of the nomogram; F: Receiver operating characteristic analysis of the nomogram. aP < 0.05, bP < 0.01. AUC: The area under curve.
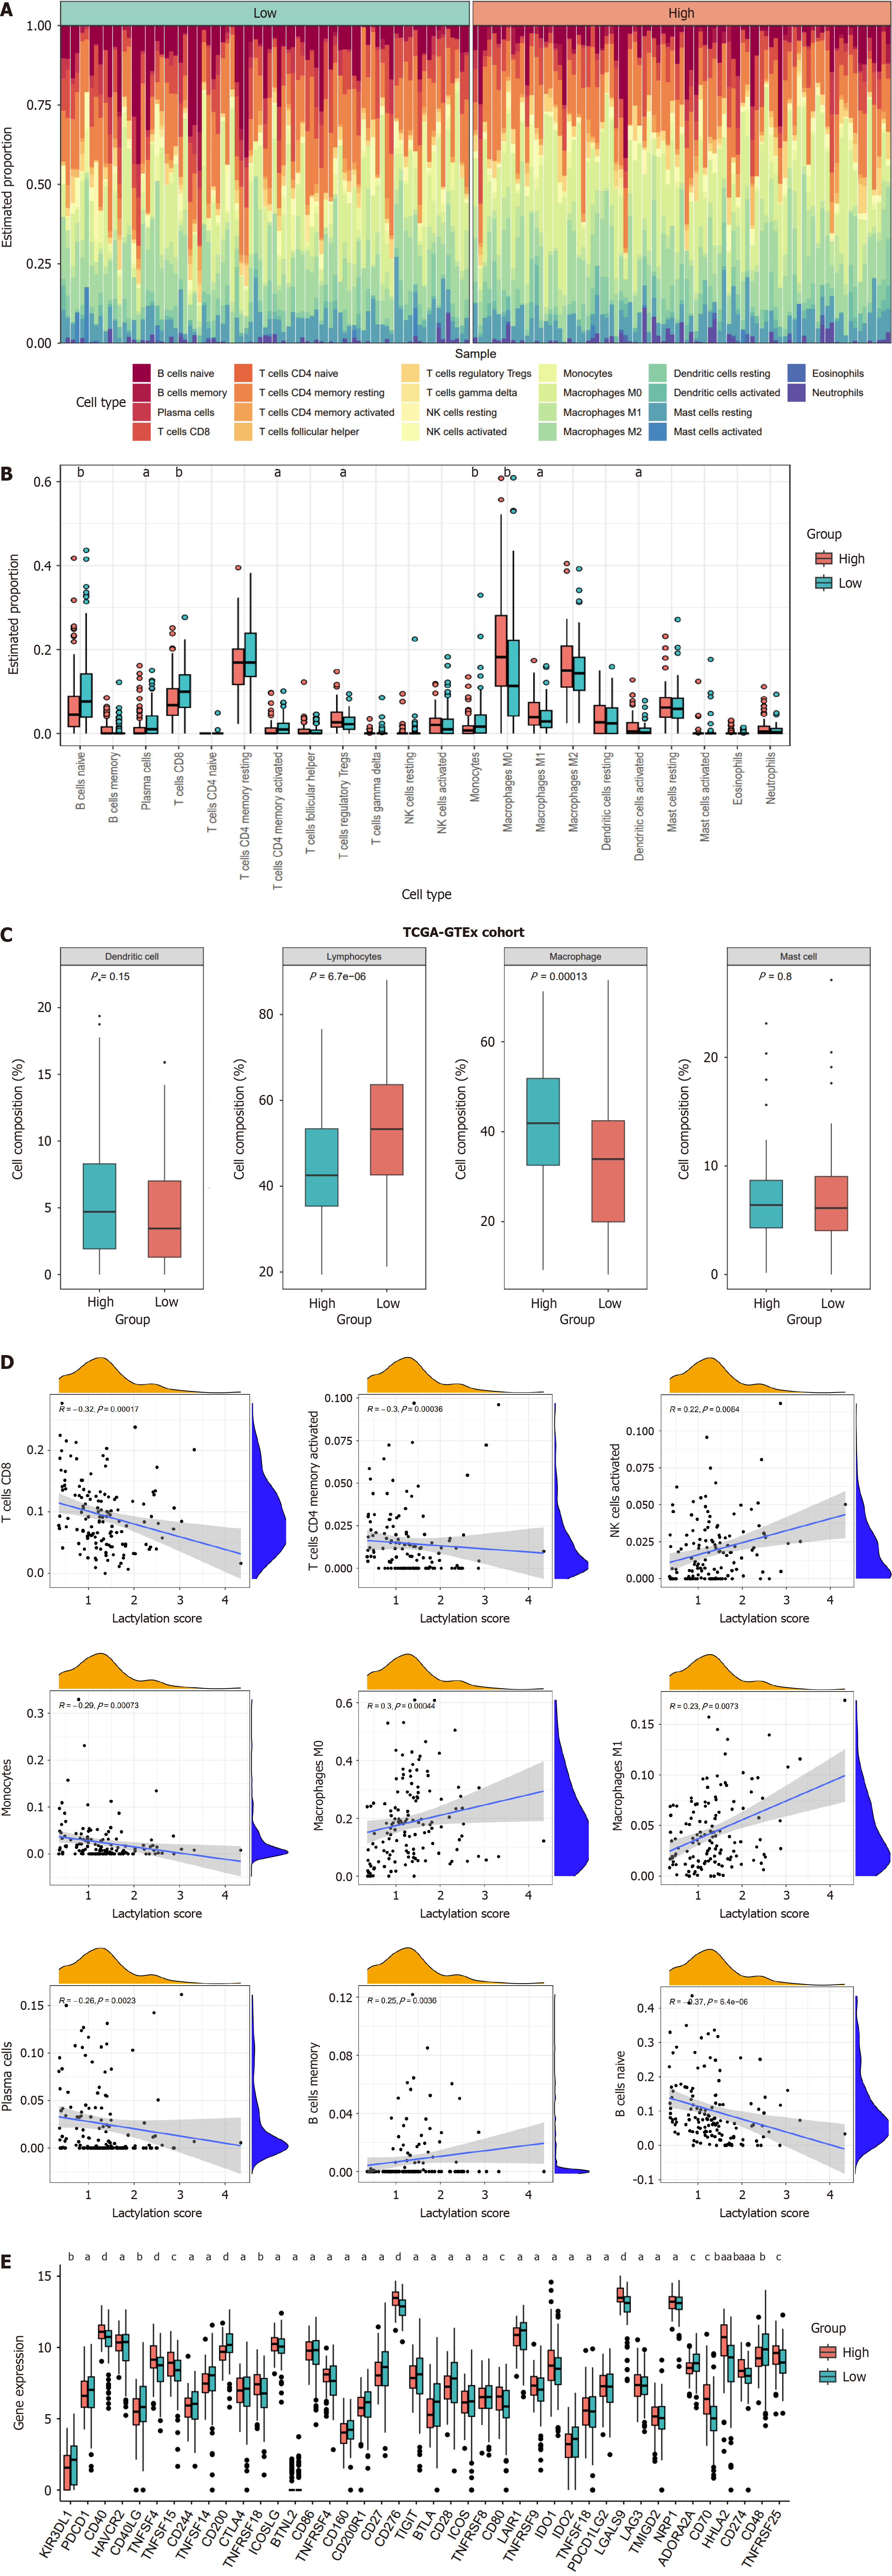
Figure 6 Different immune landscapes between the two subgroups.
A: The heatmap displaying immune infiltration of different subgroups; B: Comparison of immune infiltration between lactylation-score-high and lactylation-score-low groups; C: Four main categories of immune cell types between subgroups; D: Correlations between lactylation score and immune cell types; E: Differences of immune checkpoints between two subgroups. aP < 0.05, bP < 0.01, cP < 0.001, dP < 0.0001.
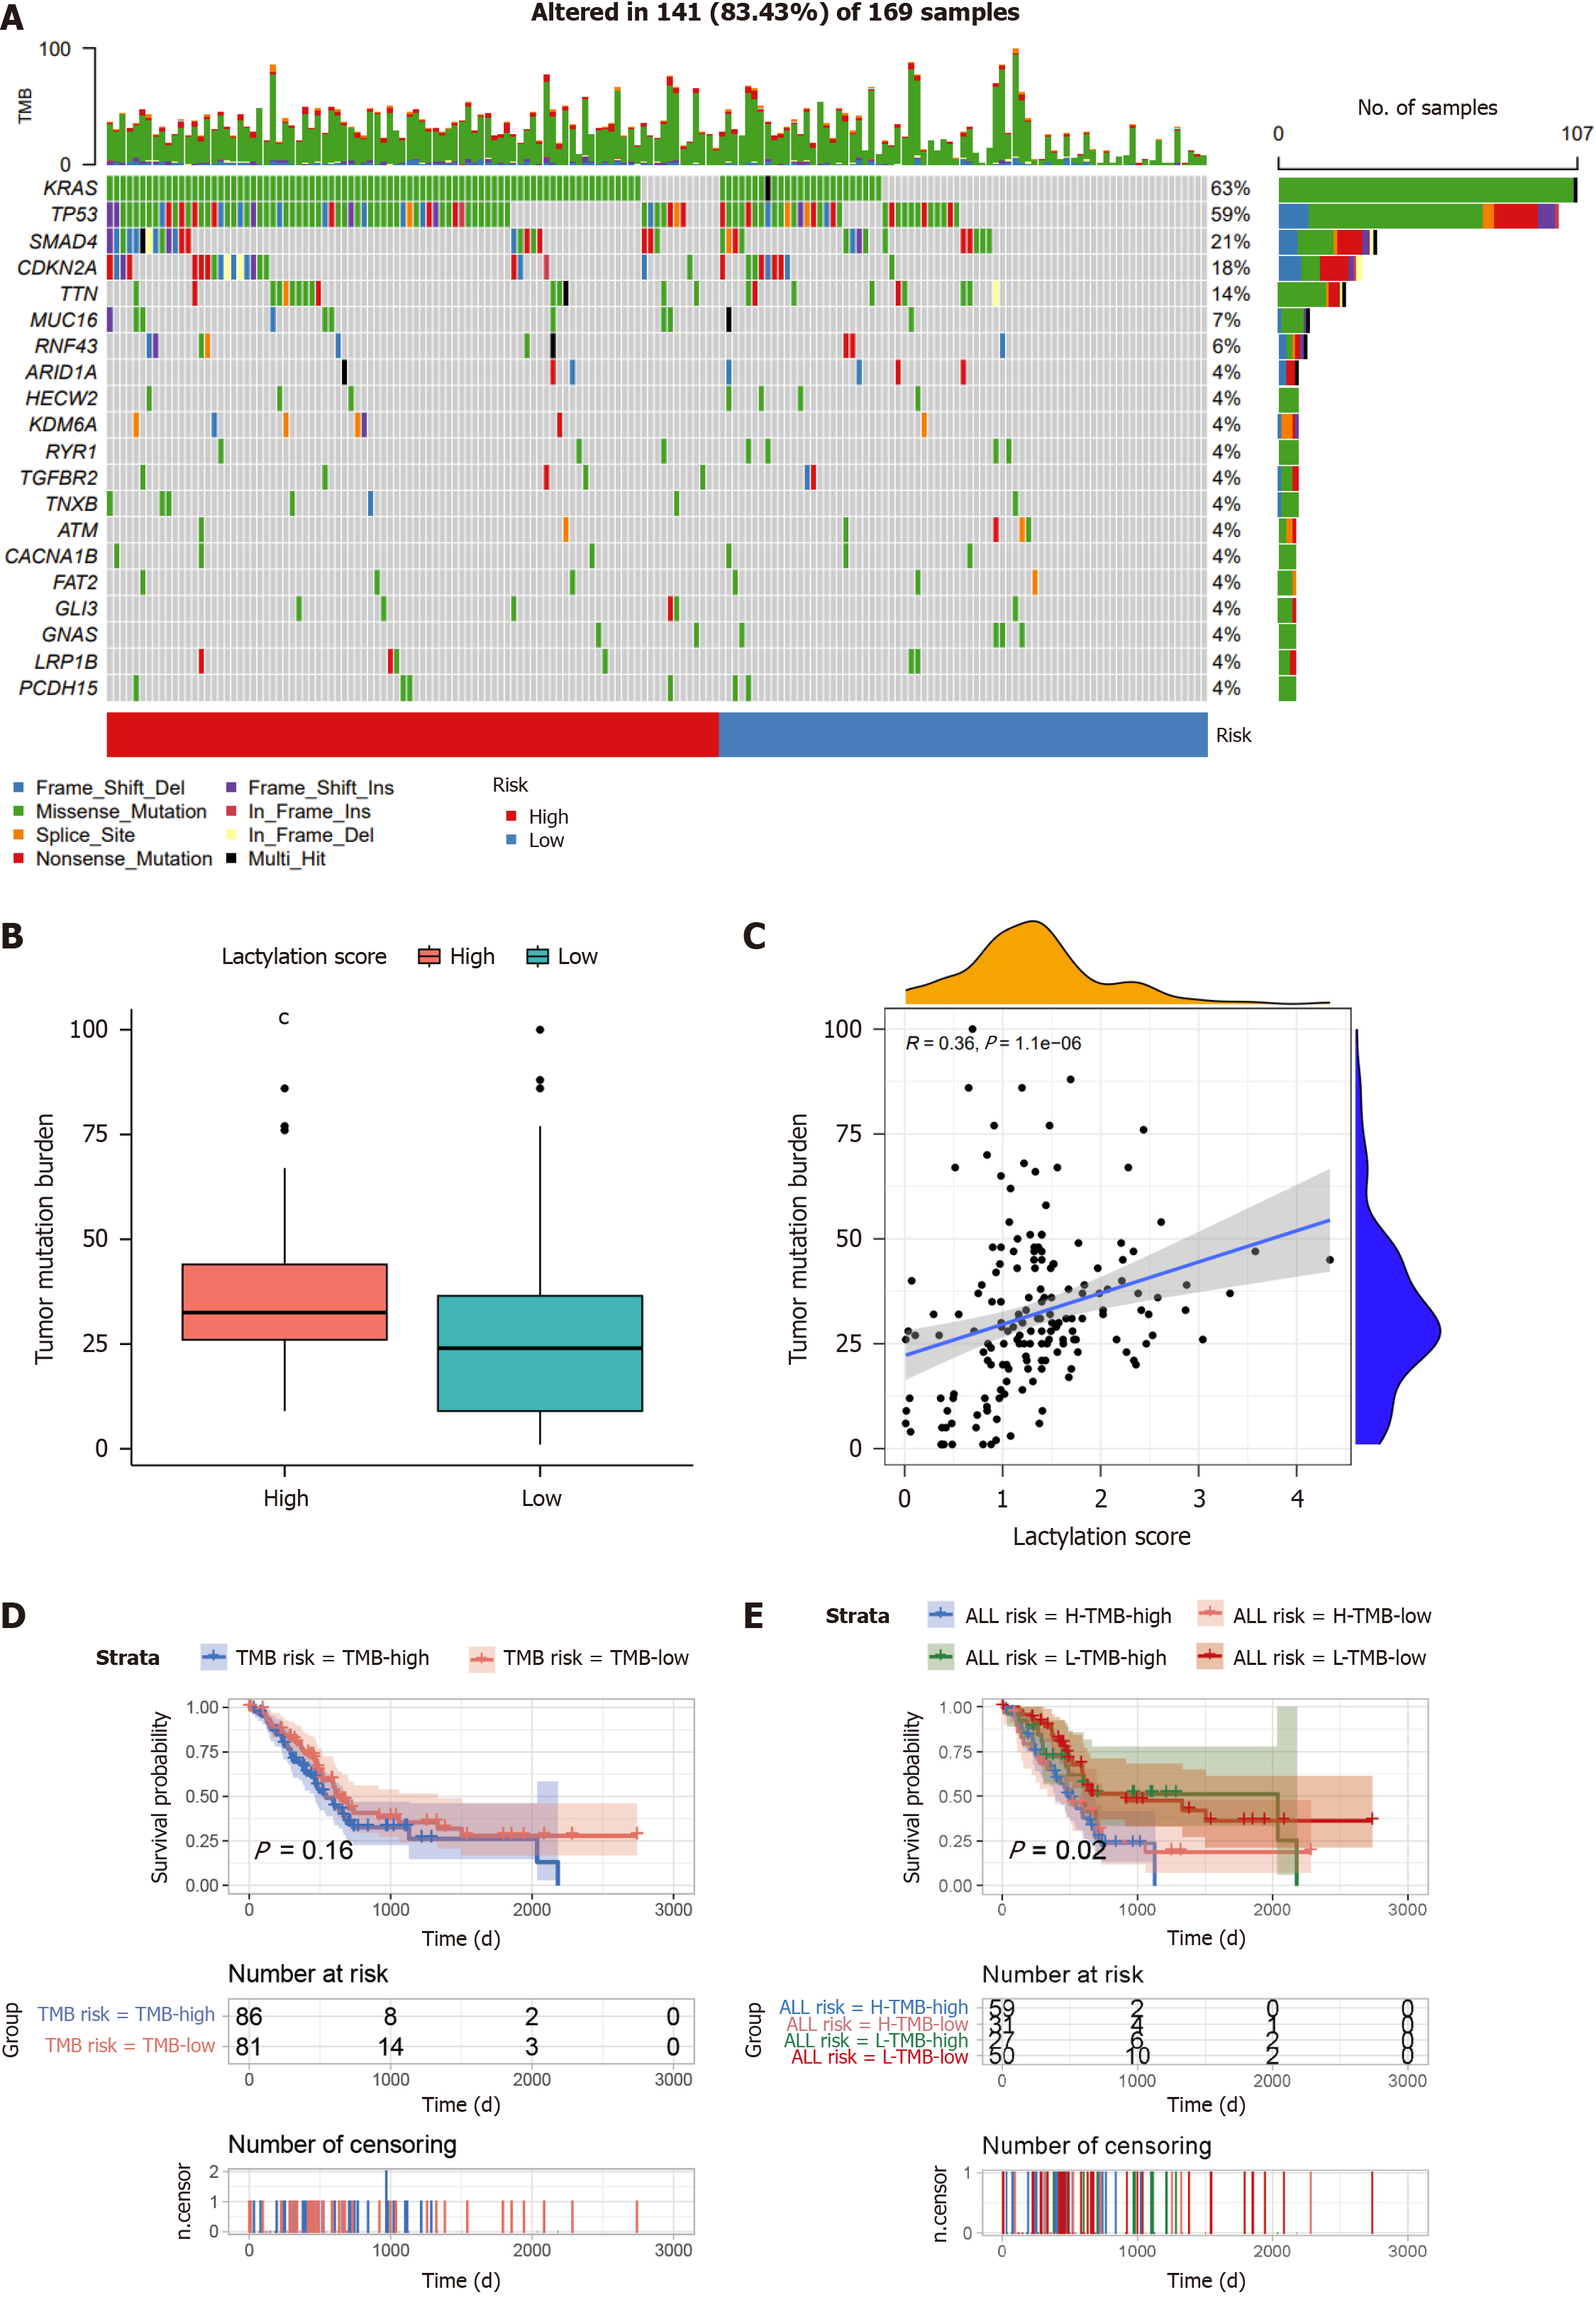
Figure 7 Comprehensive analysis of the lactylation score in pancreatic ductal adenocarcinoma.
A: The waterfall plot of somatic mutation features between subgroups; B: Tumor mutation burden (TMB) between different groups; C: Correlation analysis of TMB and lactylation score; D: Kaplan-Meier survival analysis of TMB; E: Kaplan-Meier survival analysis of TMB combined with lactylation score. cP < 0.001.
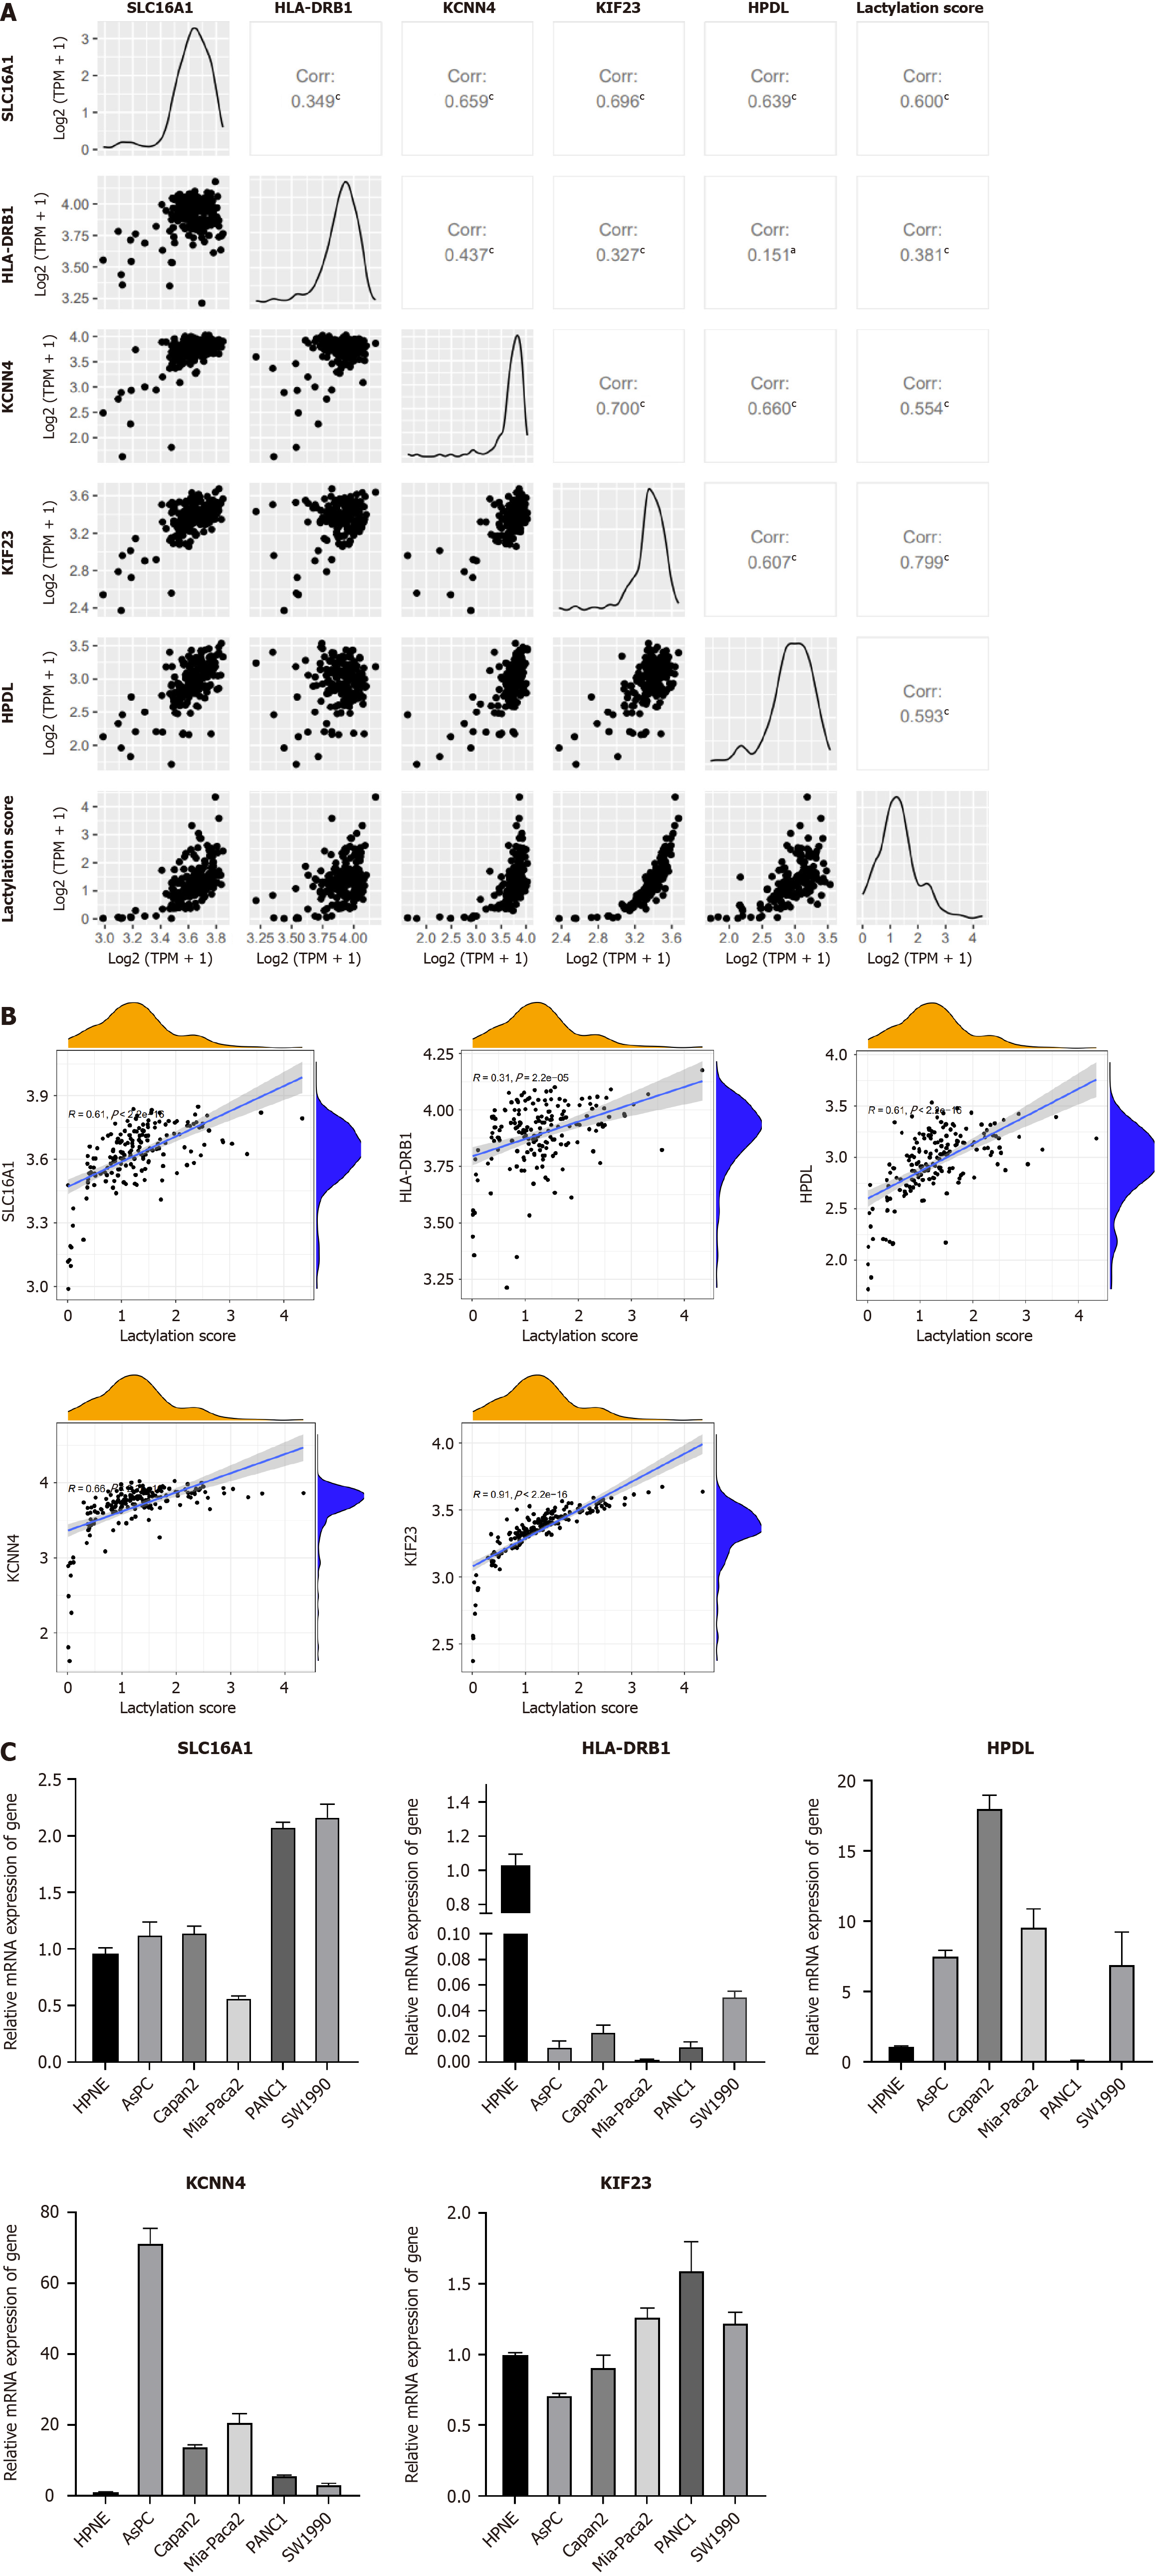
Figure 8 mRNA expression of lactylation-related genes.
A and B: Correlation between lactylation-related genes (LRGs) and lactylation score; C: MRNA expression of LRGs in normal and multiple pancreatic ductal adenocarcinoma cell lines (AsPC-1, Capan-2, MIA-Paca2, PANC-1, and SW1990). aP < 0.05, cP < 0.001.
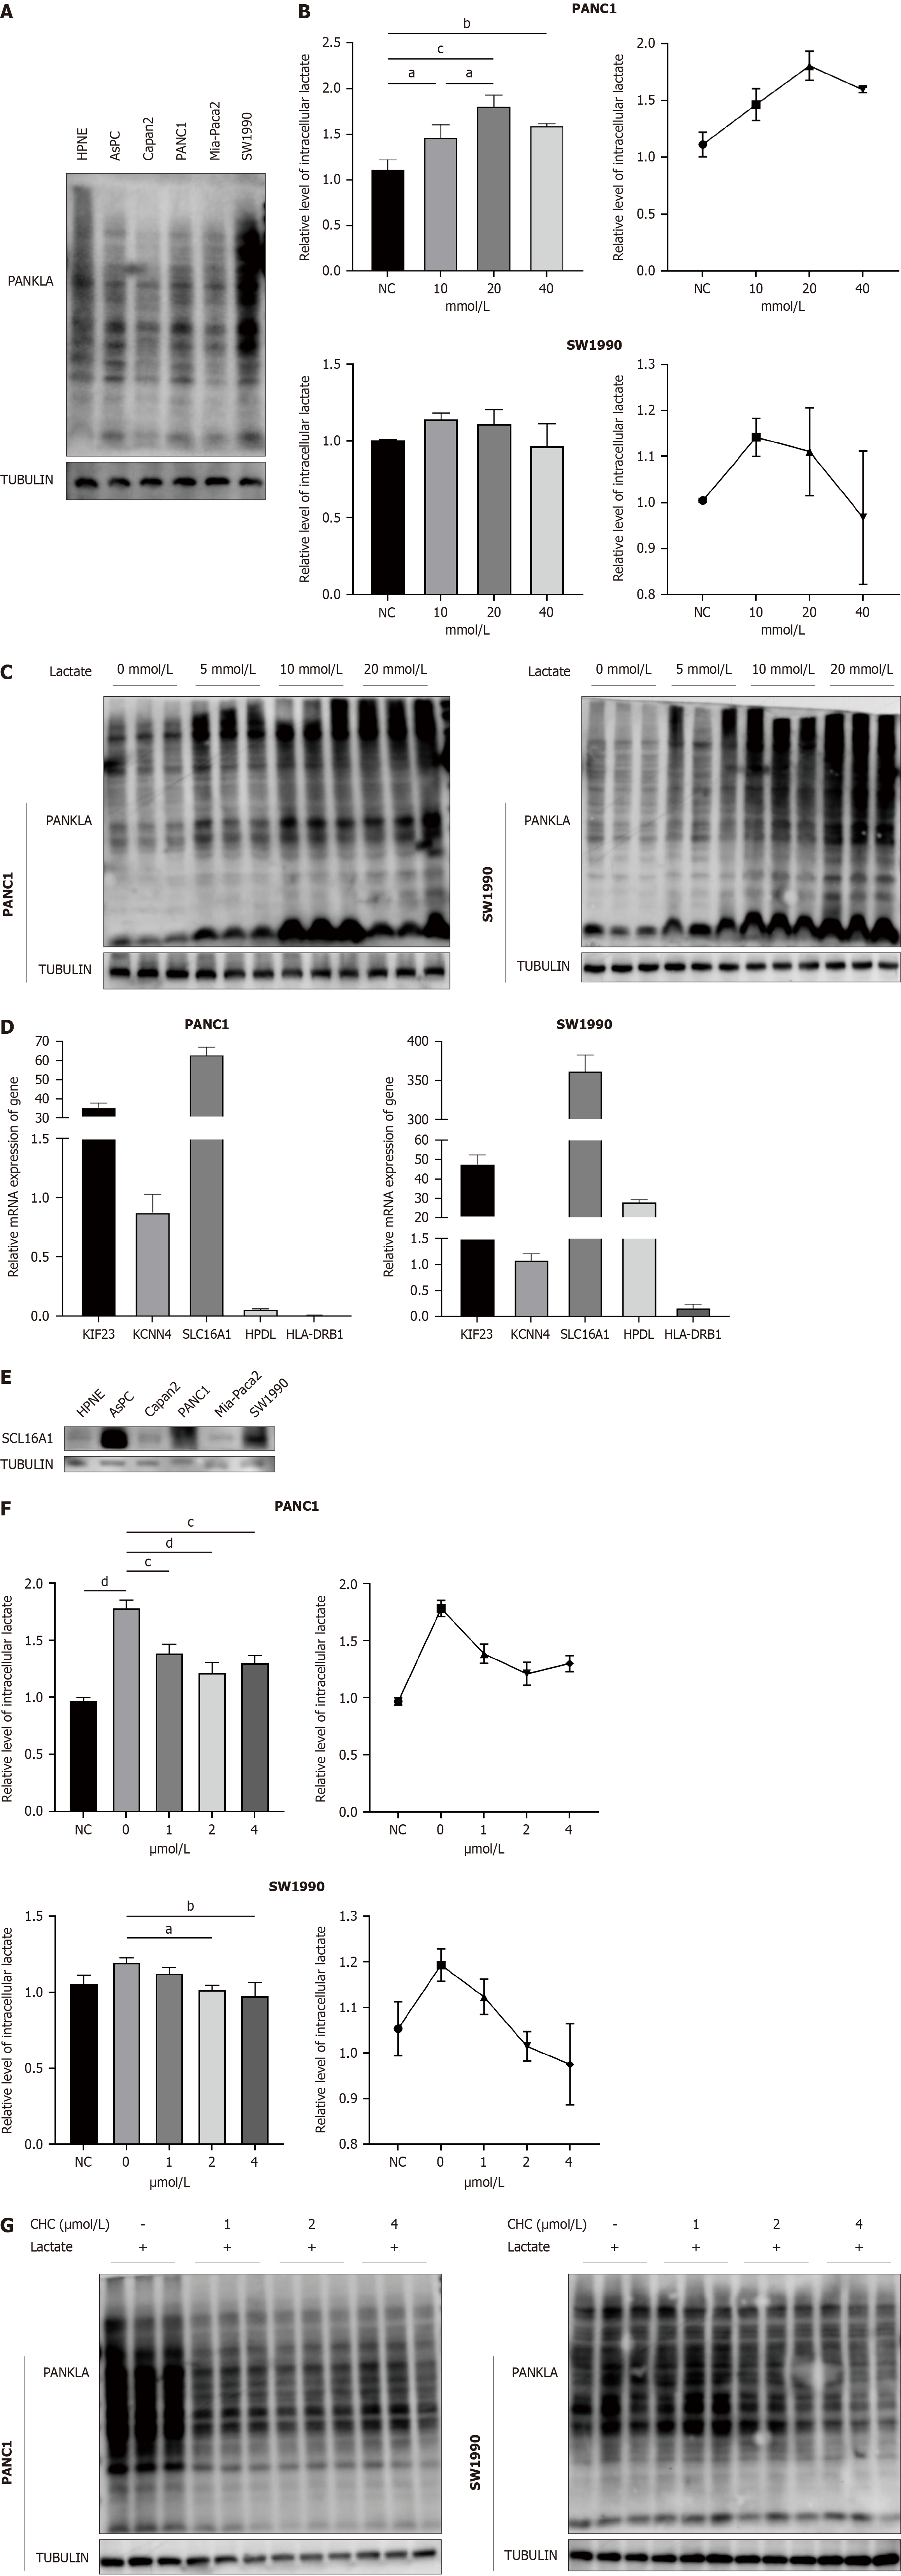
Figure 9 SLC16A1 promotes L-lactylation in pancreatic cancer.
A: L-lactylation levels in normal and pancreatic ductal adenocarcinoma (PDAC) cell lines; B and C: Intracellular lactate and western blotting of lactylation under different concentration of lactate; D: Expression of lactylation-related genes (LRGs) in normal and PDAC cell lines; E: Expression of SLC16A1 in normal and PDAC cell lines; F-G: Intracellular lactate and western blotting of lactylation treated with different concentration of α-cyano-4-hydroxycinnamic acid (CHC); H: Expression of histone L-lactylation in pancreatic cancer treated with lactate and CHC. aP < 0.05, bP < 0.01, cP < 0.001, dP < 0.0001. CHC: Α-cyano-4-hydroxycinnamic acid; PDAC: Pancreatic adenocarcinoma.
Figure 10 Inhibition of SLC16A1 expression reverses lactate-activated proliferation and migration.
A: Expression of L-lactylation treated with C646; B: Colony formation assays of lactate, α-cyano-4-hydroxycinnamic acid (CHC), and C646 in PANC1 and SW1990 cells; C: Transwell assays of lactate, CHC, and C646 in PANC1 and SW1990 cells; D: Wound-healing assay of lactate, CHC, and C646 in PANC1 and SW1990 cells; E: Diagram of experimentation in vivo; F and G: Tumor formation in nude mice treated with CHC; H: Expression of L-lactyl in a xenograft of mice; I: Expression levels of L-lactyl in a xenograft of mice using immunofluorescence. Scale bar, 200 μm. aP < 0.05, bP < 0.01, cP < 0.001, dP < 0.0001. CHC: Α-cyano-4-hydroxycinnamic acid; NC: Negative control.
- Citation: Peng T, Sun F, Yang JC, Cai MH, Huai MX, Pan JX, Zhang FY, Xu LM. Novel lactylation-related signature to predict prognosis for pancreatic adenocarcinoma. World J Gastroenterol 2024; 30(19): 2575-2602
- URL: https://www.wjgnet.com/1007-9327/full/v30/i19/2575.htm
- DOI: https://dx.doi.org/10.3748/wjg.v30.i19.2575


