Copyright
©The Author(s) 2024.
World J Gastroenterol. Apr 21, 2024; 30(15): 2128-2142
Published online Apr 21, 2024. doi: 10.3748/wjg.v30.i15.2128
Published online Apr 21, 2024. doi: 10.3748/wjg.v30.i15.2128
Figure 1 The workflow of radiomics, including volume of interest delineation, feature extraction, feature selection, and model building and evaluation.
VOI: Volume of interest.
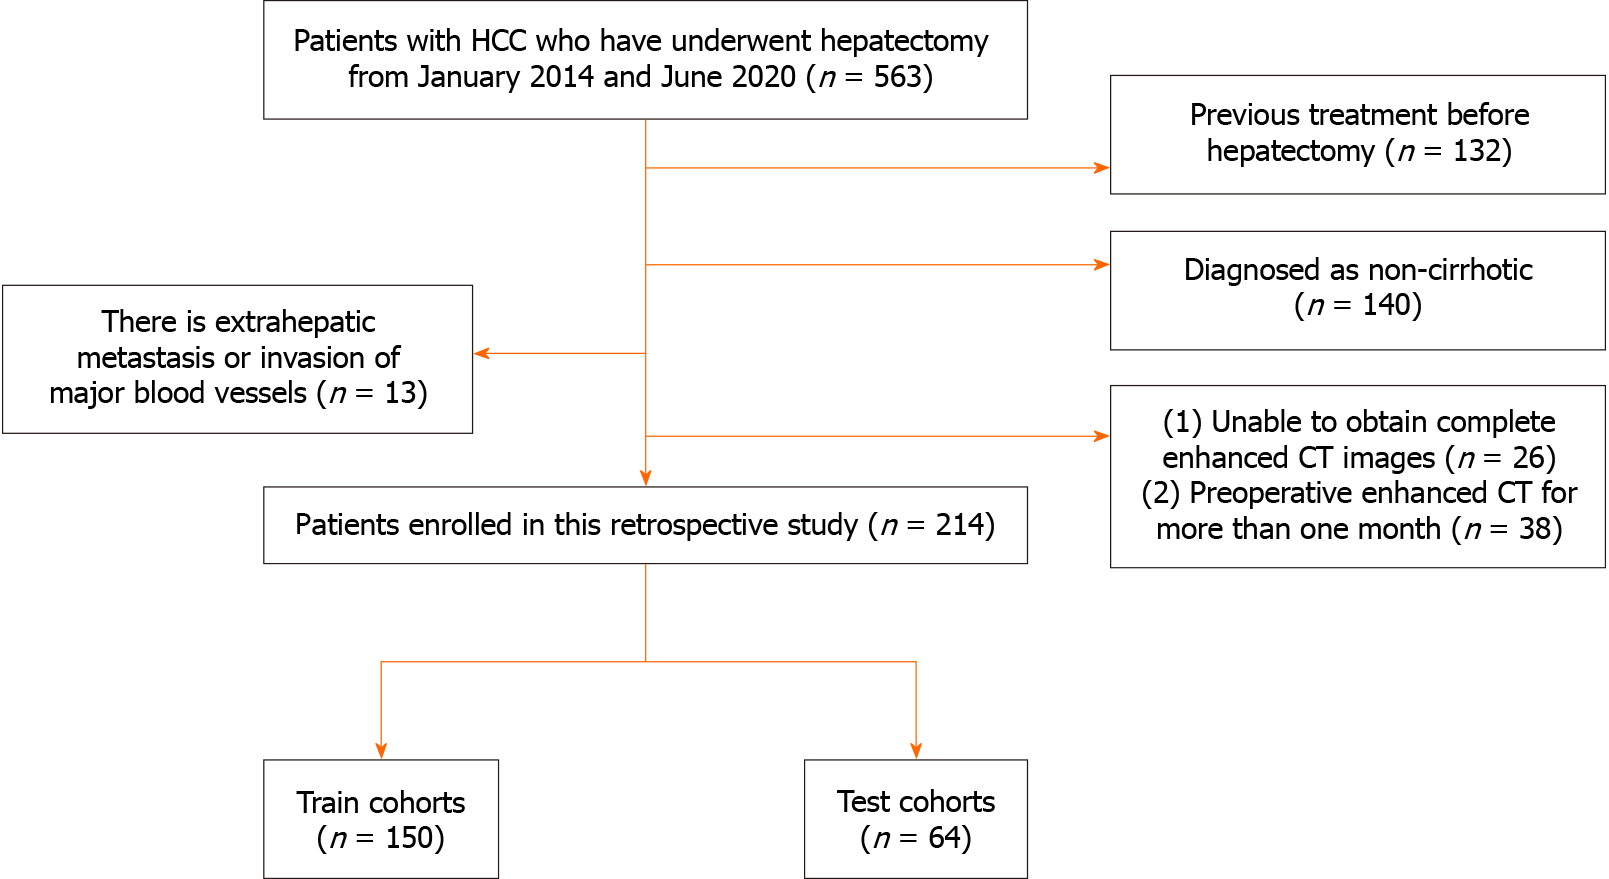
Figure 2 Flowchart illustrating the inclusion and exclusion of patients.
HCC: Hepatocellular carcinoma; CT: Computed tomography.
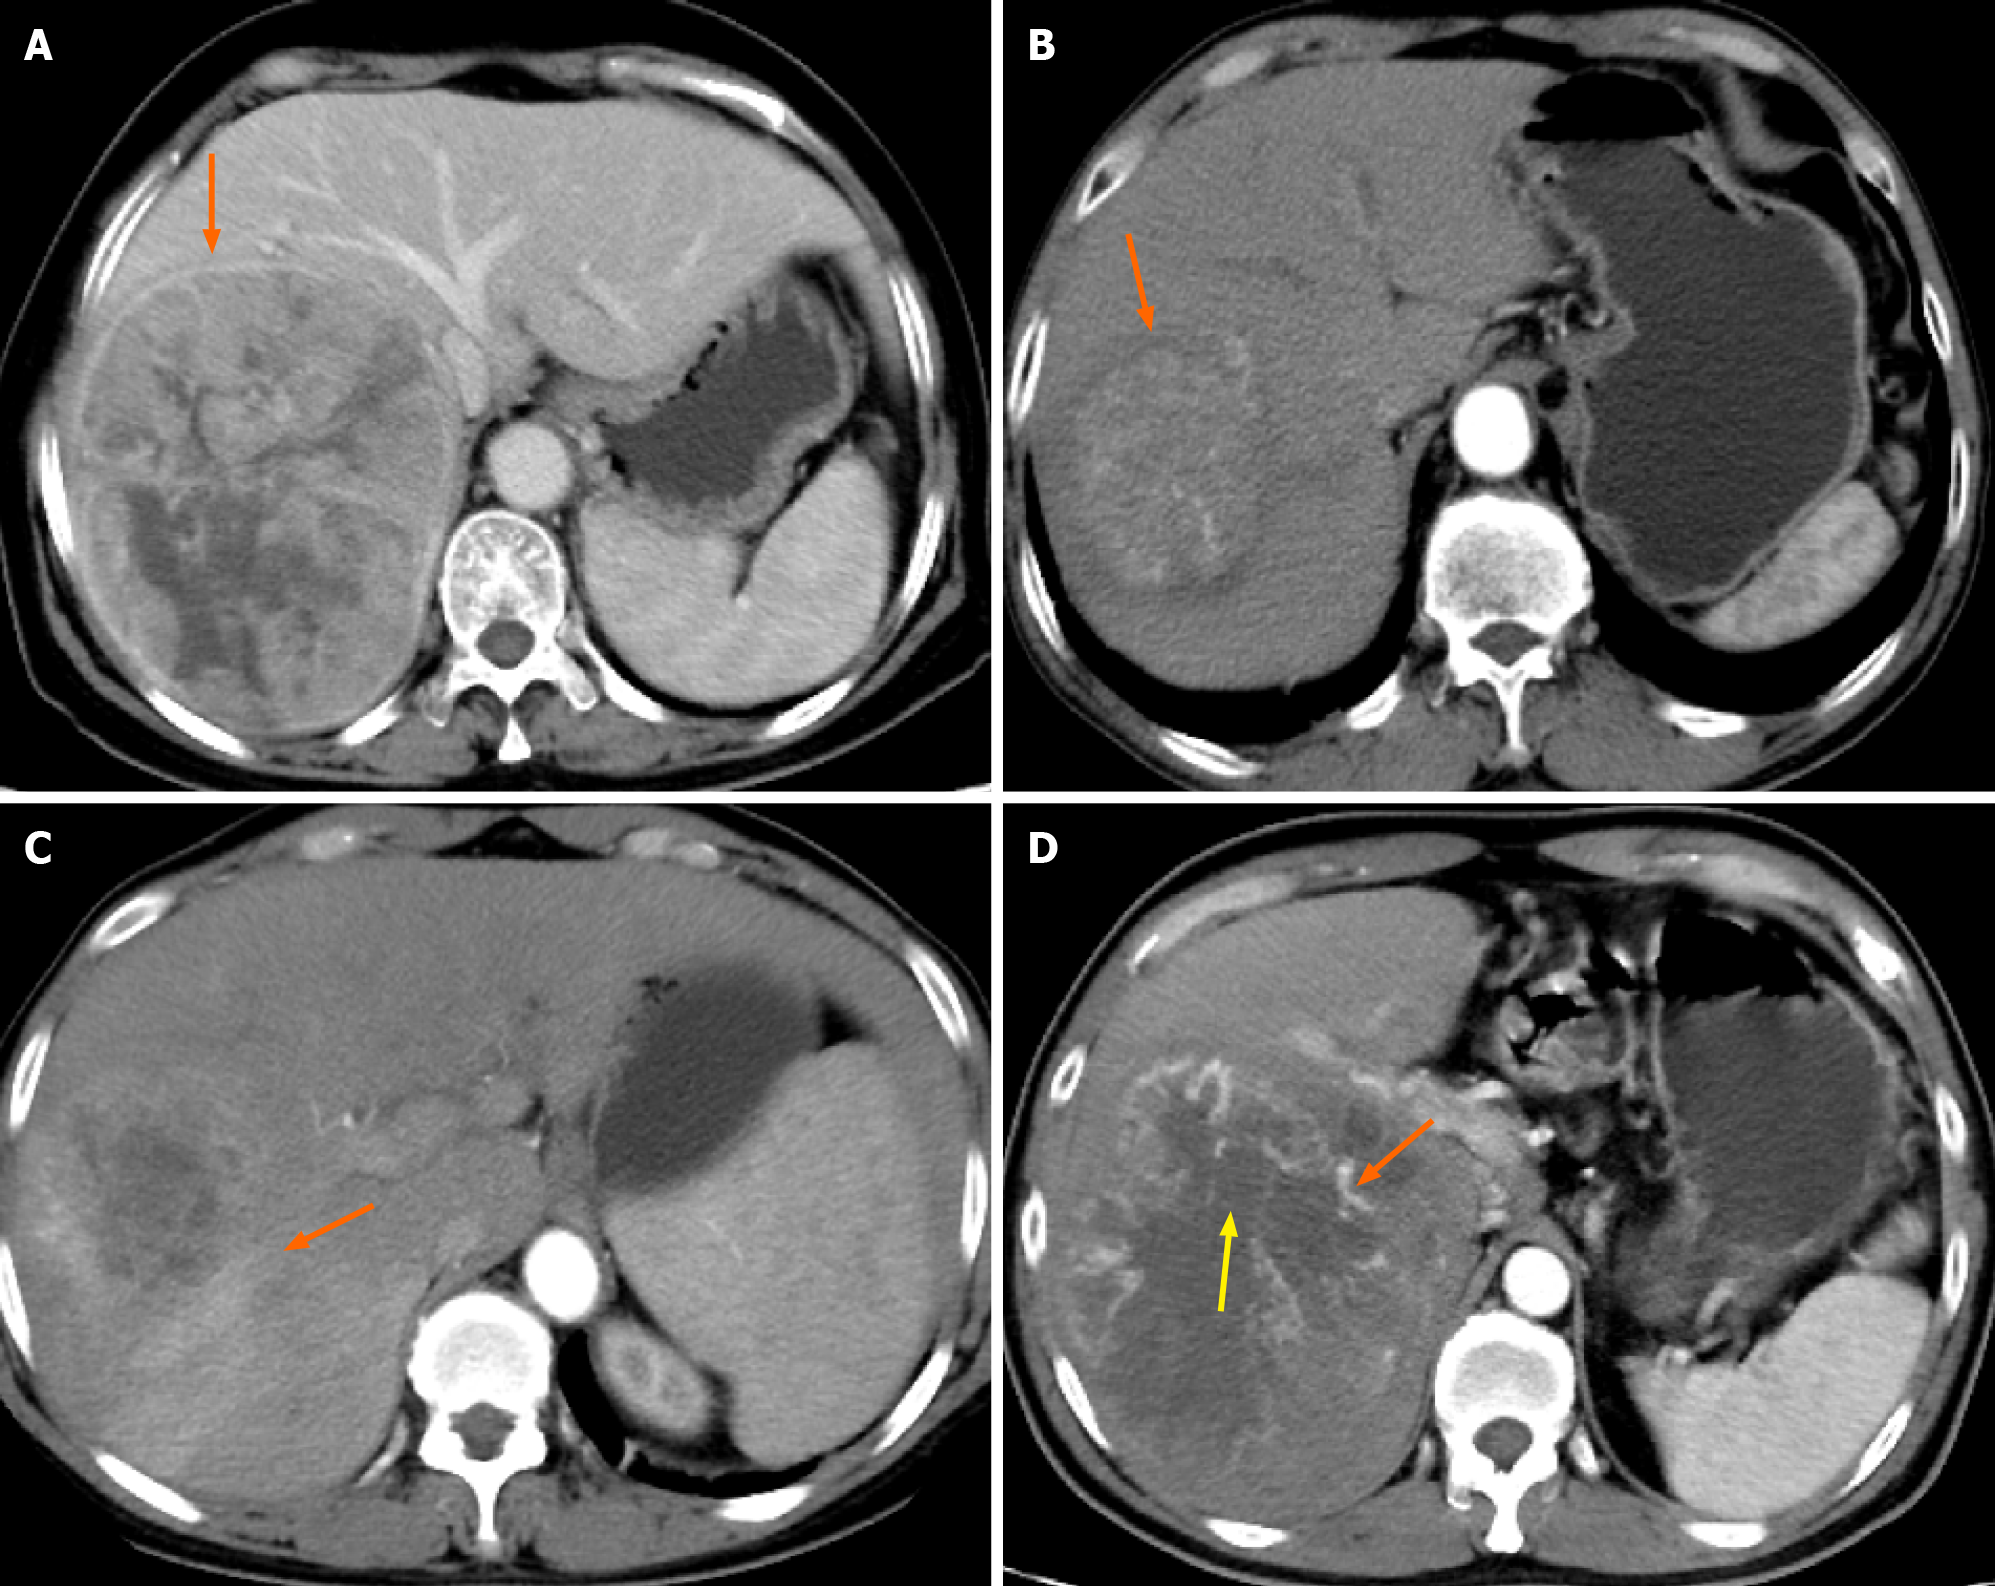
Figure 3 Example of the typical computed tomography images of the semantic features.
A: The tumour capsule is observed in the direction indicated by the arrow, with a ring-like high-density appearance around the tumour in the portal phase; B: Smooth tumour margins are observed in the direction of arrows; C: Peritumoural enhancement is visible in the direction of the arrow, characterised by a patchy, high-density area outside the tumour range in the arterial phase; D: Intratumour necrosis within the tumour is observed in the direction of the red arrow, demonstrating a low-density area in the arterial phase. Additionally, the yellow arrow highlights intratumour vascularity, appearing as a linear high-density area within the arterial phase.
Figure 4 Receiver operating characteristic curve for three radiomics models developed using support vector machine.
A: The performance of the three radiomics models in the training cohort; B: The performance of the three models in the validation cohort reveals that the area under the curve of Model 3 was 0.762, and its performance was better than that of Models 1 and 2. AUC: Area under the curve.
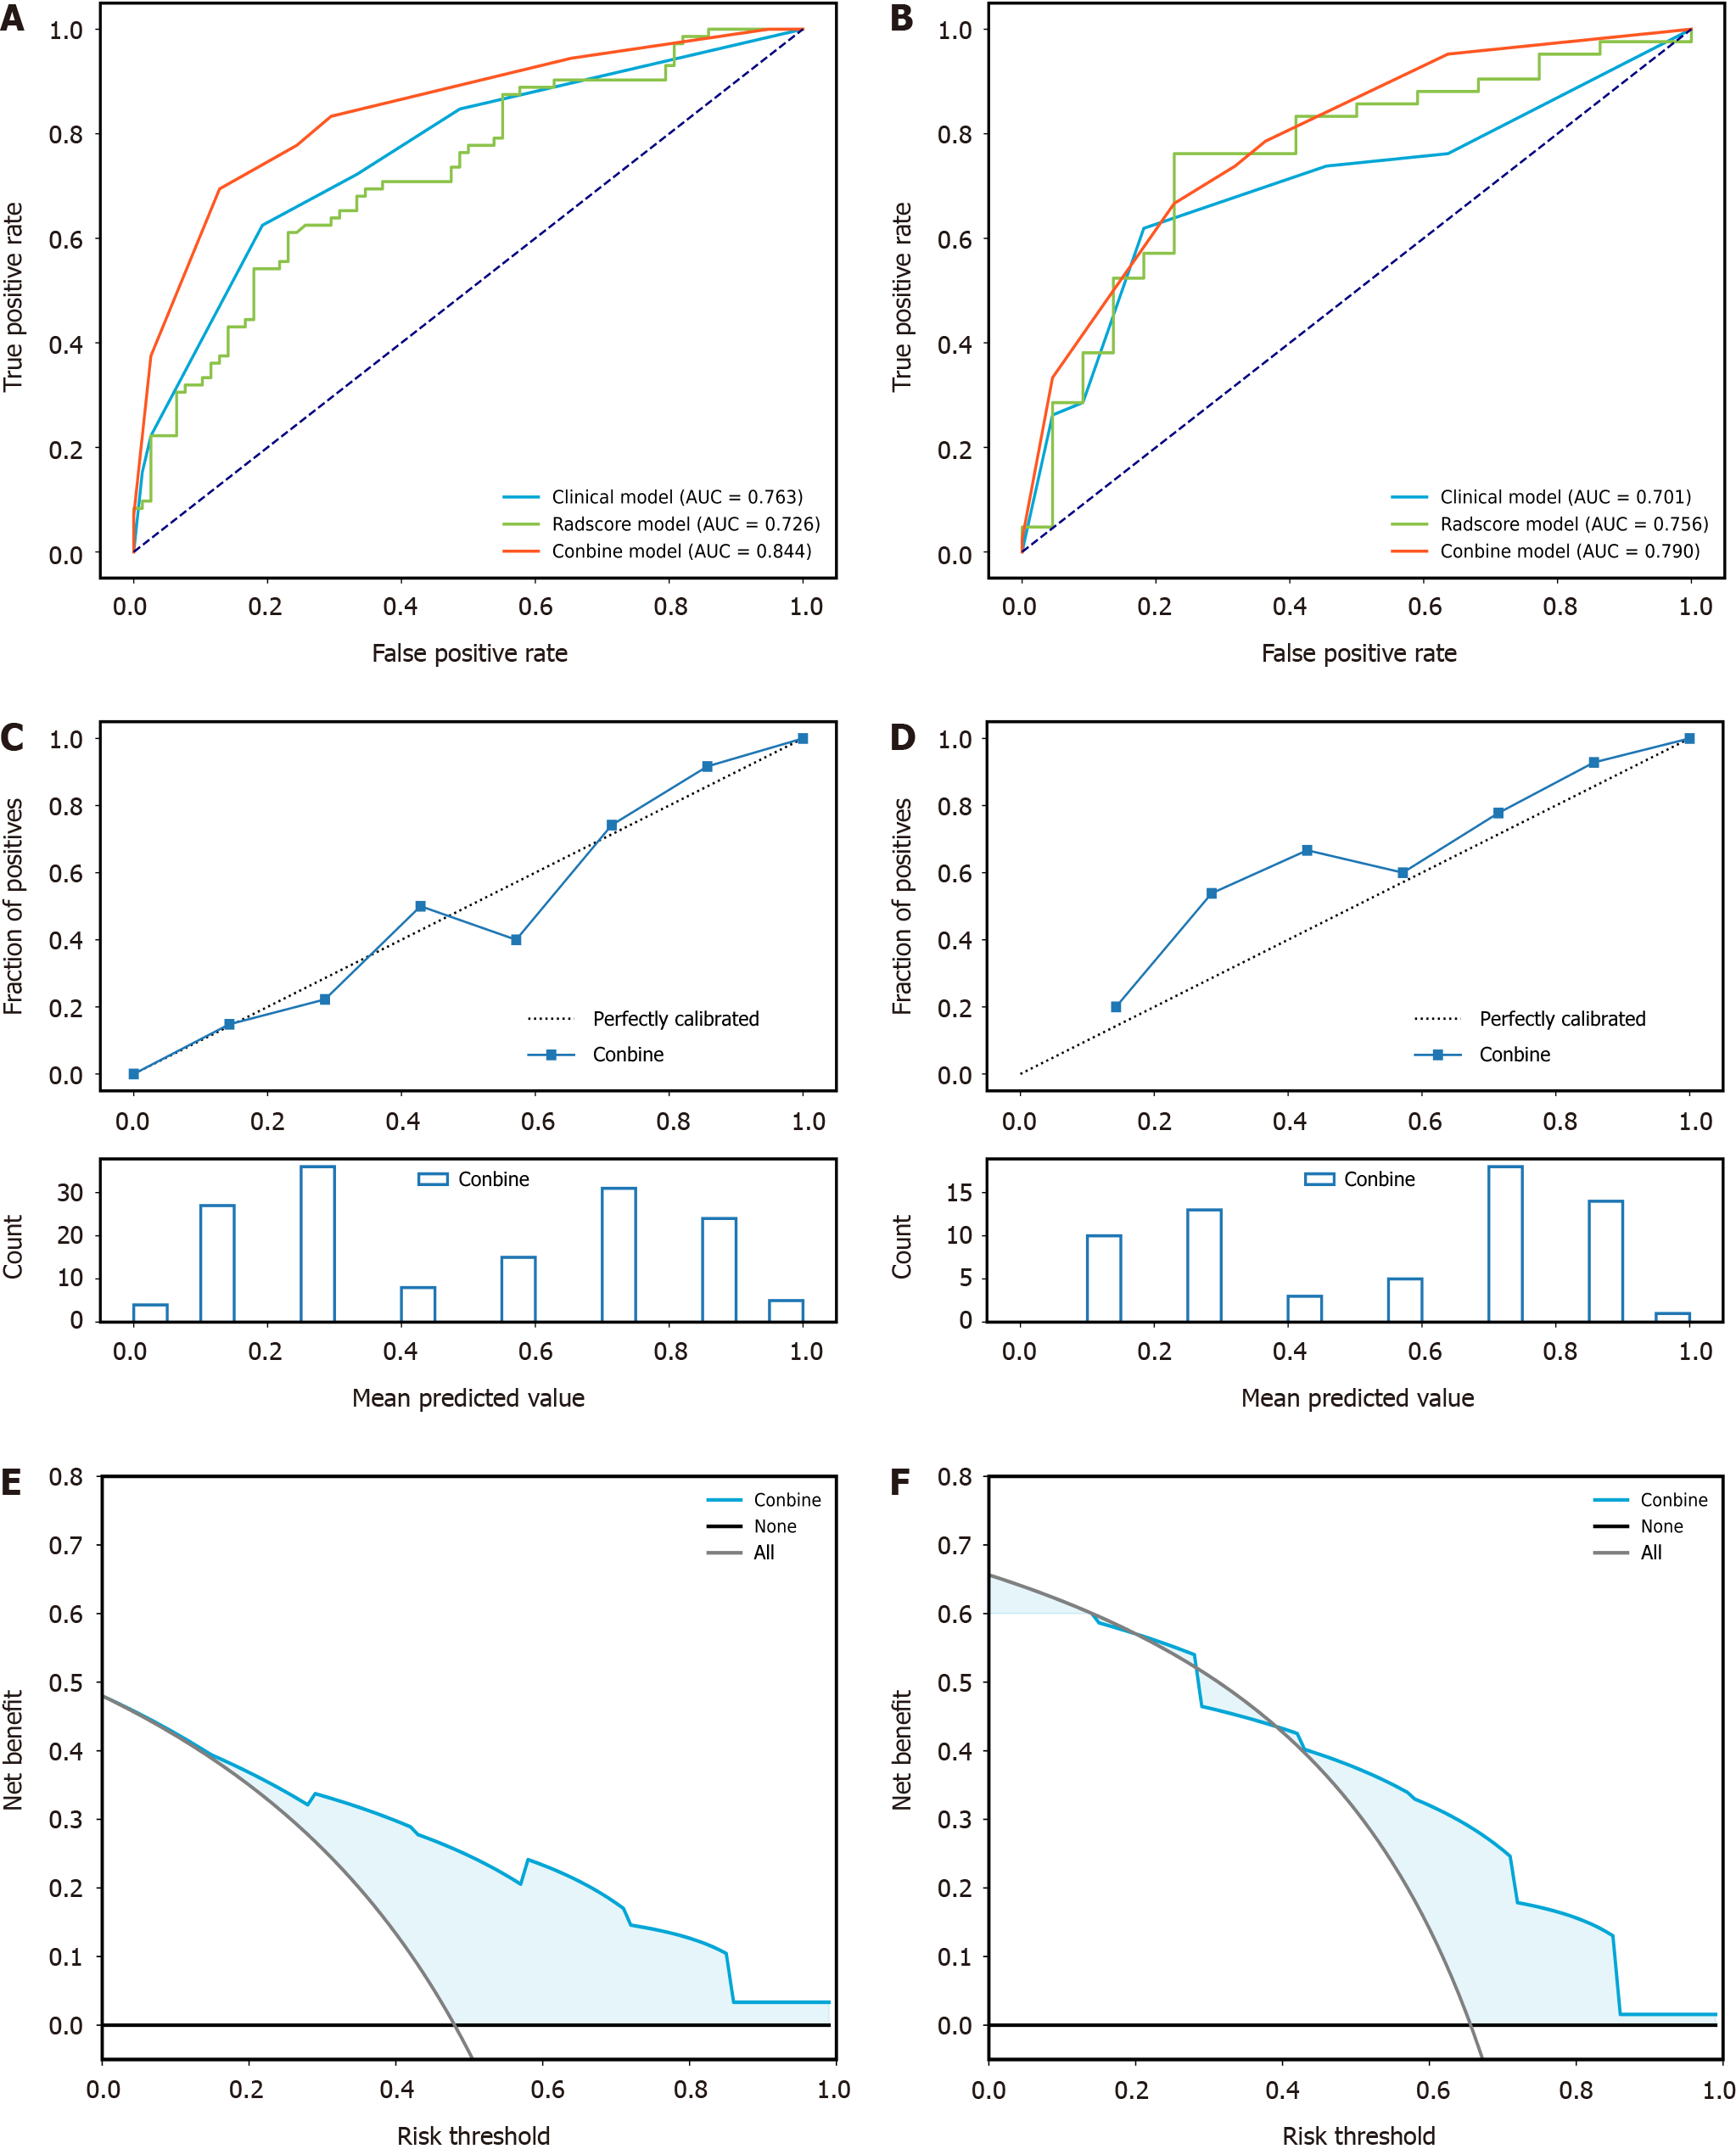
Figure 5 Receiver operating characteristic of the clinical-radiologic model established by K-Nearest Neighbour, radiomics model established by support vector machine, and the combined model established by K-Nearest Neighbour.
A: The area under the curve (AUC) values of the clinical-radiologic, radiomics, and combined models in the training cohort were 0.763, 0.726, and 0.844, respectively; B: In the validation cohort, the AUC values of the clinical-radiologic, radiomics, and combined models were 0.701, 0.756, and 0.790, respectively; C: Calibration curve performance of the combined model in the training cohort; D: Combined model calibration curve in the validation cohort; E: Decision curve analysis (DCA) of the combined model in the training cohort; F: DCA of the combined model in the validation cohort. AUC: Area under the curve.
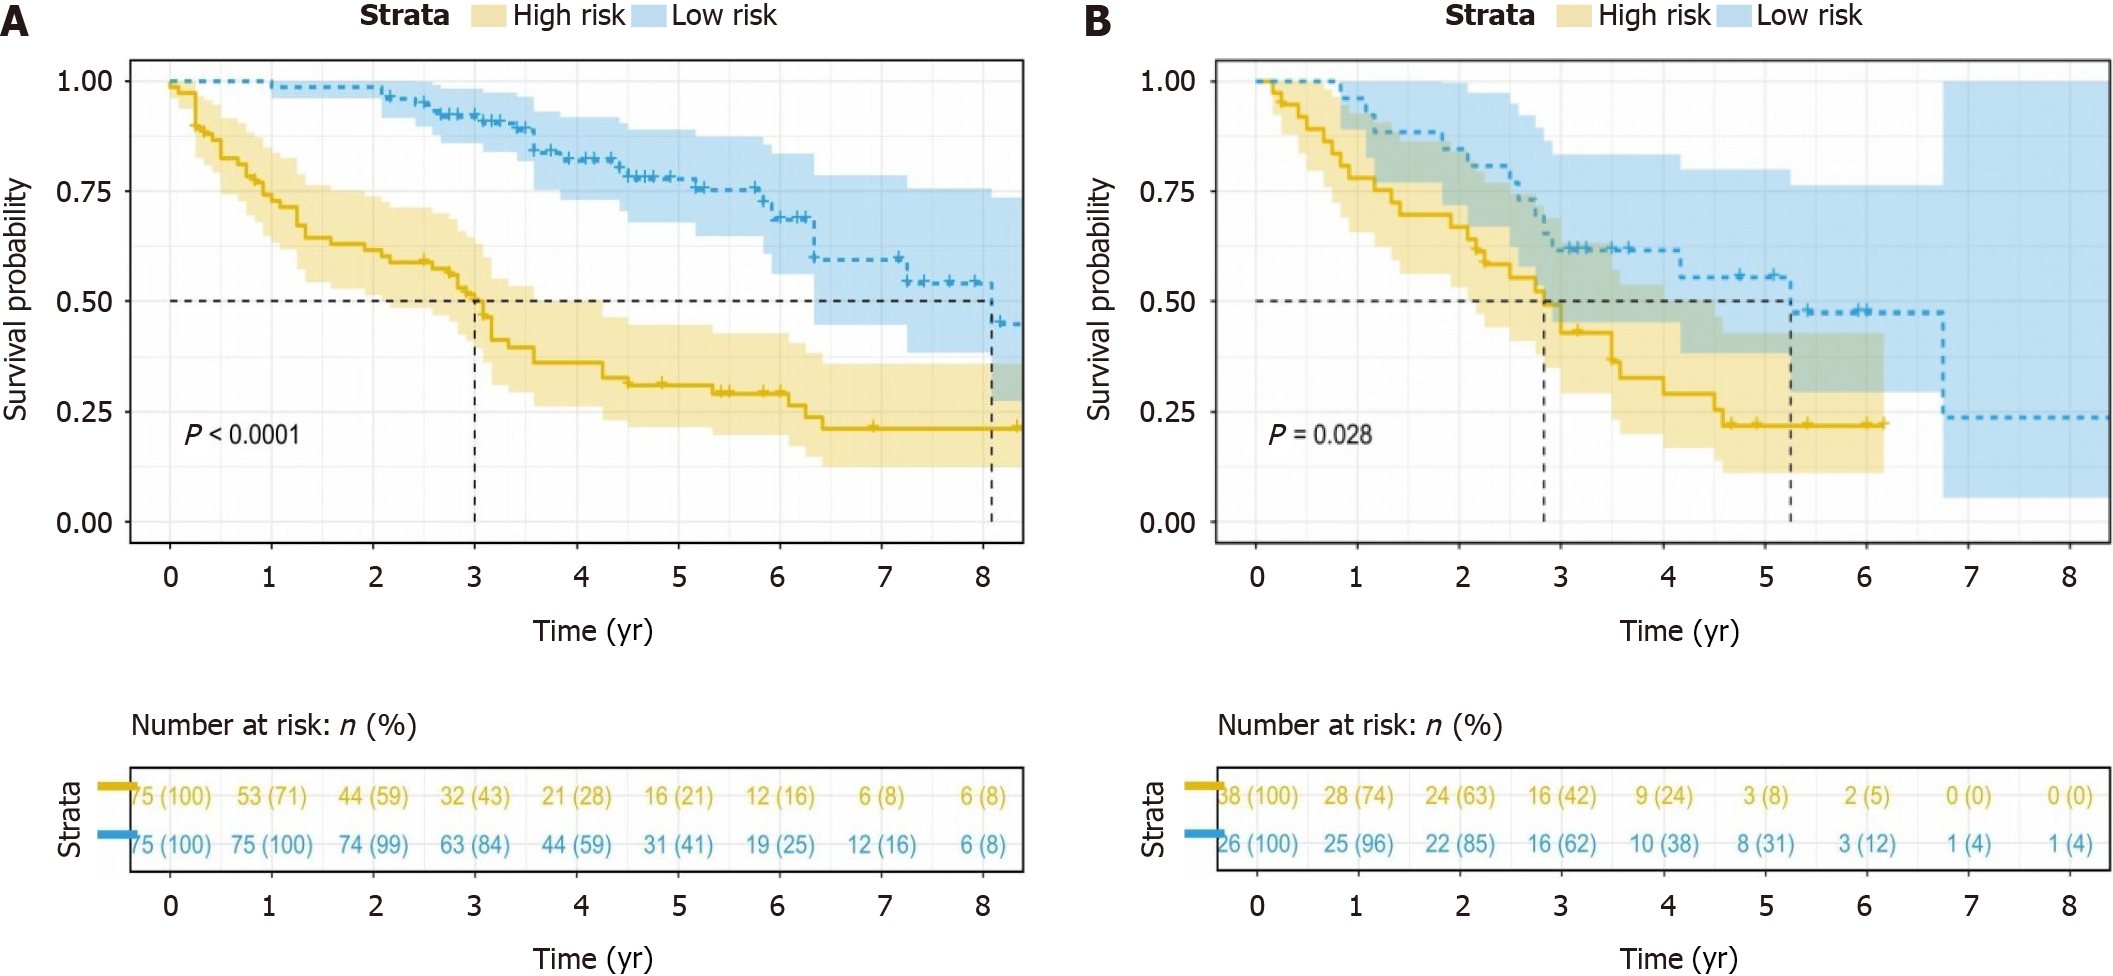
Figure 6 Kaplan-Meier curve analysis of the overall survival of patients stratified based on the best Youden index after hepatectomy.
The high-risk and low-risk groups had scores > 0.53 and < 0.53, respectively. A: In the training cohort, the median overall survival (OS) was 3.00 and 8.08 years for the high-risk and low-risk groups, respectively (P < 0.0001); B: In the validation cohort, the median OS was 2.83 and 5.25 years for the high-risk and low-risk groups, respectively (P = 0.028).
- Citation: Qian GX, Xu ZL, Li YH, Lu JL, Bu XY, Wei MT, Jia WD. Computed tomography-based radiomics to predict early recurrence of hepatocellular carcinoma post-hepatectomy in patients background on cirrhosis. World J Gastroenterol 2024; 30(15): 2128-2142
- URL: https://www.wjgnet.com/1007-9327/full/v30/i15/2128.htm
- DOI: https://dx.doi.org/10.3748/wjg.v30.i15.2128


