Copyright
©The Author(s) 2024.
World J Gastroenterol. Apr 7, 2024; 30(13): 1887-1898
Published online Apr 7, 2024. doi: 10.3748/wjg.v30.i13.1887
Published online Apr 7, 2024. doi: 10.3748/wjg.v30.i13.1887
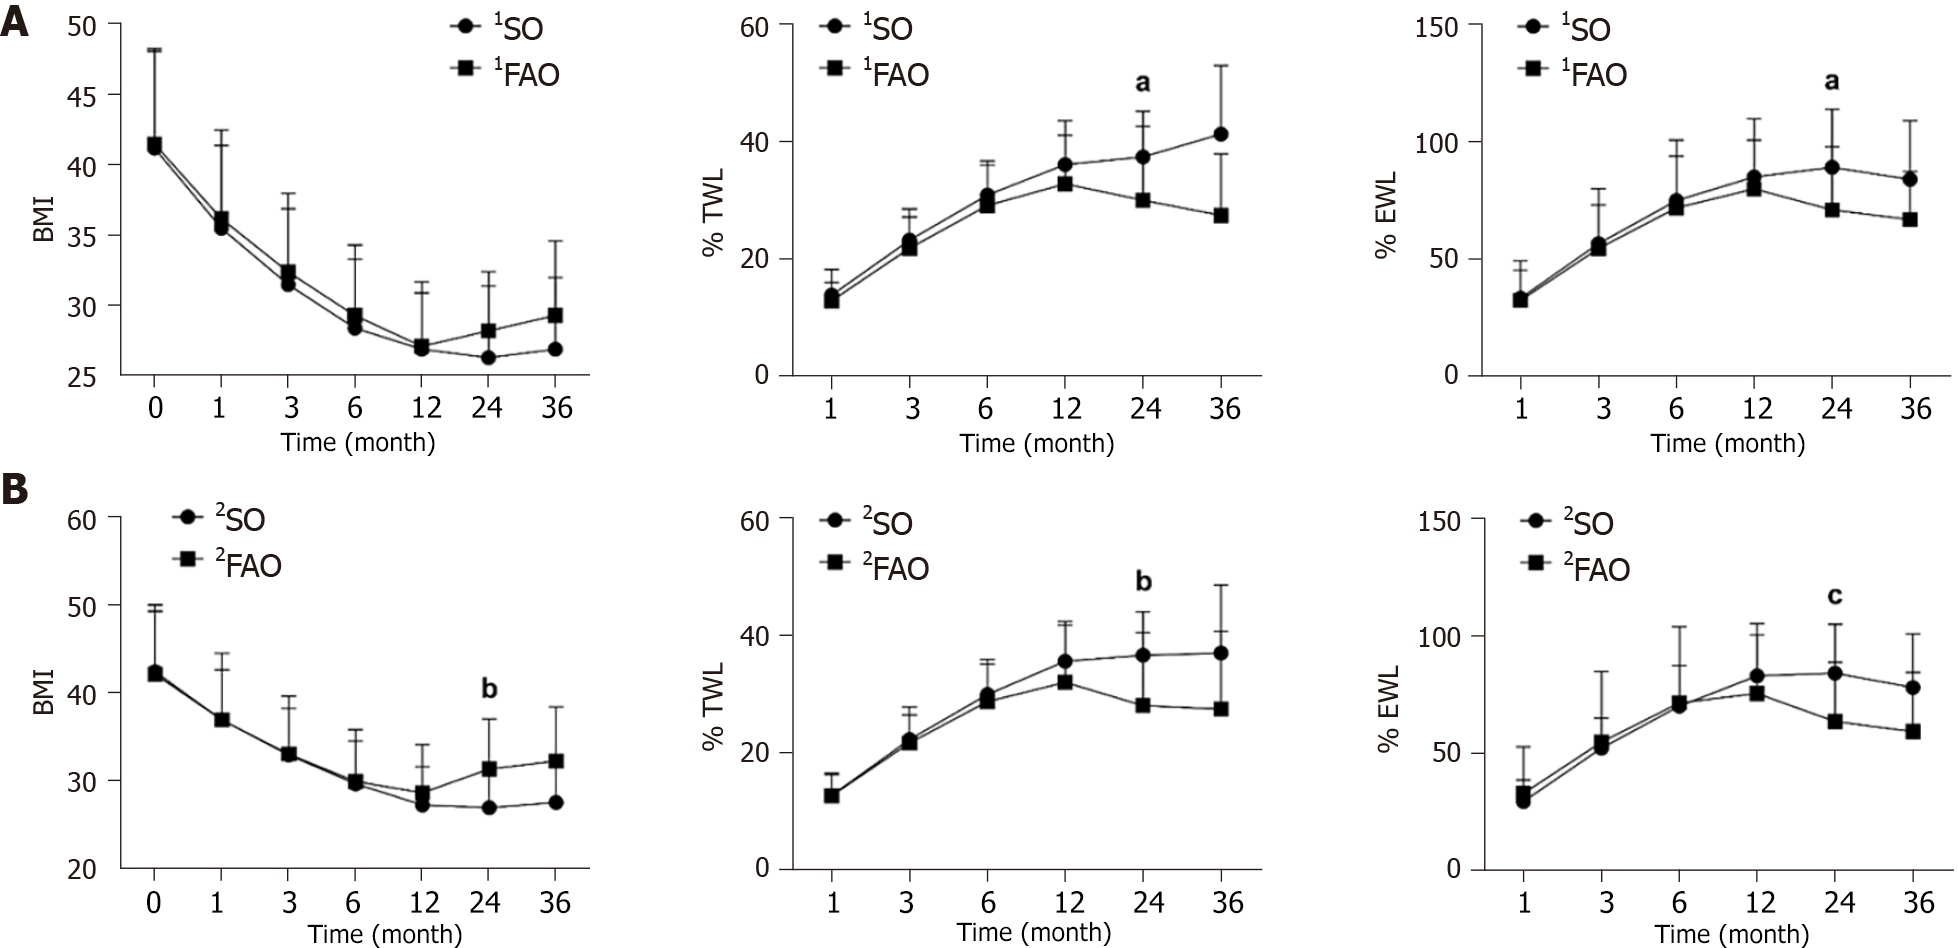
Figure 1 Line graphs depicting postoperative alterations in body mass index, total weight loss percentage, excess weight loss percentage for patients.
A: In the 1familial aggregation of obesity (FAO)/1sporadic obesity (SO) groups; B: In the 2FAO/2SO groups. aP < 0.05; bP < 0.01; cP < 0.001. SO: Sporadic obesity; FAO: Familial aggregation of obesity; %TWL: Total weight loss percentage; %EWL: Excess weight loss percentage; M: Month; BMI: Body mass index.
- Citation: Wang ZY, Qu YF, Yu TM, Liu ZL, Cheng YG, Zhong MW, Hu SY. Novel subtype of obesity influencing the outcomes of sleeve gastrectomy: Familial aggregation of obesity. World J Gastroenterol 2024; 30(13): 1887-1898
- URL: https://www.wjgnet.com/1007-9327/full/v30/i13/1887.htm
- DOI: https://dx.doi.org/10.3748/wjg.v30.i13.1887


