Copyright
©The Author(s) 1997.
World J Gastroenterol. Sep 15, 1997; 3(3): 134-136
Published online Sep 15, 1997. doi: 10.3748/wjg.v3.i3.134
Published online Sep 15, 1997. doi: 10.3748/wjg.v3.i3.134
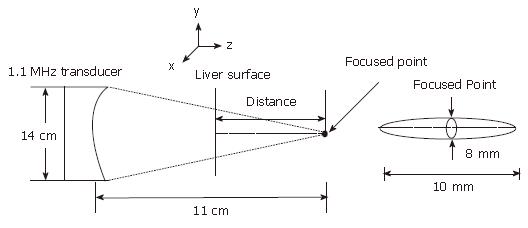
Figure 1 Beam characteristics of the 1.
1 MHz high intensity focused ultrasound transducer.
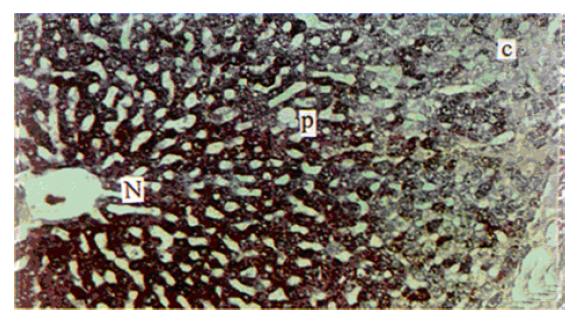
Figure 2 Light micrography showing the cytoplasmic glycogen decreased in ablated lesion (c, p) immediately after high intensity focused ultrasound (HIFU) exposure by stained PAS.
N = Normal liver; C = Lesion centre; P = Lesion edge. × 66.
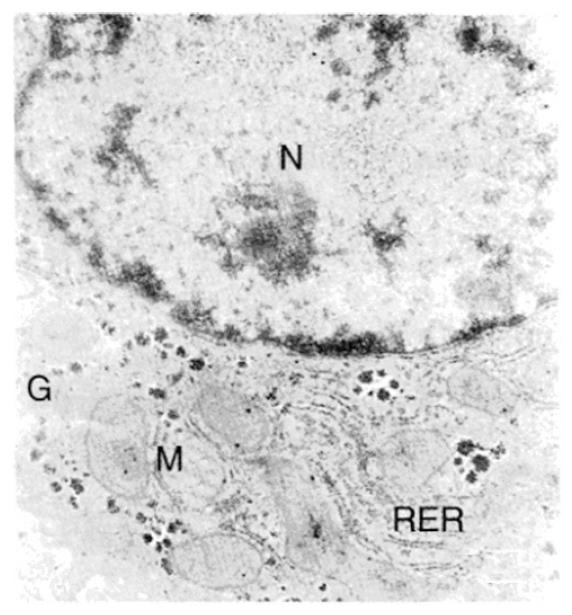
Figure 3 Electron micrography of a normal rabbit hepatocyte.
N = Nucleus; M = Mitochondria; RER = Rough endoplasmic reticulum; G = Glycogen.
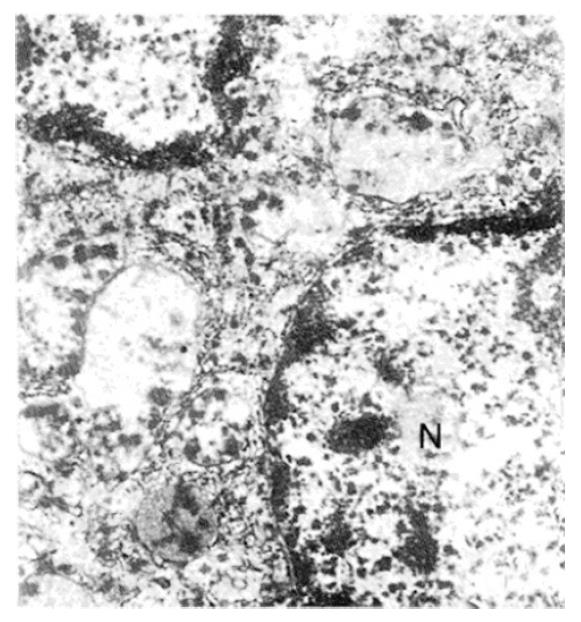
Figure 4 Electron micrography from the edge region of the lesion immediately after HIFU treatment showing the destruction of organelles and massive vacuolization of the cytoplasm as a sign of irreversible cell death.
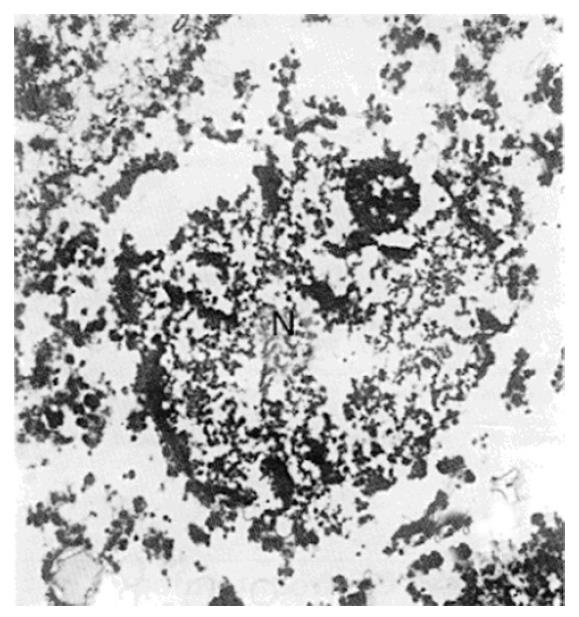
Figure 5 Electron micrography from the centre of the lesion, showing complete cellular disruption with karyorrhexis and many electronic deposits existed and cavities left.
- Citation: Cheng SQ, Zhou XD, Tang ZY, Yu Y, Bao SS, Qian DC. Ultrastructural observation of liver tissue ablation induced by high-intensity focused ultrasound. World J Gastroenterol 1997; 3(3): 134-136
- URL: https://www.wjgnet.com/1007-9327/full/v3/i3/134.htm
- DOI: https://dx.doi.org/10.3748/wjg.v3.i3.134


