Copyright
©The Author(s) 2023.
World J Gastroenterol. Mar 7, 2023; 29(9): 1523-1535
Published online Mar 7, 2023. doi: 10.3748/wjg.v29.i9.1523
Published online Mar 7, 2023. doi: 10.3748/wjg.v29.i9.1523
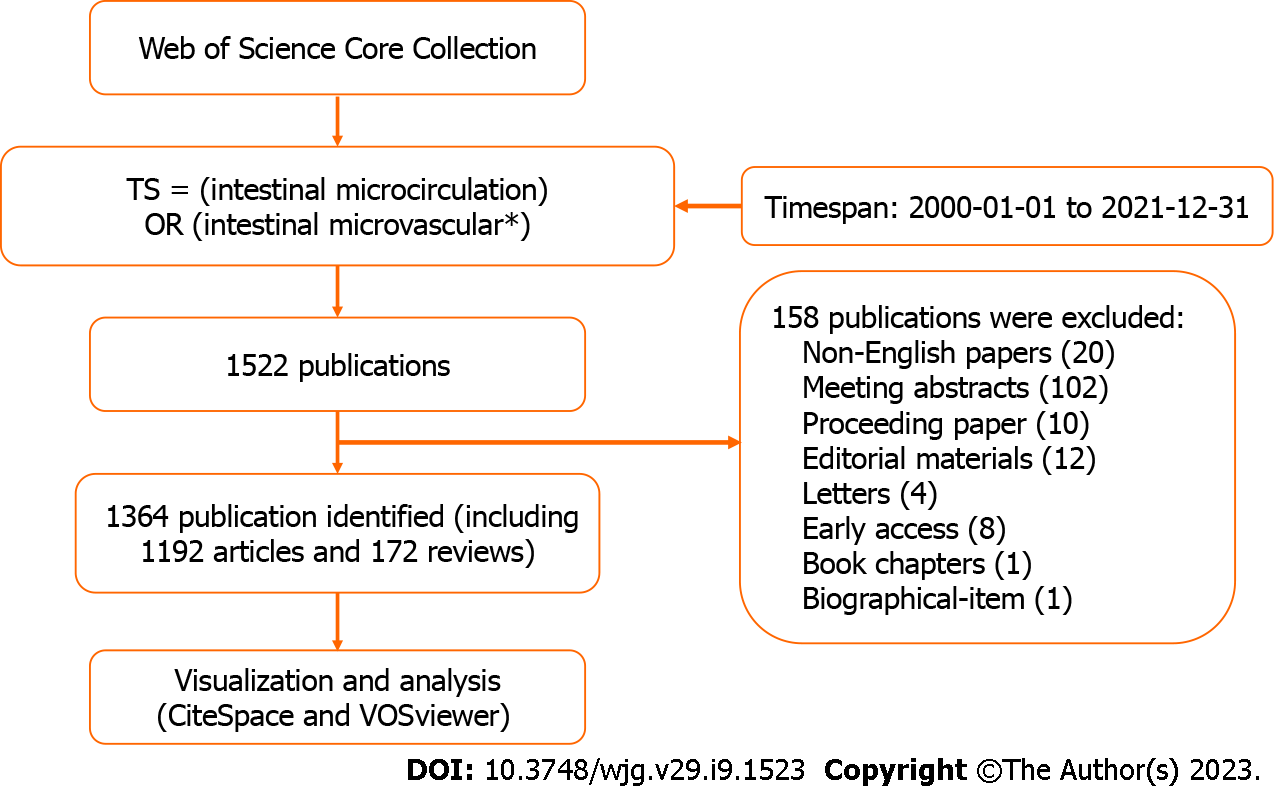
Figure 1 The flow chart for the search and selection strategy of the study.
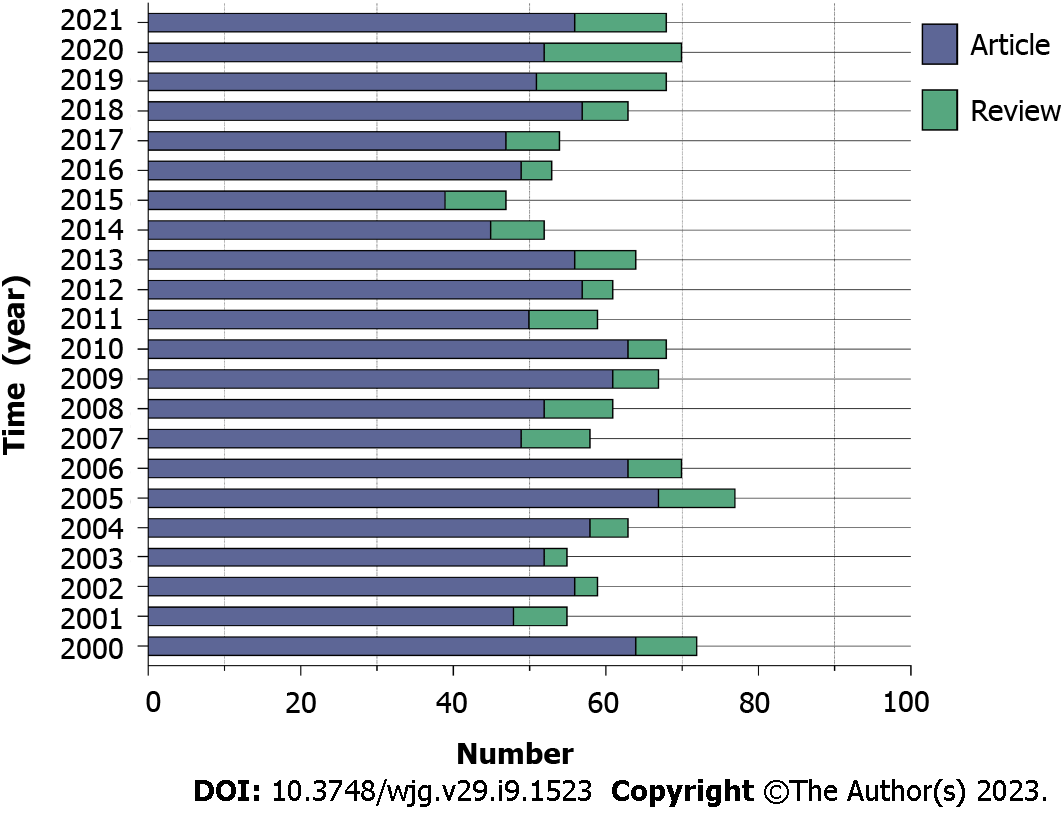
Figure 2 Distribution of articles published in the intestinal microcirculatory research from 2000 to 2021.
The chart showed trends in annual publishing during the previous 22 years. Purple bars represent the number of articles related to intestinal microcirculation per year, while green bars represent the number of reviews.
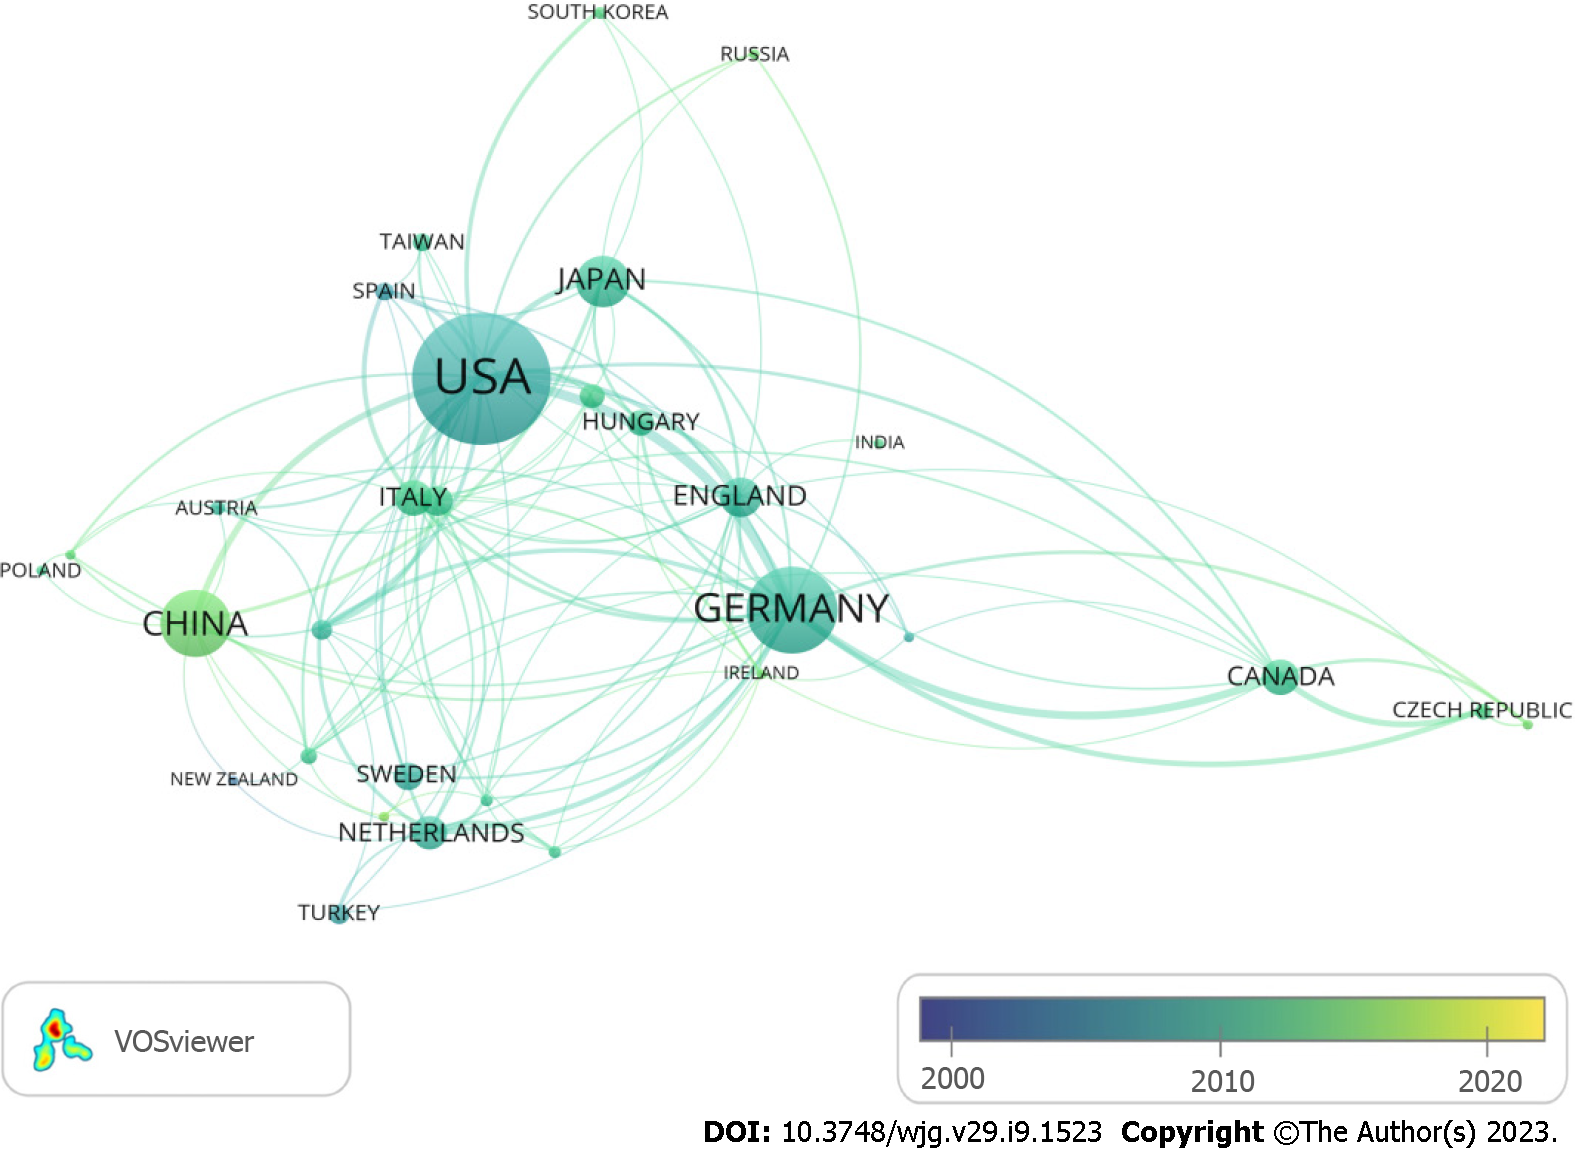
Figure 3 The network of countries/regions engaged in the intestinal microcirculatory research.
The collaborations were generated after a minimum of five publications per country. Of the 62 countries active in this field, 32 countries meet this criterion. The size of the node represents the number of posts, and the links between the nodes represent the connection or cooperation between the countries. The transition from blue to yellow in the color bar depicts the years 2000 to 2021.
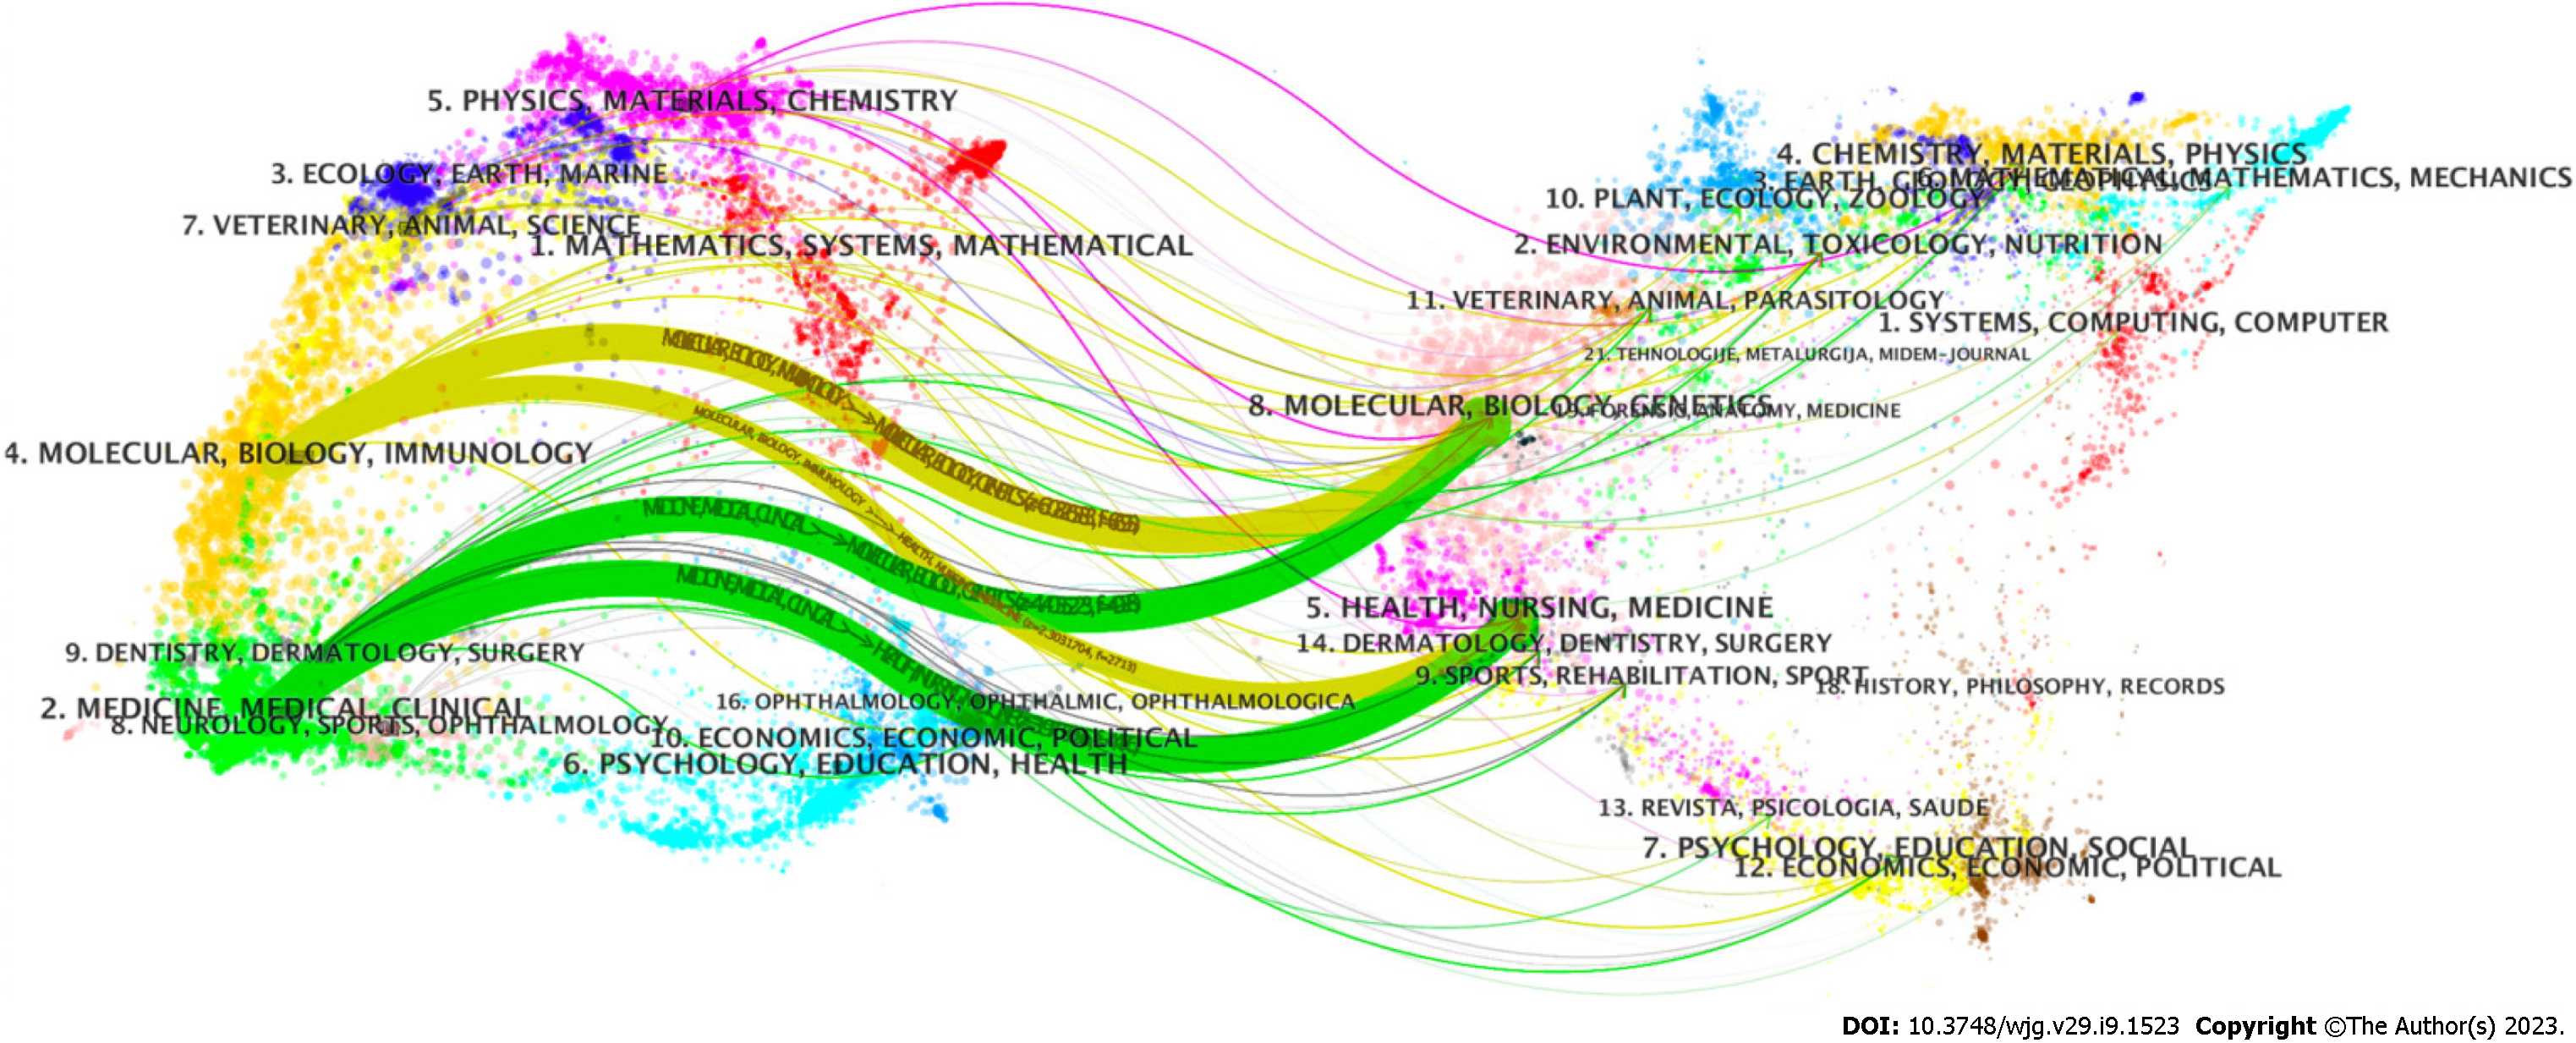
Figure 4 The dual-map overlay of journals in the intestinal microcirculatory research.
The left panel shows the map of citing journals while the right panel represents the map of the cited journals. The labels represent the scientific subject covered by the journals. Colored paths indicate the citation relationships, with the thicker lines representing the main pathways.
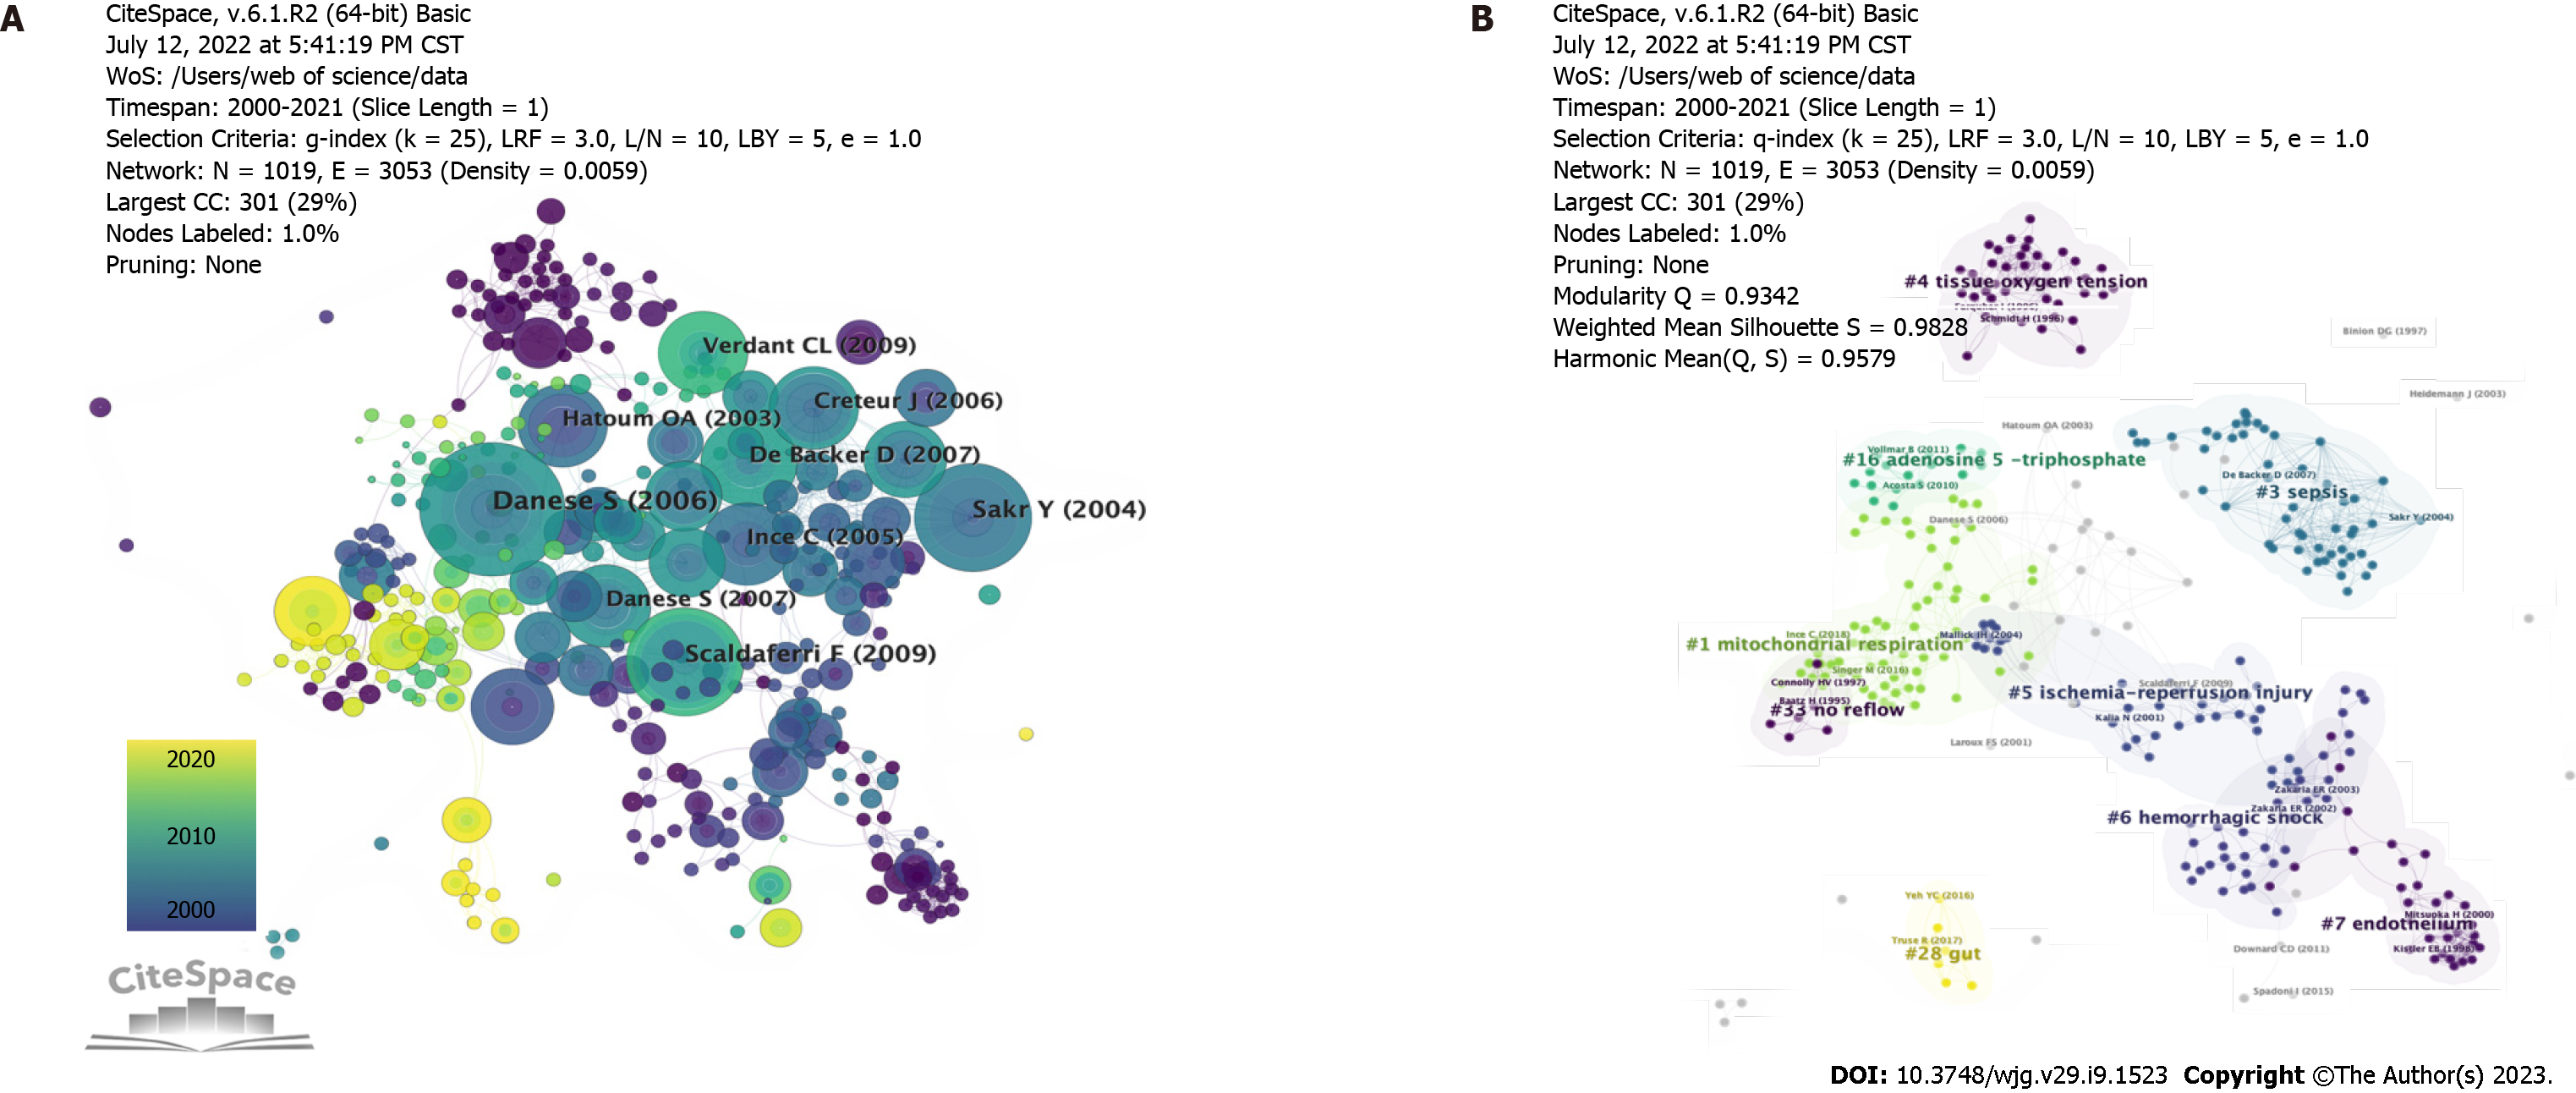
Figure 5 The network map of co-cited references in the intestinal microcirculatory research.
A: The network map of co-cited references. Nodes in the visualized network represent co-cited references and lines between nodes represent co-cited links; B: The network map of co-cited clusters. 9 clusters with diversified research themes were formed and illustrated in different colors. Silhouette = 0.9828. Modularity Q = 0.9342.
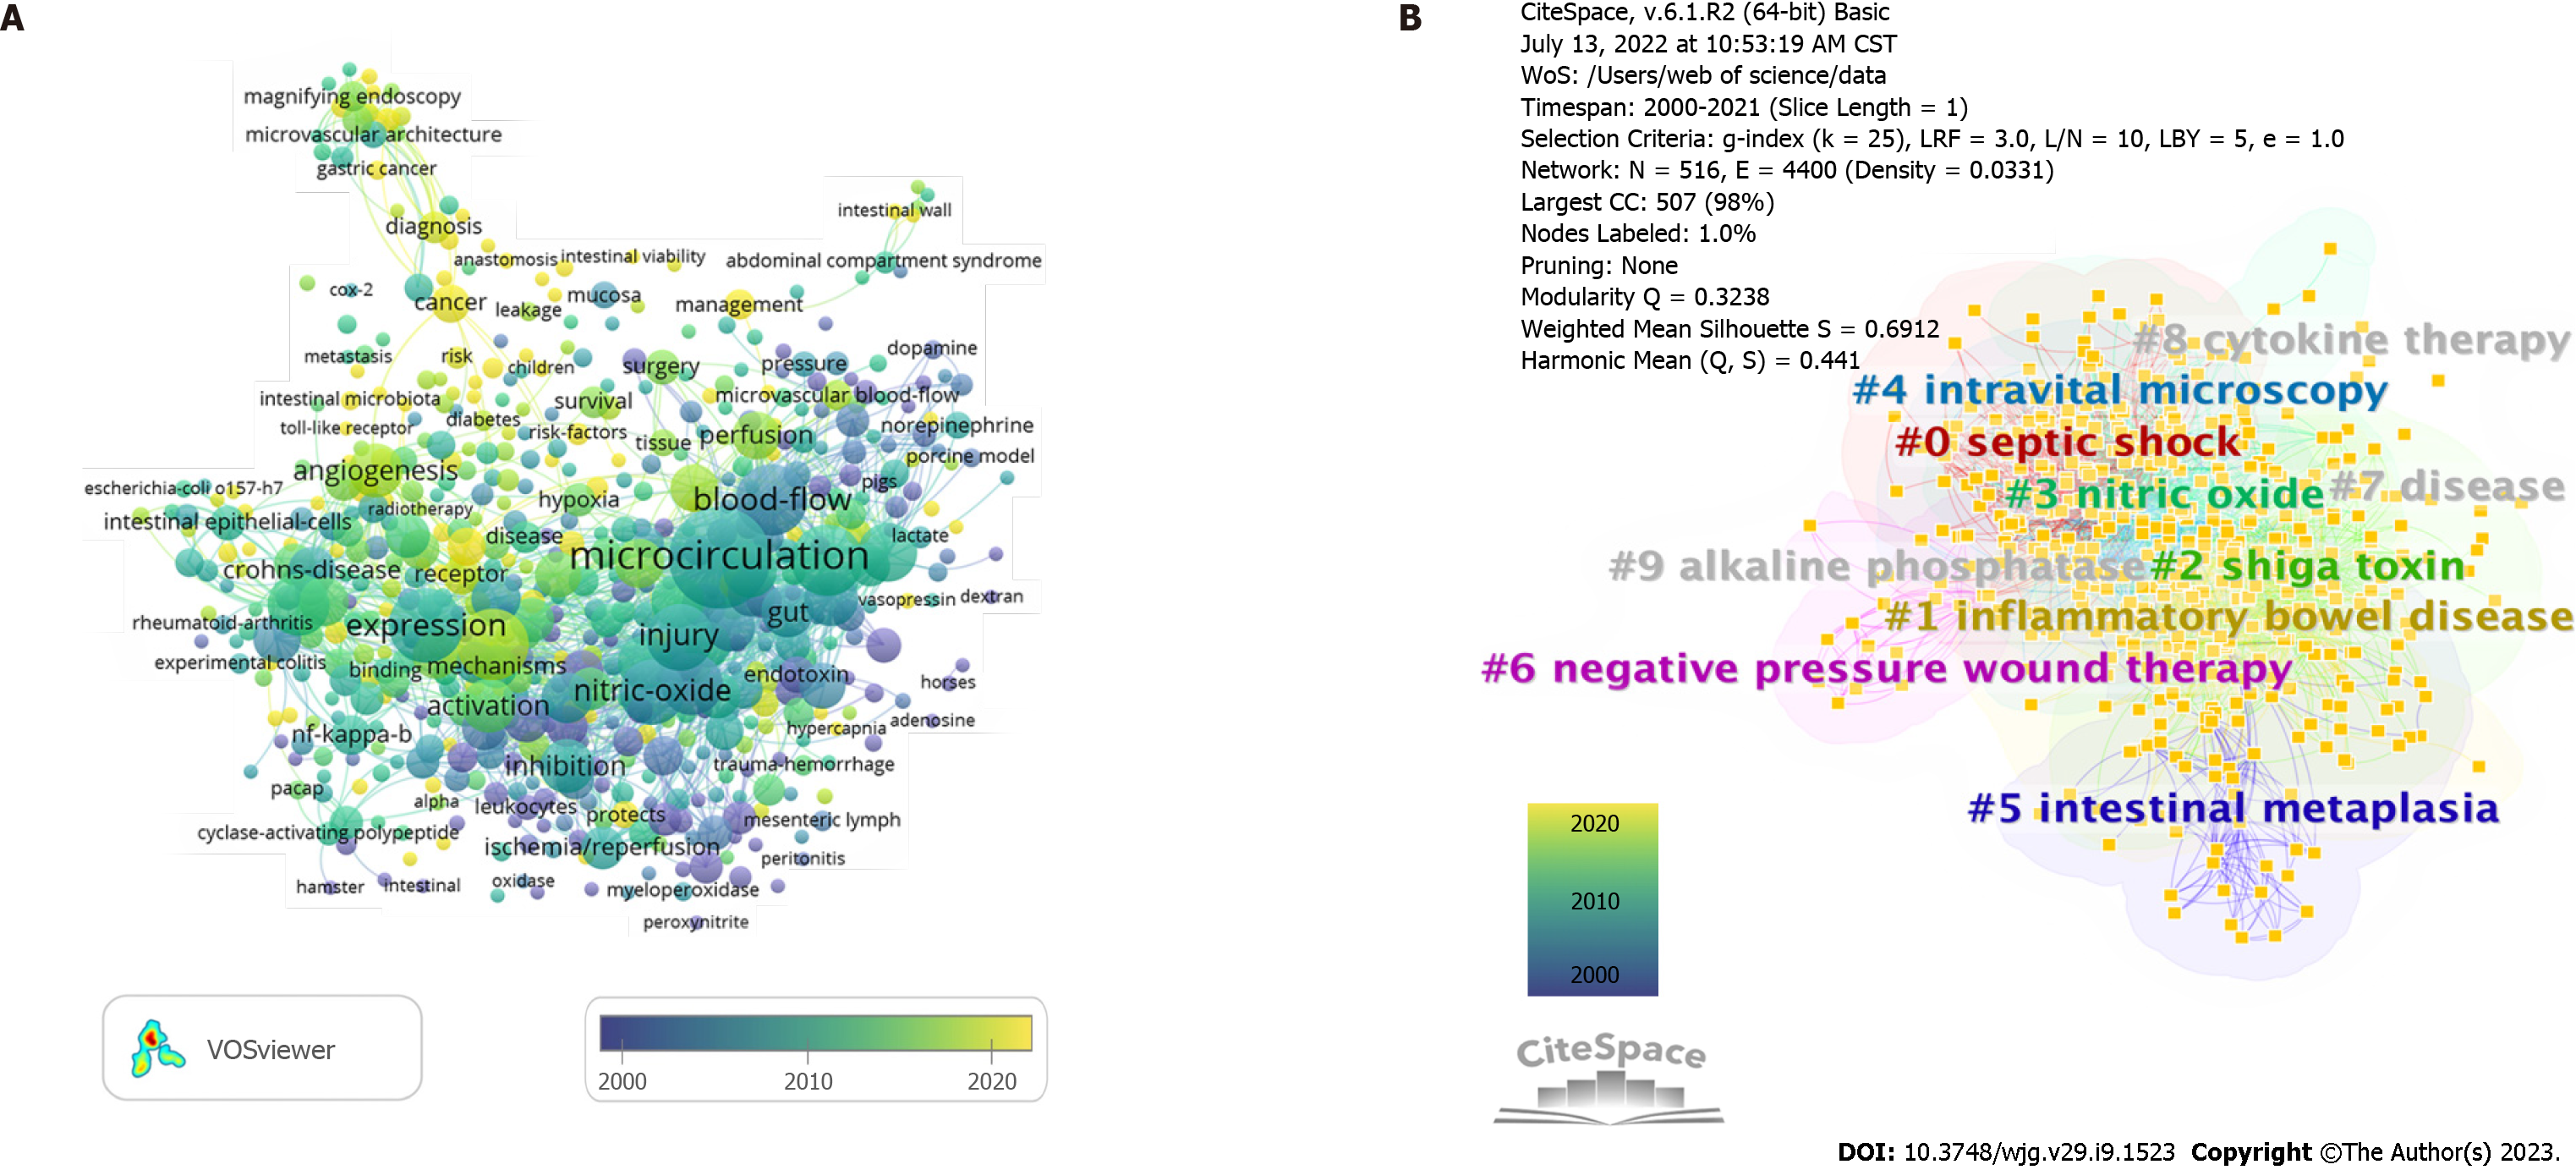
Figure 6 The network map of keywords in the intestinal microcirculatory research.
A: The co-occurrence map of keywords in the intestinal microcirculatory research. The graphical mapping of terms was created when setting the minimum number of keyword occurrences to 5. Of the 6607 keywords in the field, 572 reached this threshold. Each node represents a keyword, and the sizes of the node denote the number of occurrences of the keywords map. The transition from blue to yellow in the color bar depicts the years 2000 to 2021; B: The clustering map of keywords in the intestinal microcirculatory research. 10 clusters with diversified themes were formed and illustrated in different colors. Colors represent clusters of the close-working network. Silhouette = 0.3238. Modularity Q = 0.6912.
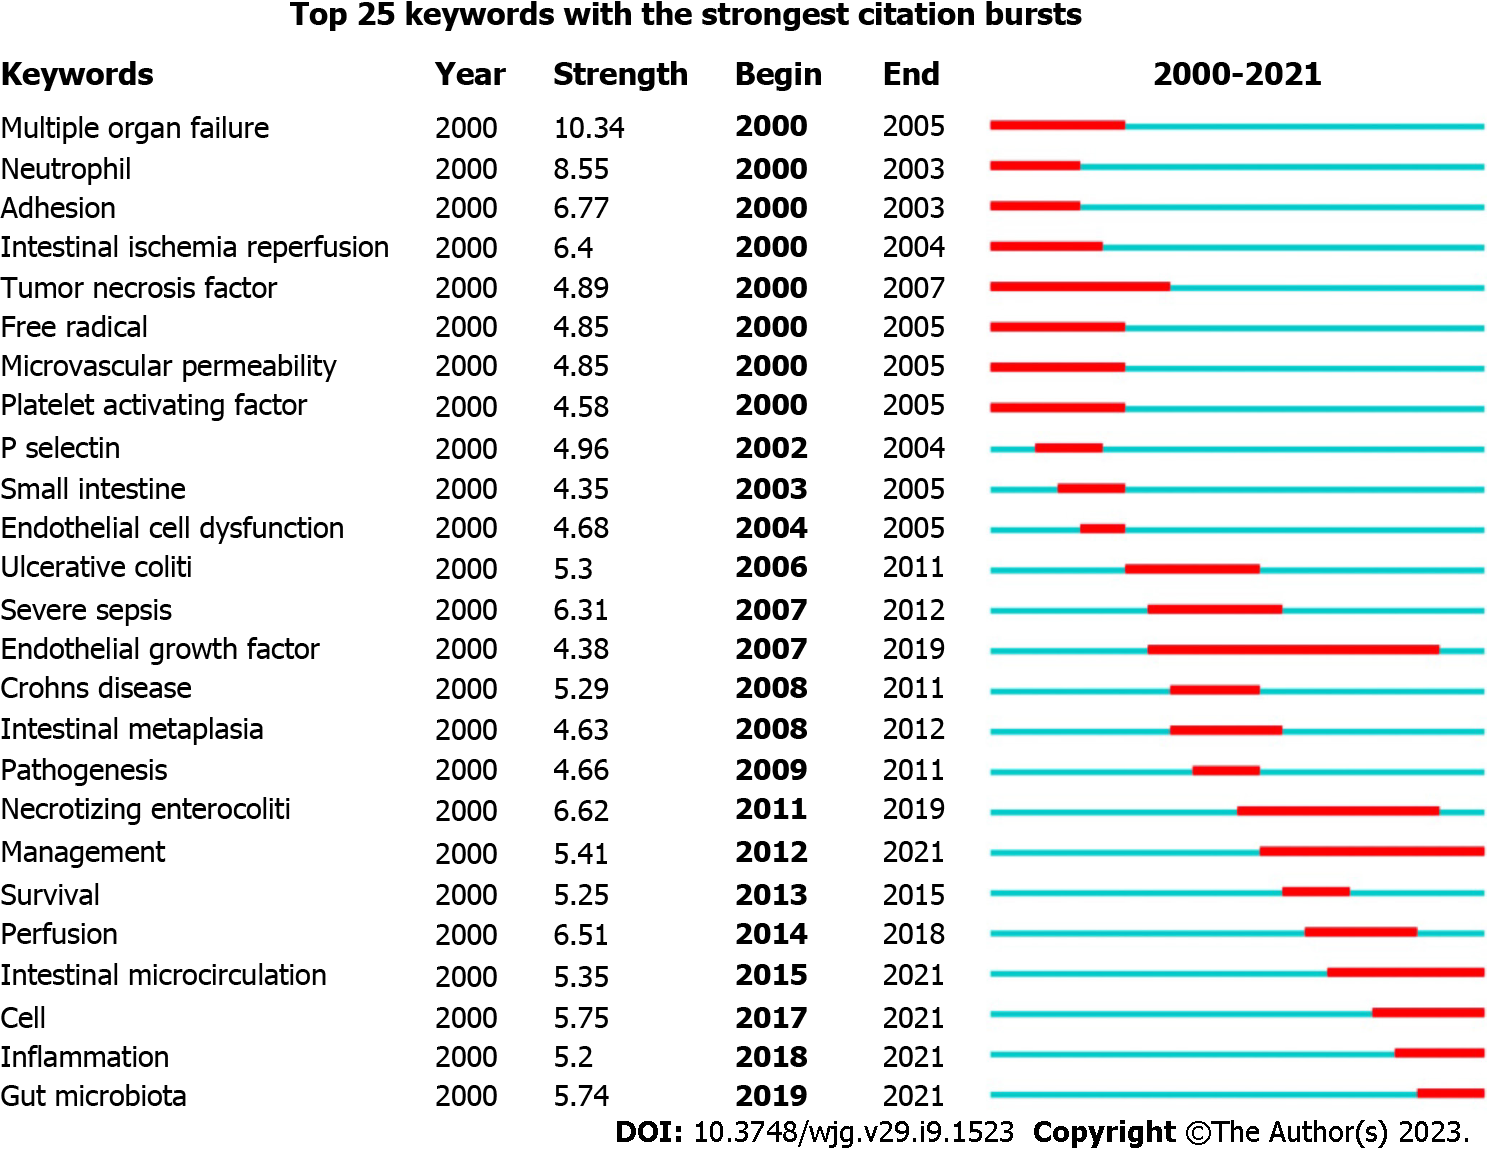
Figure 7 Top 25 keywords with the strongest citation bursts.
Keywords bursts identify as indicators of emerging trends in the intestinal microcirculatory field to a published article. In the burst detection, “begin” represented the year the reference began to have a citation burst, and “end” represented the year ended the citation burst. The red line is the time of duration and the “strength” is the intensity of the citation burst.
- Citation: Fu SJ, Xu MT, Wang B, Li BW, Ling H, Li Y, Wang Q, Liu XT, Zhang XY, Li AL, Liu MM. Global trend and future landscape of intestinal microcirculation research from 2000 to 2021: A scientometric study. World J Gastroenterol 2023; 29(9): 1523-1535
- URL: https://www.wjgnet.com/1007-9327/full/v29/i9/1523.htm
- DOI: https://dx.doi.org/10.3748/wjg.v29.i9.1523


