Copyright
©The Author(s) 2023.
World J Gastroenterol. Aug 21, 2023; 29(31): 4783-4796
Published online Aug 21, 2023. doi: 10.3748/wjg.v29.i31.4783
Published online Aug 21, 2023. doi: 10.3748/wjg.v29.i31.4783
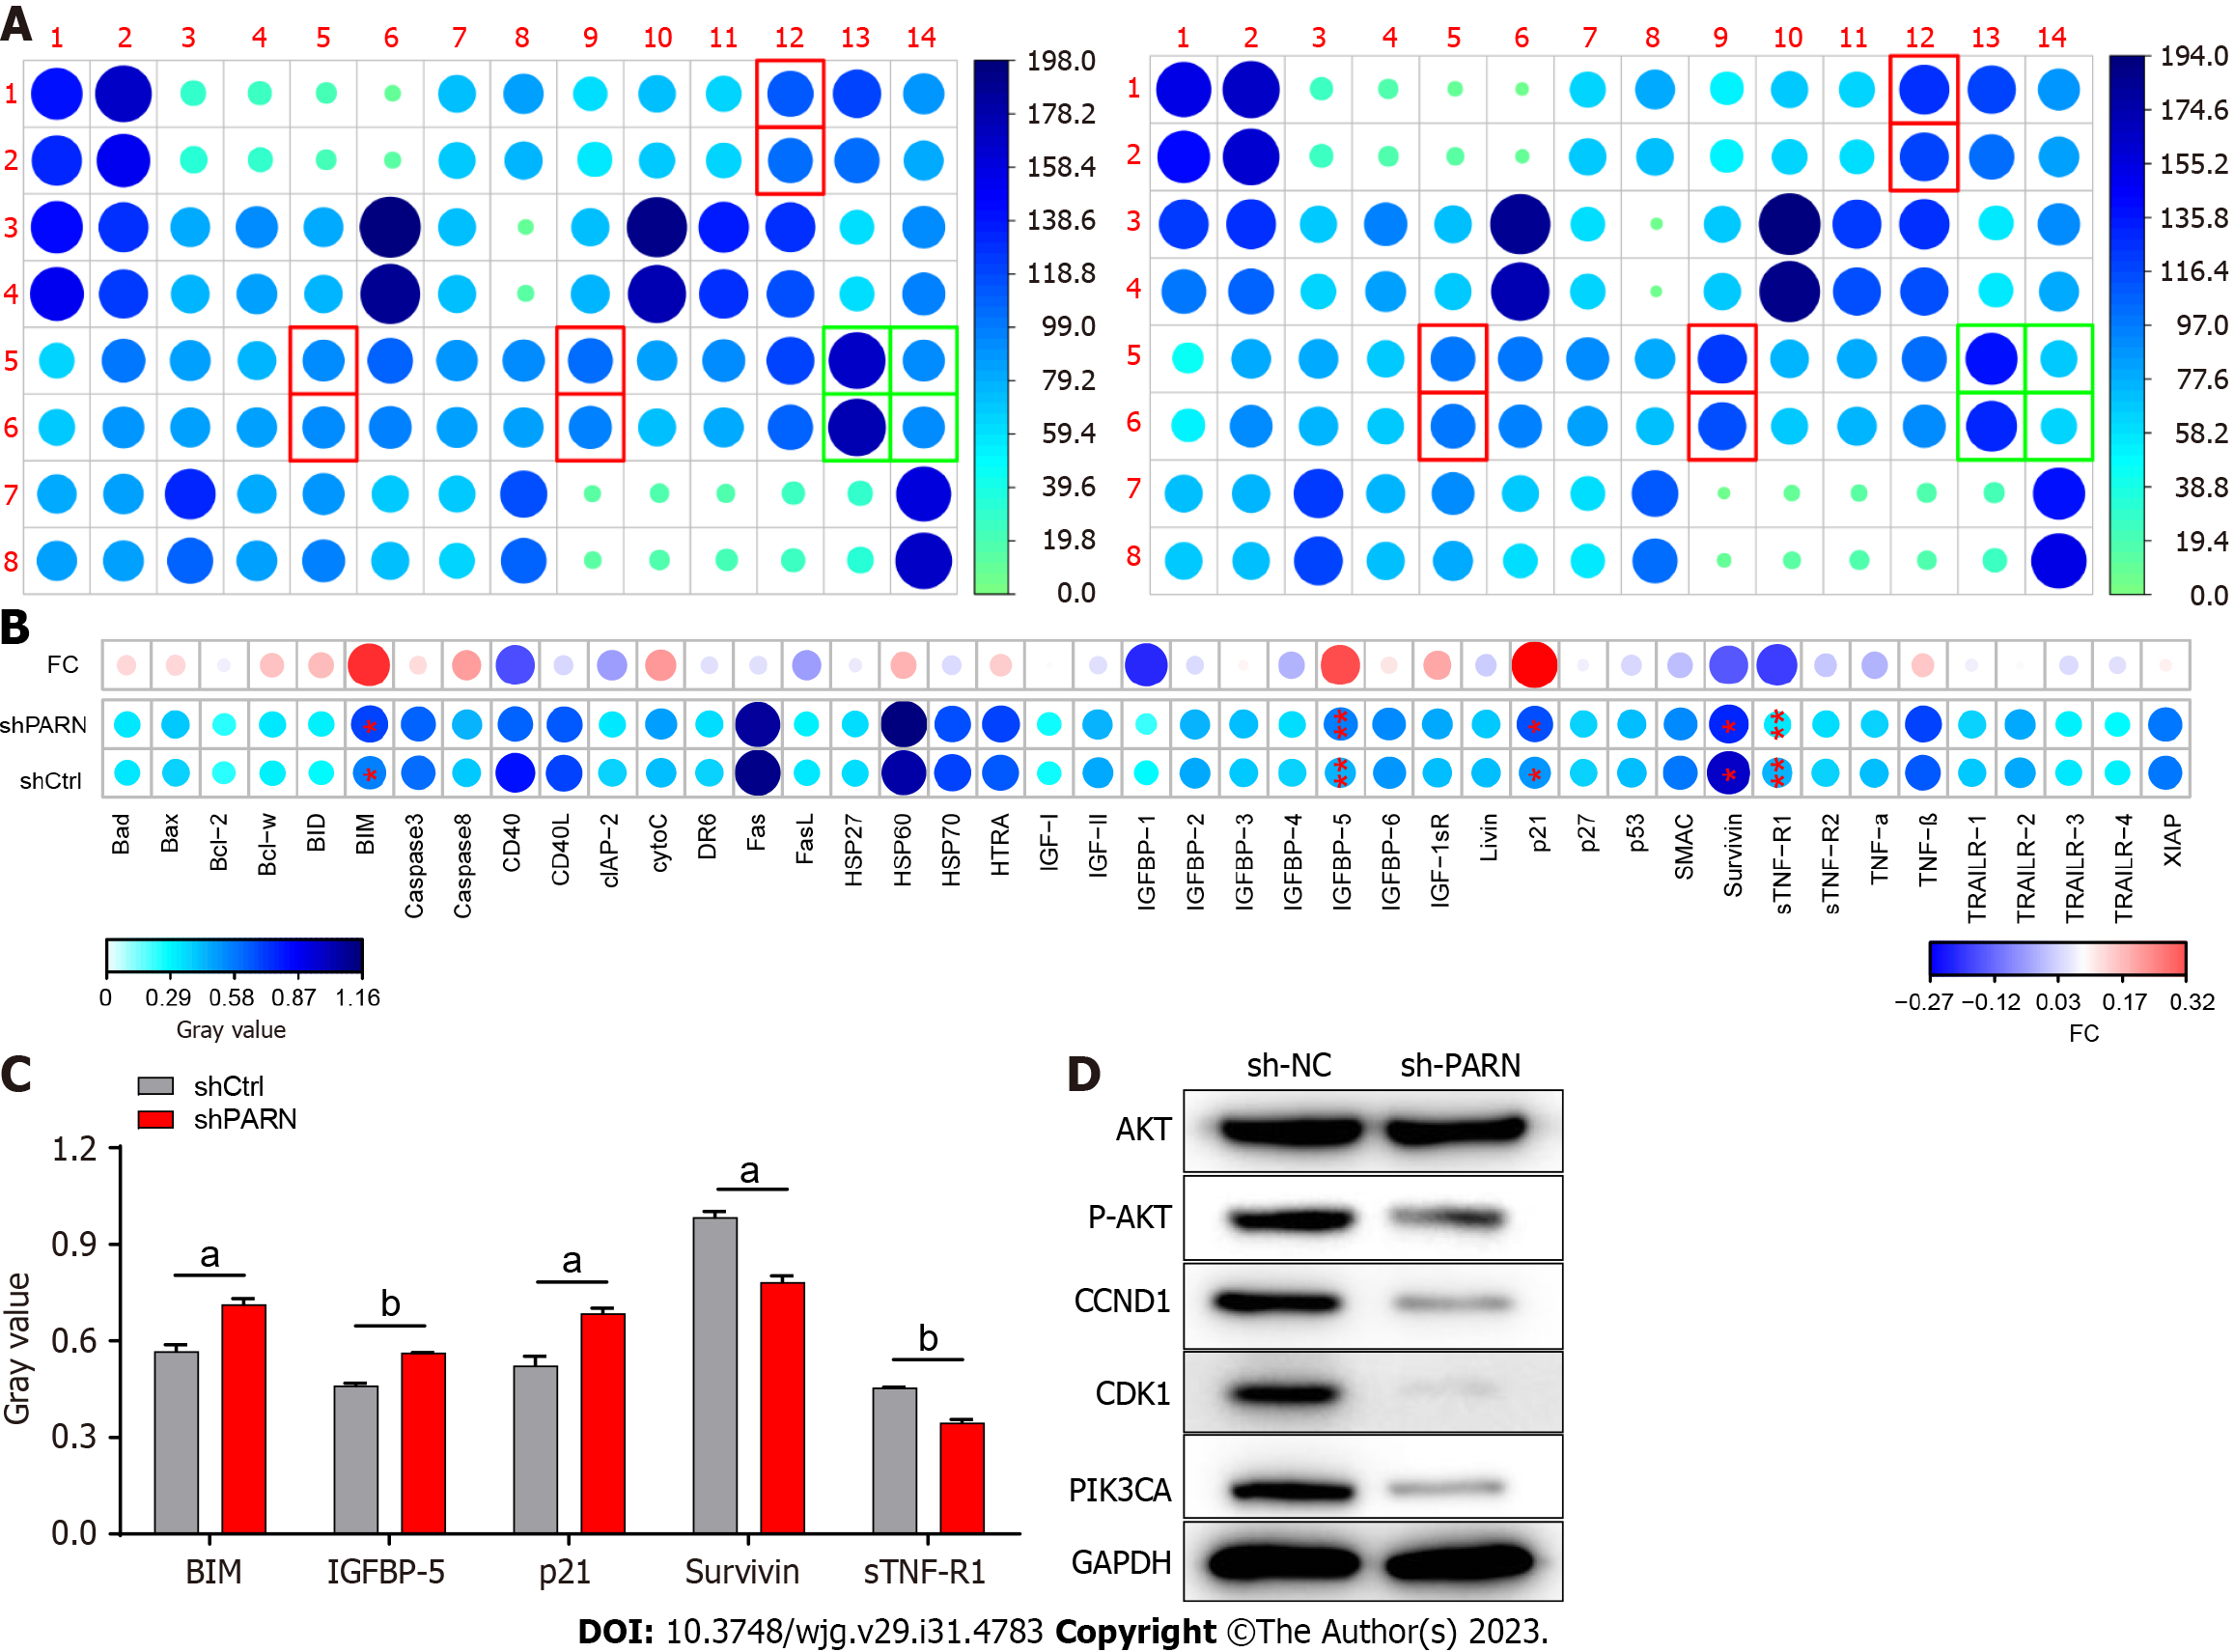
Figure 1 Exploration of the downstream molecular mechanism of poly(A)-specific ribonuclease in esophageal cancer cells.
A: Human apoptosis antibody array analysis was performed in Eca-109 cells transfected with control shRNA or poly(A)-specific ribonuclease shRNA; B: Differences in the human apoptotic antibody array were visualized; C: Densitometry analysis was performed, and the gray values of differentially expressed proteins are shown; D: The expression of the target protein pathway in Eca-109 cells was observed by western blot. The data are expressed as the mean ± SD, aP < 0.05, bP < 0.01. sh PARN: Poly(A)-specific ribonuclease shRNA; sh-NC: Control shRNA.
Figure 2 Poly(A)-specific ribonuclease protein expression was upregulated in both esophageal cancer tissue and cell lines and correlated with poor prognosis in esophageal cancer patients.
A: Left panel: Representative immunohistochemistry (IHC) staining images of poly(A)-specific ribonuclease (PARN) in esophageal cancer tissue specimens (magnification × 400, bar = 50 μm). Right panel: Summary of IHC staining of PARN in esophageal cancer tissues (n = 91) and adjacent normal tissues (n = 63) in an esophageal tissue microarray; B: PARN mRNA levels were significantly increased in esophageal cancer tissue (n = 160) compared with adjacent normal tissues (n = 11). The data were obtained from The Cancer Genome Atlas; C: Kaplan-Meier survival analysis showed that high expression of PARN was correlated with poor prognosis in esophageal cancer patients (the PARN IHC score criteria: Table 5); D and E: Exploration of PARN gene expression in various malignant tumors using TCGA database, and the expression of PARN gene in EC was significantly higher than that in adjacent tissues in the TCGA database, P = 0.0004; F: PARN mRNA levels in esophageal cancer cell lines. aP < 0.05, bP < 0.01, cP < 0.001, mean ± SD is shown. PARN: Poly(A)-specific ribonuclease; IHC: Immunohistochemistry.
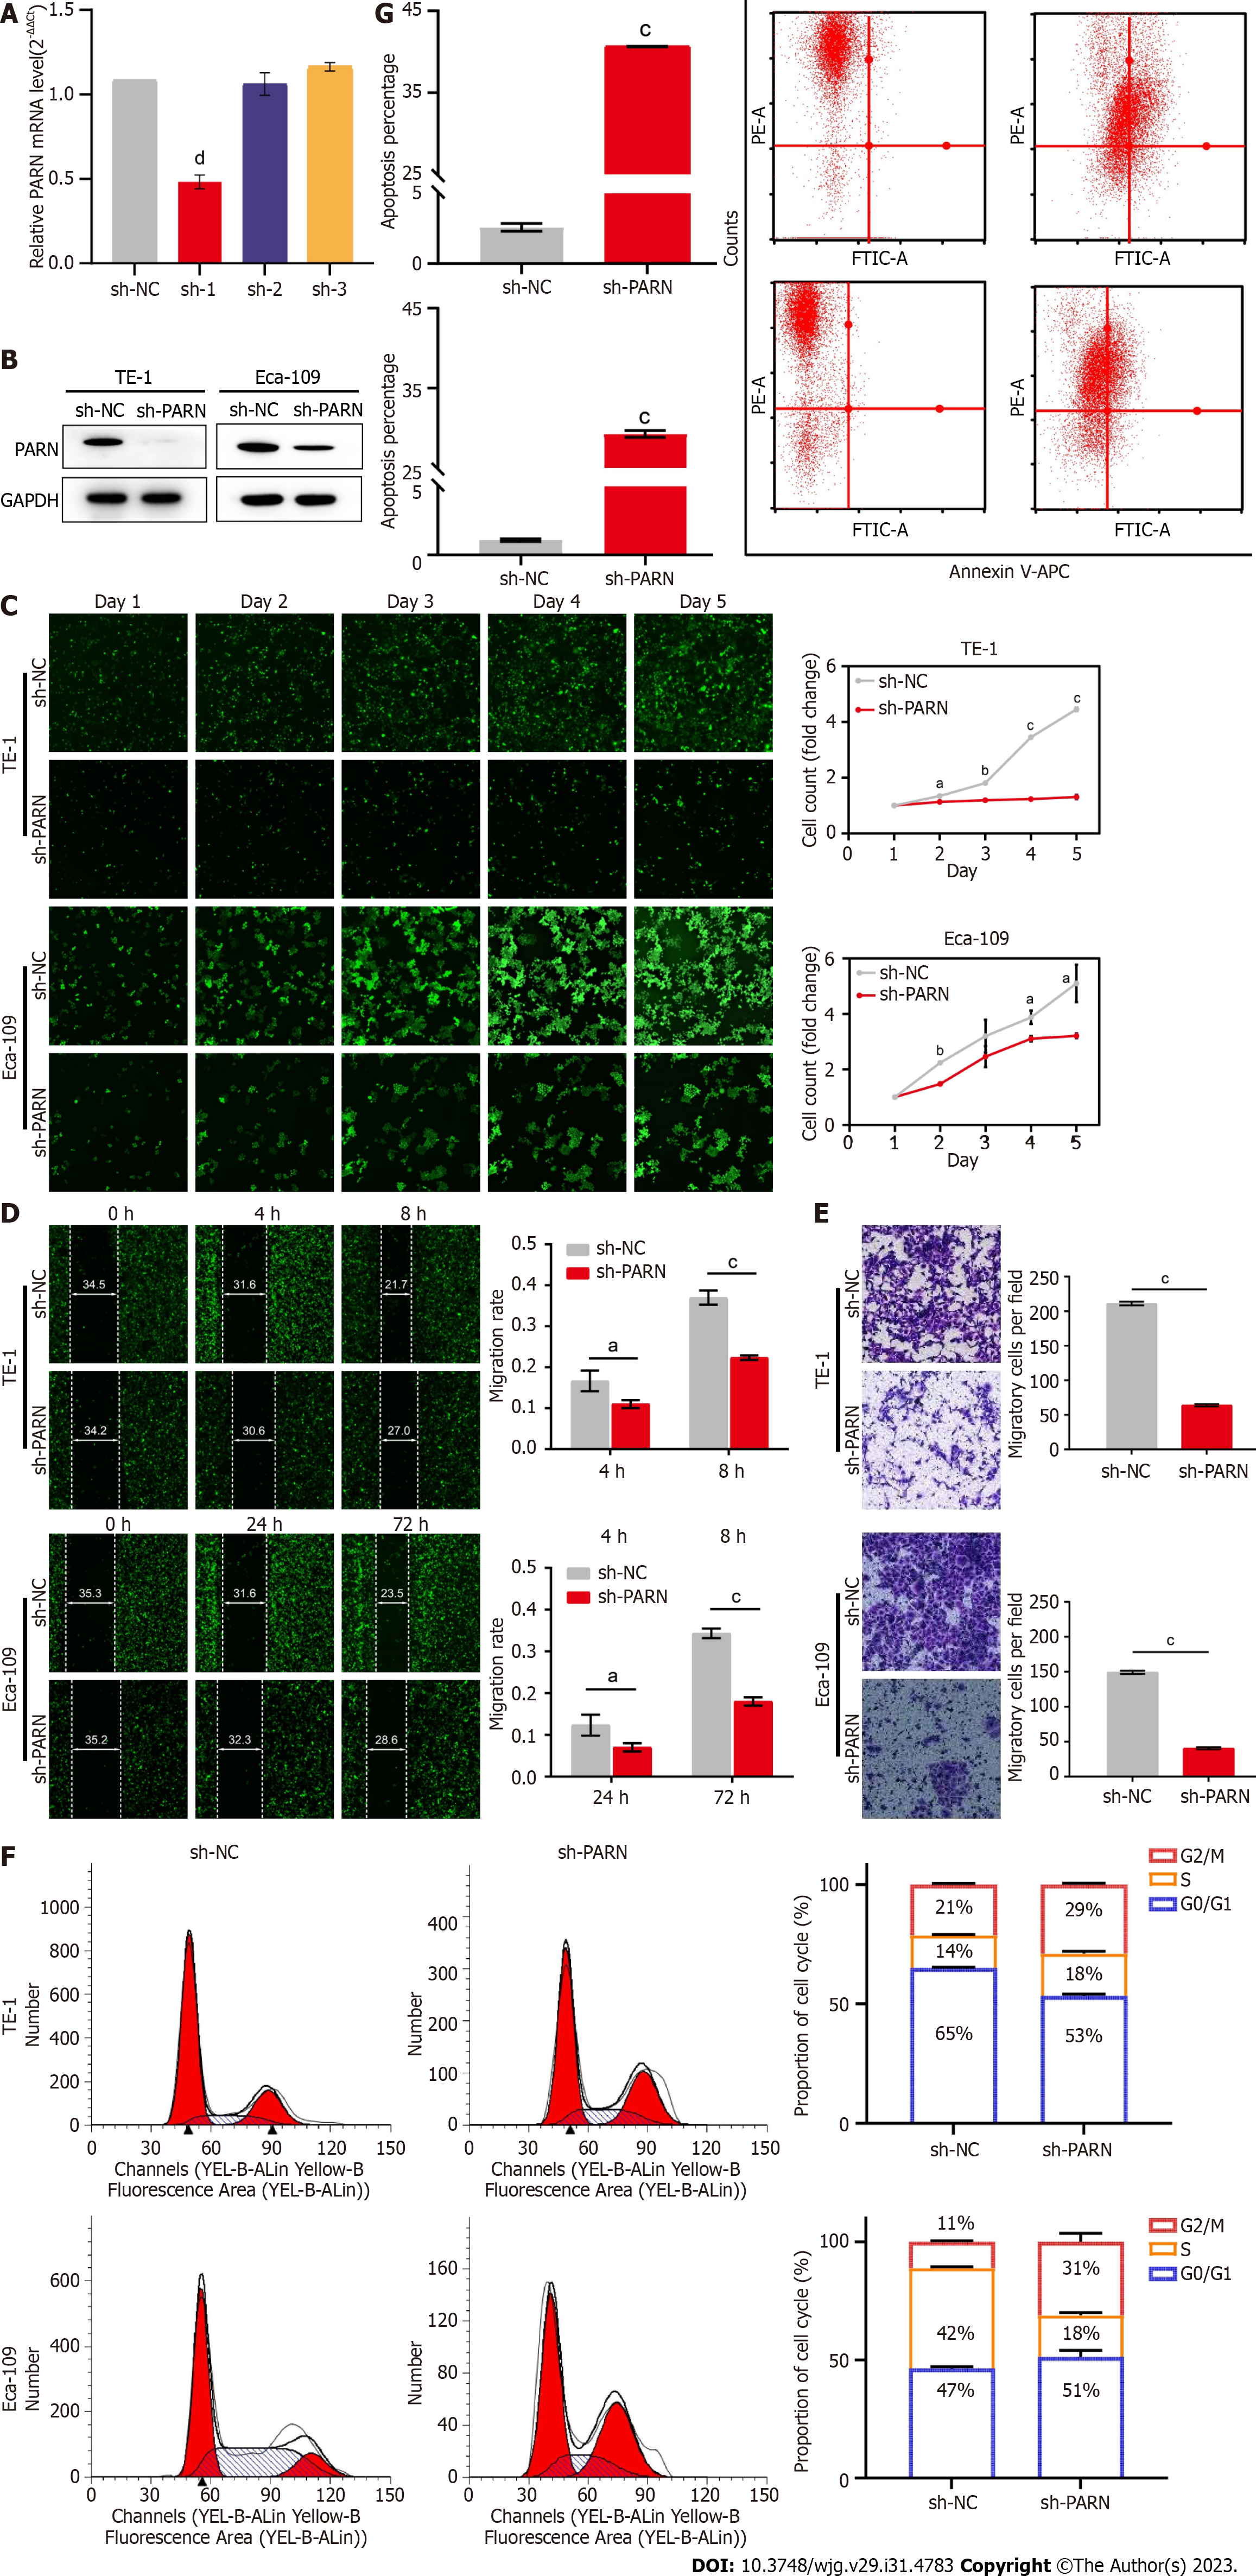
Figure 3 Effect of poly(A)-specific ribonuclease on esophageal cancer cell proliferation, migration and invasion, cell cycle, and cell apoptosis in vitro.
A and B: The interference efficiency of poly(A)-specific ribonuclease (PARN) via shRNA; C: Representative images of the Celigo cell count assay (magnification, × 100) and cumulative data of cell numbers in TE-1 and Eca-109 cells transfected with control shRNA or PARN shRNA; D: Representative images and statistical analysis of the wound healing assay; E: Representative images and statistical analysis of the transwell assay; F and G: Representative images and statistical analysis of flow cytometry analysis of TE-1 and Eca-109 cells after transfection. Cell cycle analysis revealed that PARN affected TE-1 and Eca-109 cell proliferation (F), and cell apoptosis analysis showed that PARN affected the apoptosis of TE-1 and Eca-109 cells (G). aP < 0.05, bP < 0.01, aP < 0.0001, cP < 0.001, means ± SDs are shown. sh PARN: Poly(A)-specific ribonuclease shRNA; sh-NC: Control shRNA.
Figure 4 Poly(A)-specific ribonuclease promotes tumor growth in vivo.
A: Representative image of tumors separated from nude mice; B and C: Tumor volume and weight were measured in nude mice; D and E: Representative bioluminescence imaging (BLI) images and quantification of BLI in the tumor regions of nude mice; F: Representative images of Ki-67 staining in tumors isolated from the nude mice. Scale bars are indicated in the upper left corner of the picture (Bar = 50 μm). Assays were conducted in triplicate. cP < 0.001, mean ± SD is shown. sh PARN: Poly(A)-specific ribonuclease shRNA; sh-NC: Control shRNA.
- Citation: Zhang FW, Xie XW, Chen MH, Tong J, Chen QQ, Feng J, Chen FT, Liu WQ. Poly(A)-specific ribonuclease protein promotes the proliferation, invasion and migration of esophageal cancer cells. World J Gastroenterol 2023; 29(31): 4783-4796
- URL: https://www.wjgnet.com/1007-9327/full/v29/i31/4783.htm
- DOI: https://dx.doi.org/10.3748/wjg.v29.i31.4783


