Copyright
©The Author(s) 2023.
World J Gastroenterol. Aug 7, 2023; 29(29): 4557-4570
Published online Aug 7, 2023. doi: 10.3748/wjg.v29.i29.4557
Published online Aug 7, 2023. doi: 10.3748/wjg.v29.i29.4557
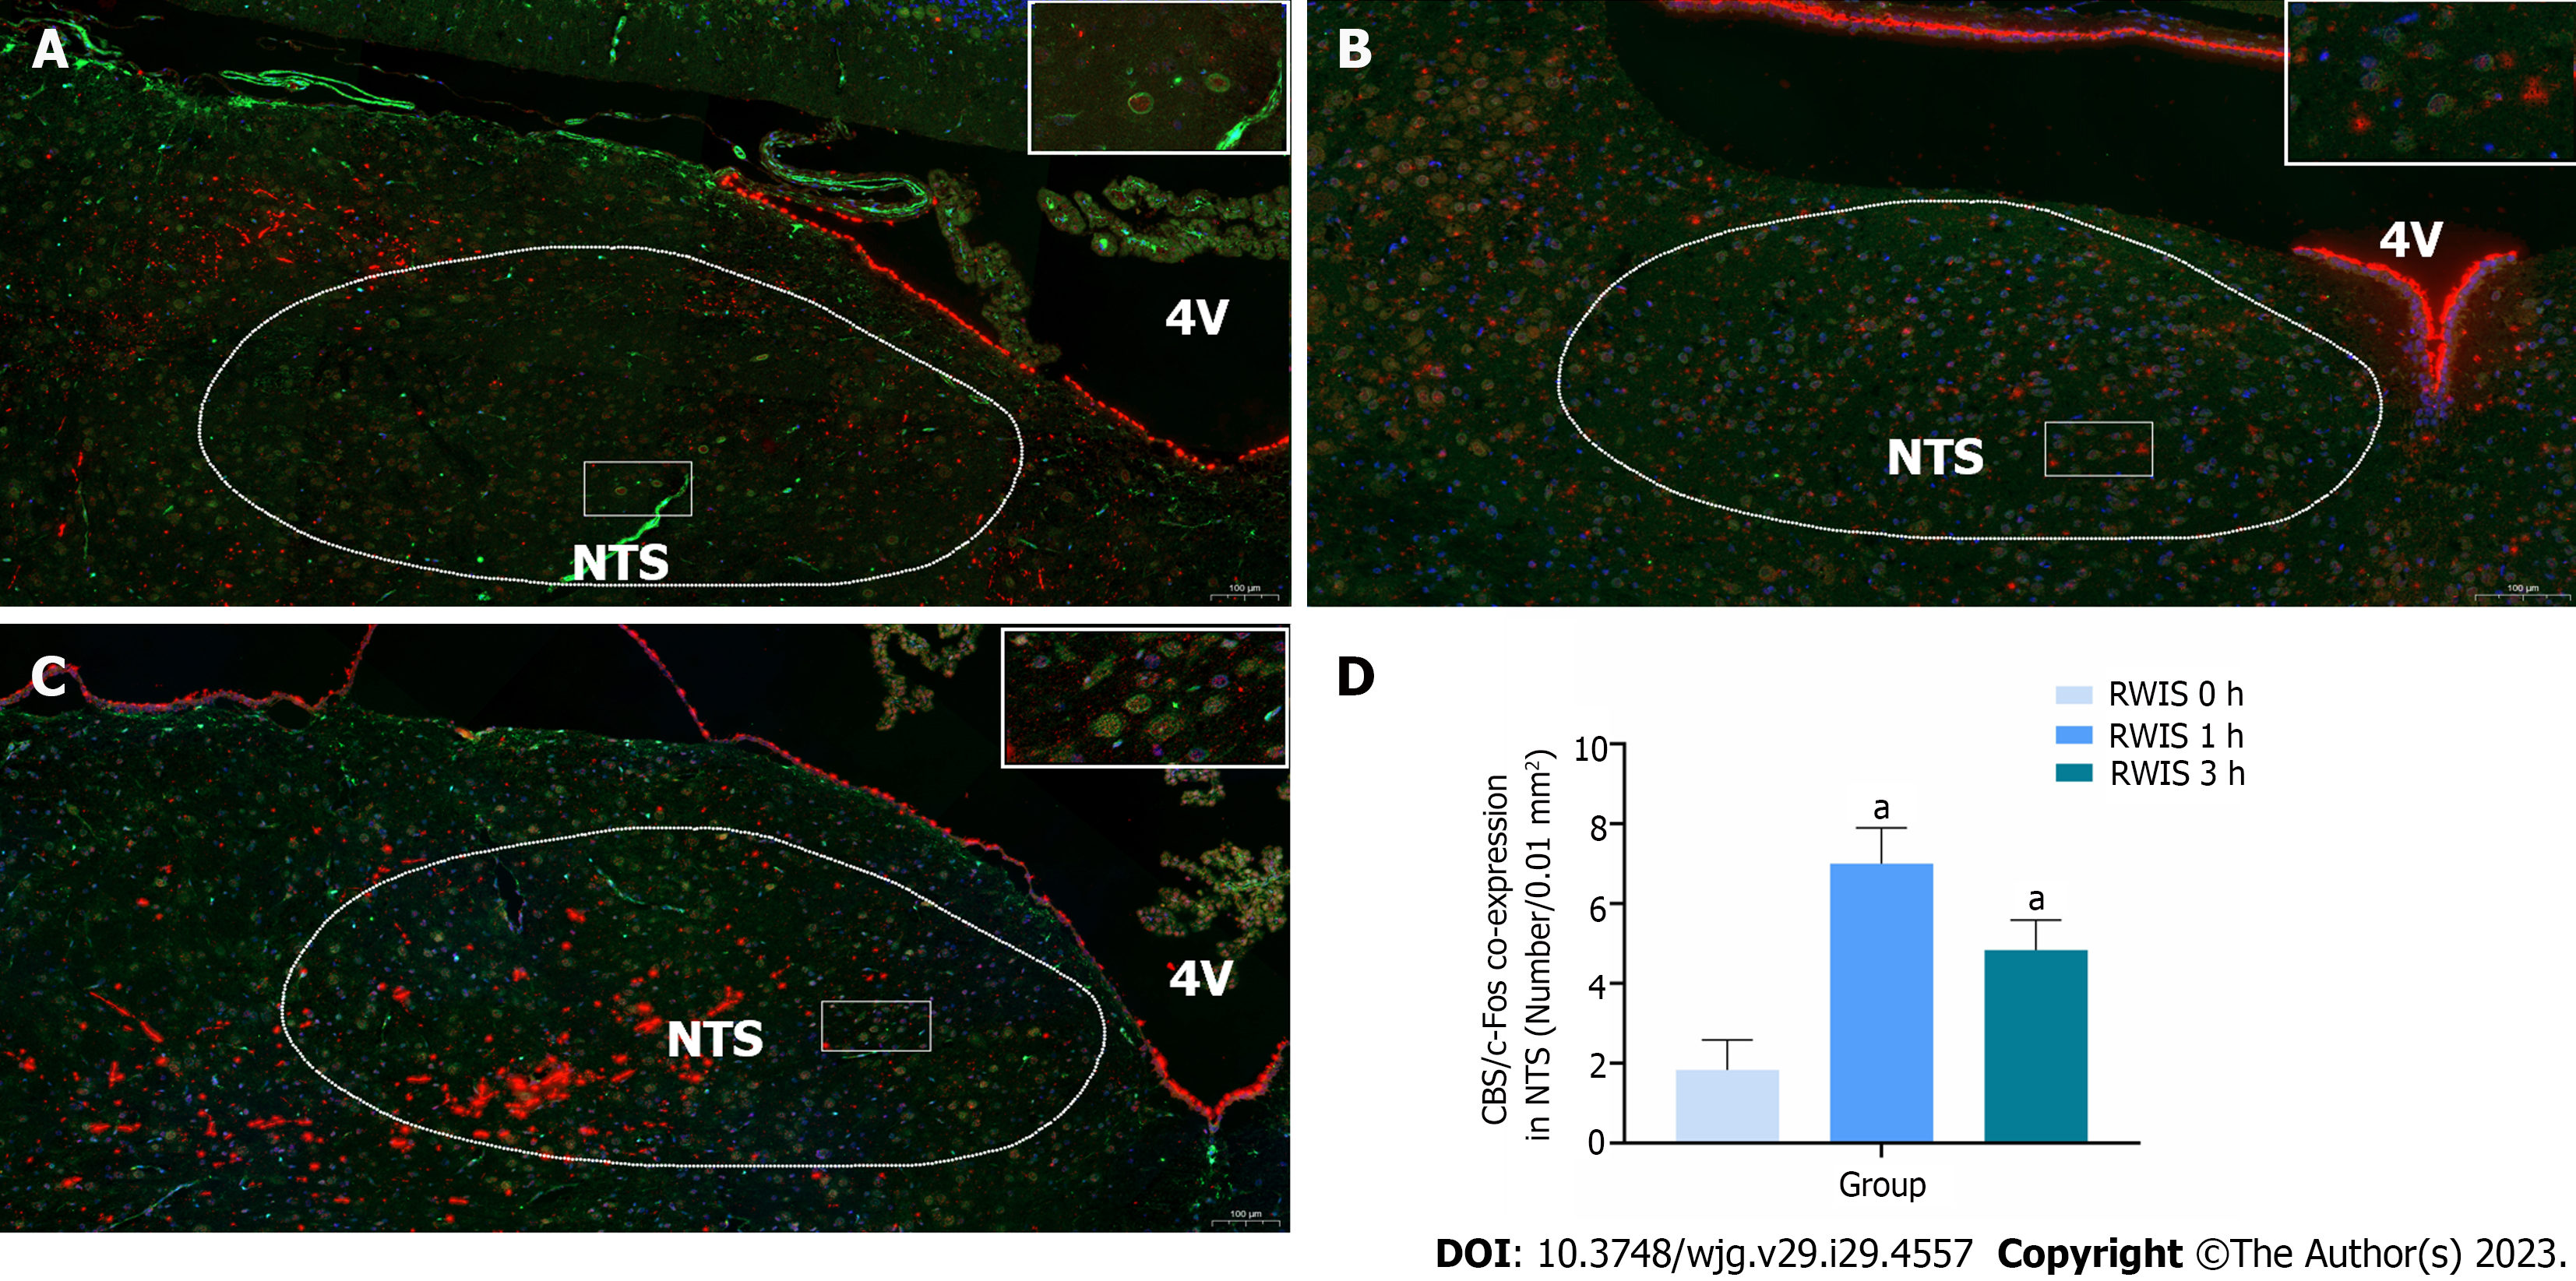
Figure 1 Co-expression of cystathionine beta-synthase (green) and c-Fos (red) neurons in the nucleus tractus solitarius at different times of restraint water-immersion stress.
A: Expression of cystathionine beta-synthase (CBS) and c-Fos in restraint water-immersion stress (RWIS) at 0 h; B: Expressions of CBS and c-Fos in RWIS at 1 h; C: Expression of CBS and c-Fos in RWIS at 3 h; D: Quantification of neurons co-expressing CBS and c-Fos in the nucleus tractus solitarius (n = 6). aP < 0.01 vs RWIS 0 h group. NTS: Nucleus tractus solitarius; RWIS: Restraint water-immersion stress; CBS: Cystathionine beta-synthase.
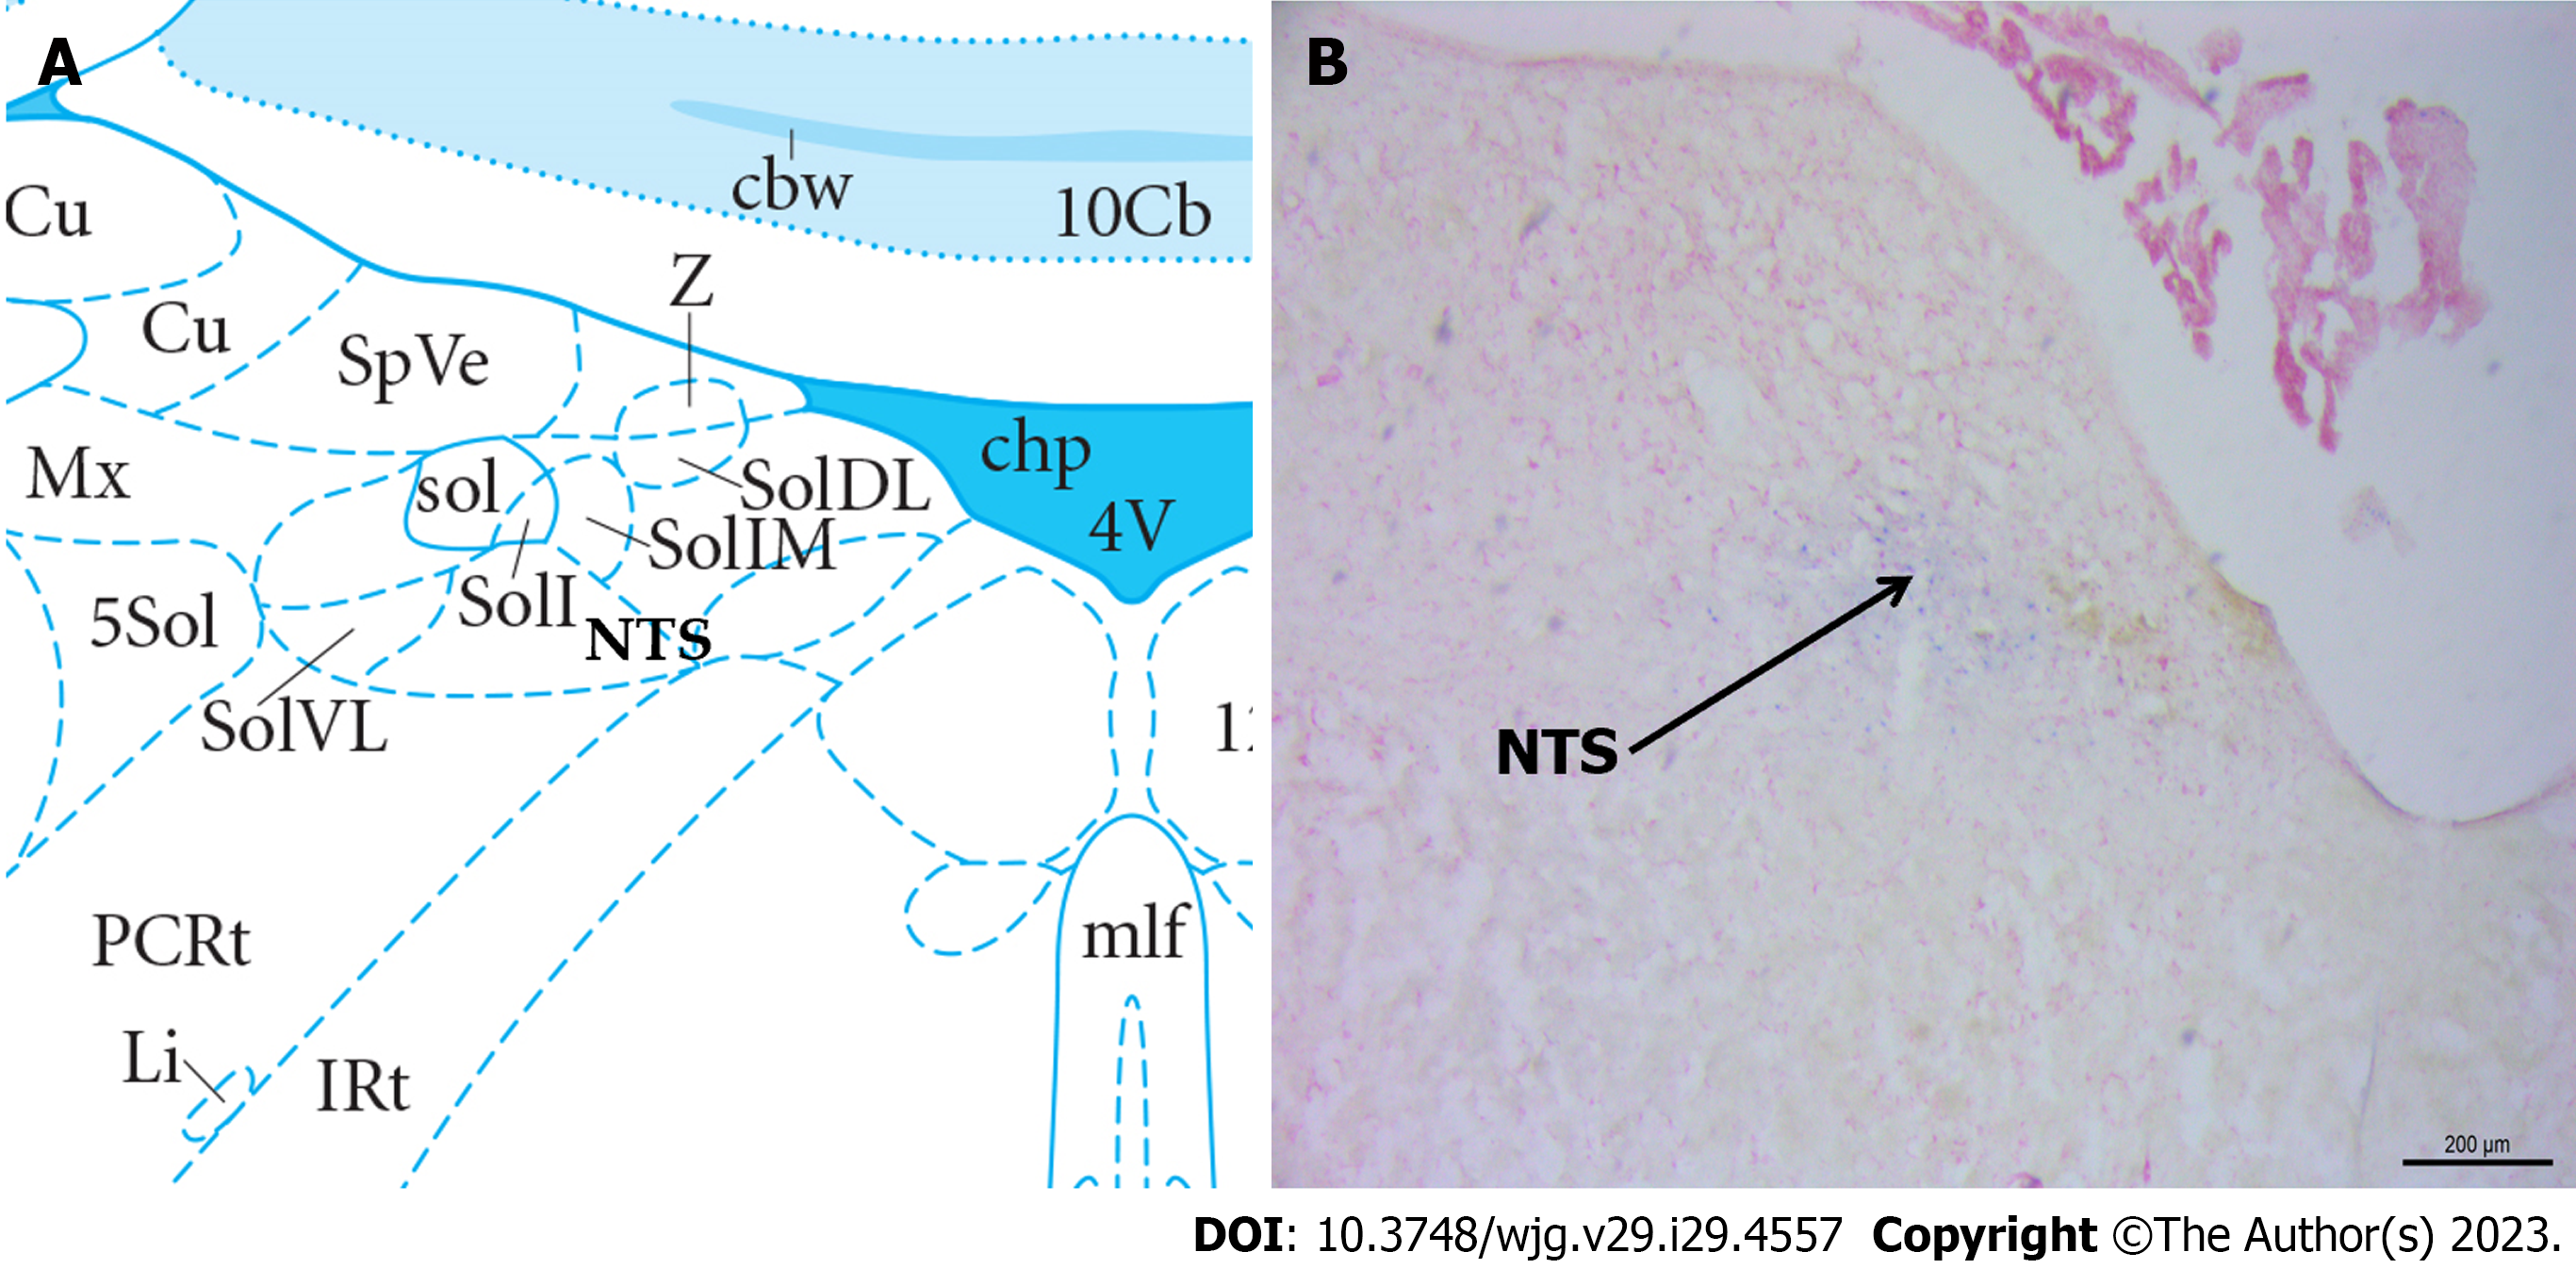
Figure 2 Histological identification of microinjections located at the nucleus tractus solitarius in the brain.
A: Location of the nucleus tractus solitarius (NTS) in the brain atlas; B: Neutral red stained brain section with blue dot sites representing injection into the NTS. NTS: Nucleus tractus solitarius.
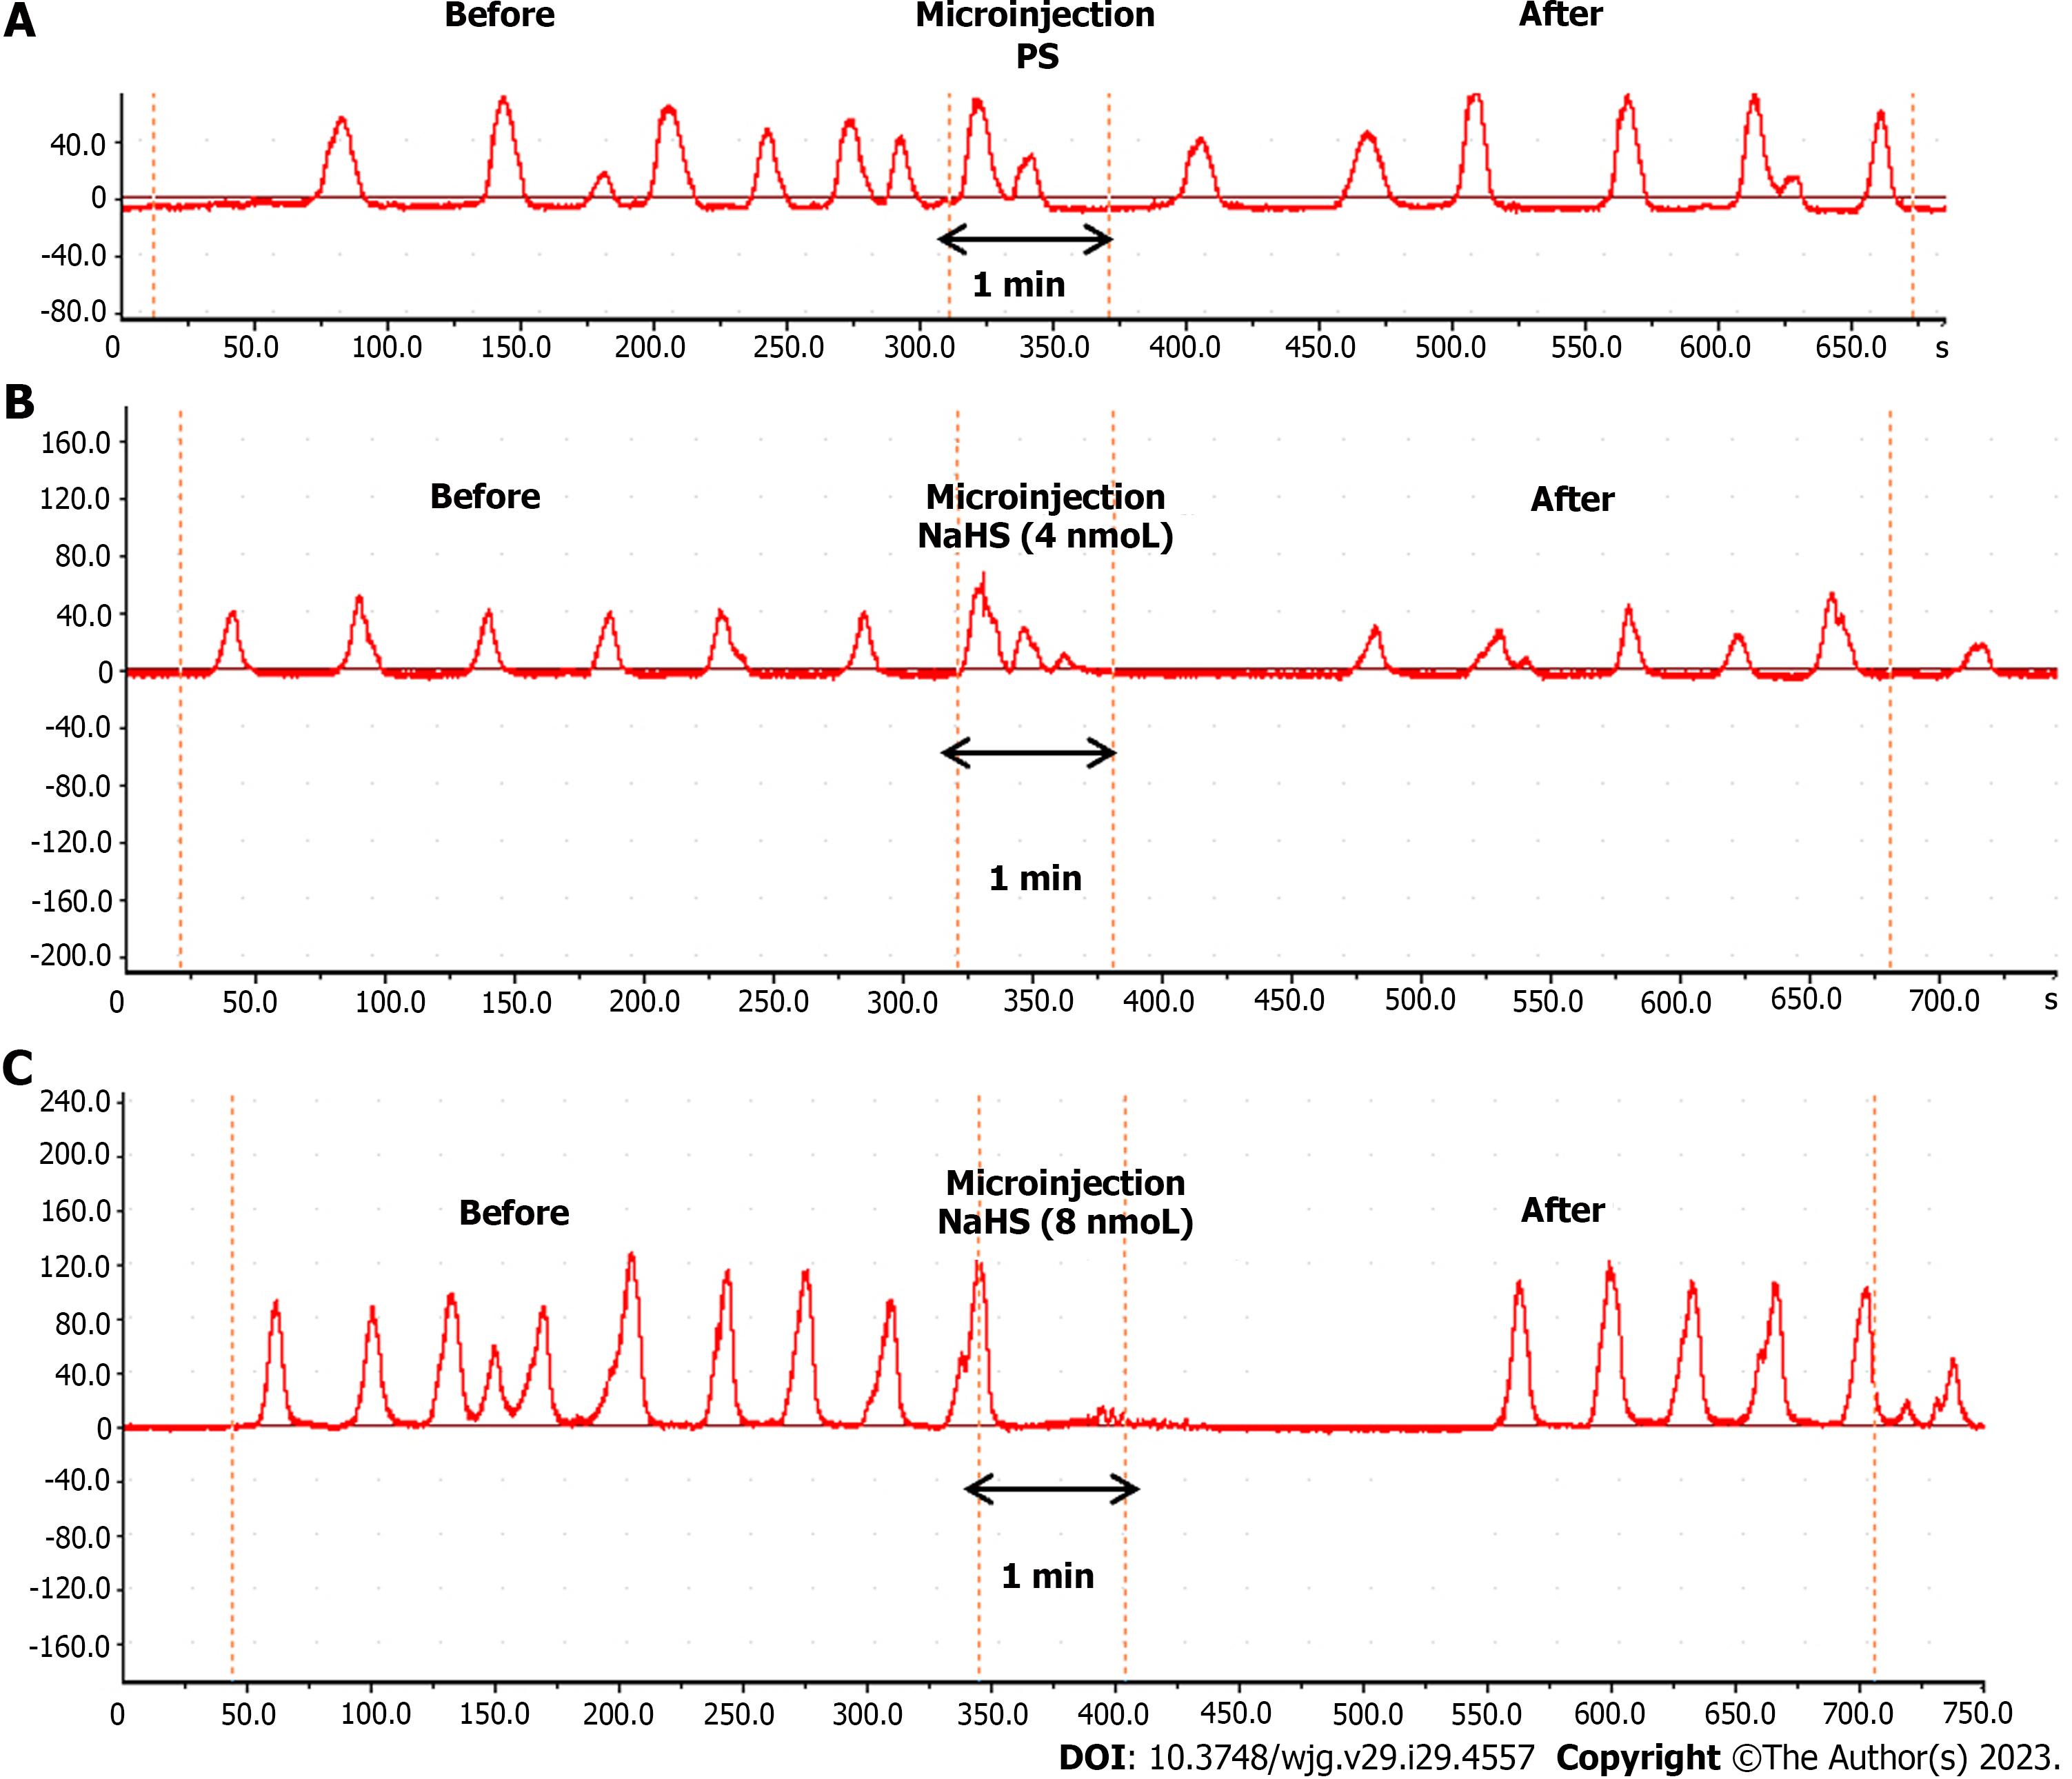
Figure 3 Effect of microinjection of drugs in the nucleus tractus solitarius on gastric motility in rats.
A: Gastric motility curves were recorded in rats microinjected with saline at the nucleus tractus solitarius (NTS); B: Gastric motility curves were recorded in rats microinjected with 4 nmol NaHS in the NTS; C: Gastric motility curves were recorded in rats microinjected with 8 nmol NaHS in the NTS. PS: Physiological saline.
Figure 4 Effects of the microinjection of NaHS (4 nmol and 8 nmol) and physiological saline into the nucleus tractus solitarius before and after the gastric motility data.
A: Total amplitude of the contraction wave (T.A.C.W.); B: Total duration of the contraction wave (T.D.C.W.); C: Gastric motility index (G.M.I.); D: Inhibition rates of T.A.C.W., T.D.C.W., and G.M.I. aP < 0.01 vs before injection. PS: Physiological saline; T.A.C.W.: Total amplitude of the contraction wave; T.D.C.W.: Total duration of the contraction wave; G.M.I.: Gastric motility index.
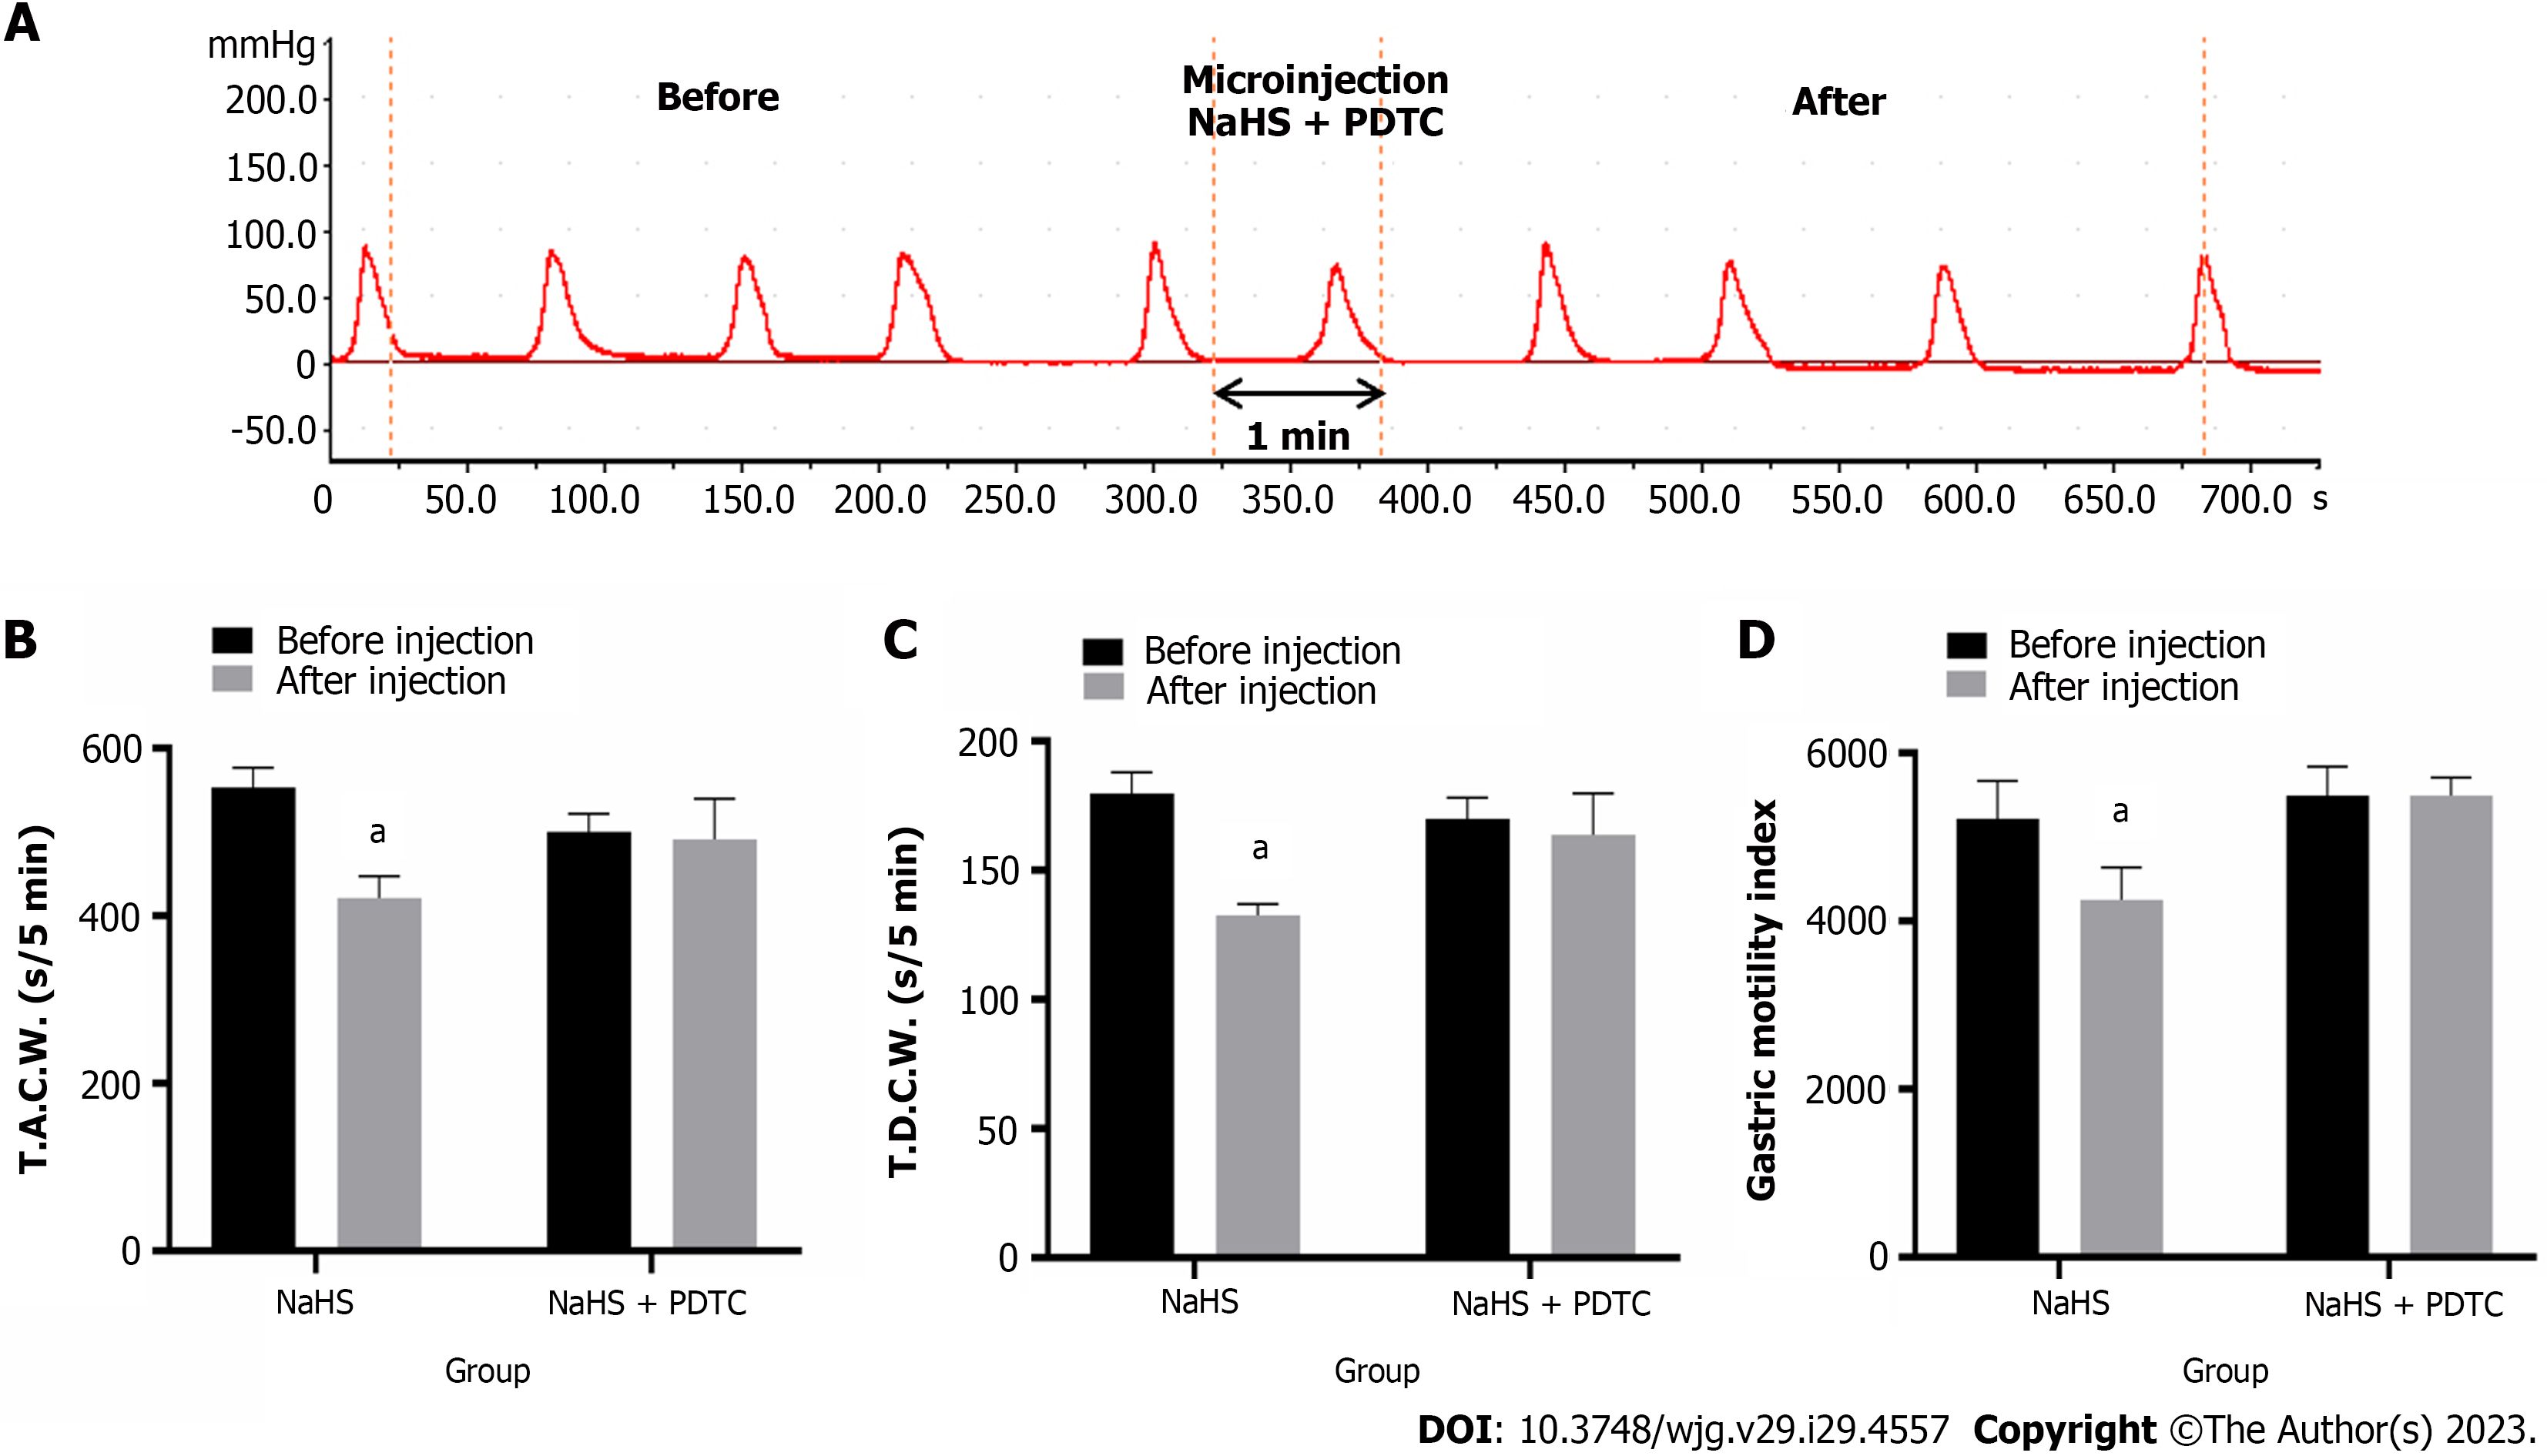
Figure 5 Effect of microinjection of 4 nmol NaHS and 4 nmol NaHS + pyrrolidine dithiocarbamate into the nucleus tractus solitarius on gastric motility in rats.
A: Gastric motility curve recorded in rats with 4 nmol NaHS + pyrrolidine dithiocarbamate microinjection in nucleus tractus solitarius; B: Data of total amplitude of the contraction wave; C: Data of total duration of the contraction wave; D: Data of gastric motility index. aP < 0.01 vs before injection. PDTC: Pyrrolidine dithiocarbamate; T.A.C.W.: Total amplitude of the contraction wave; T.D.C.W.: Total duration of the contraction wave.
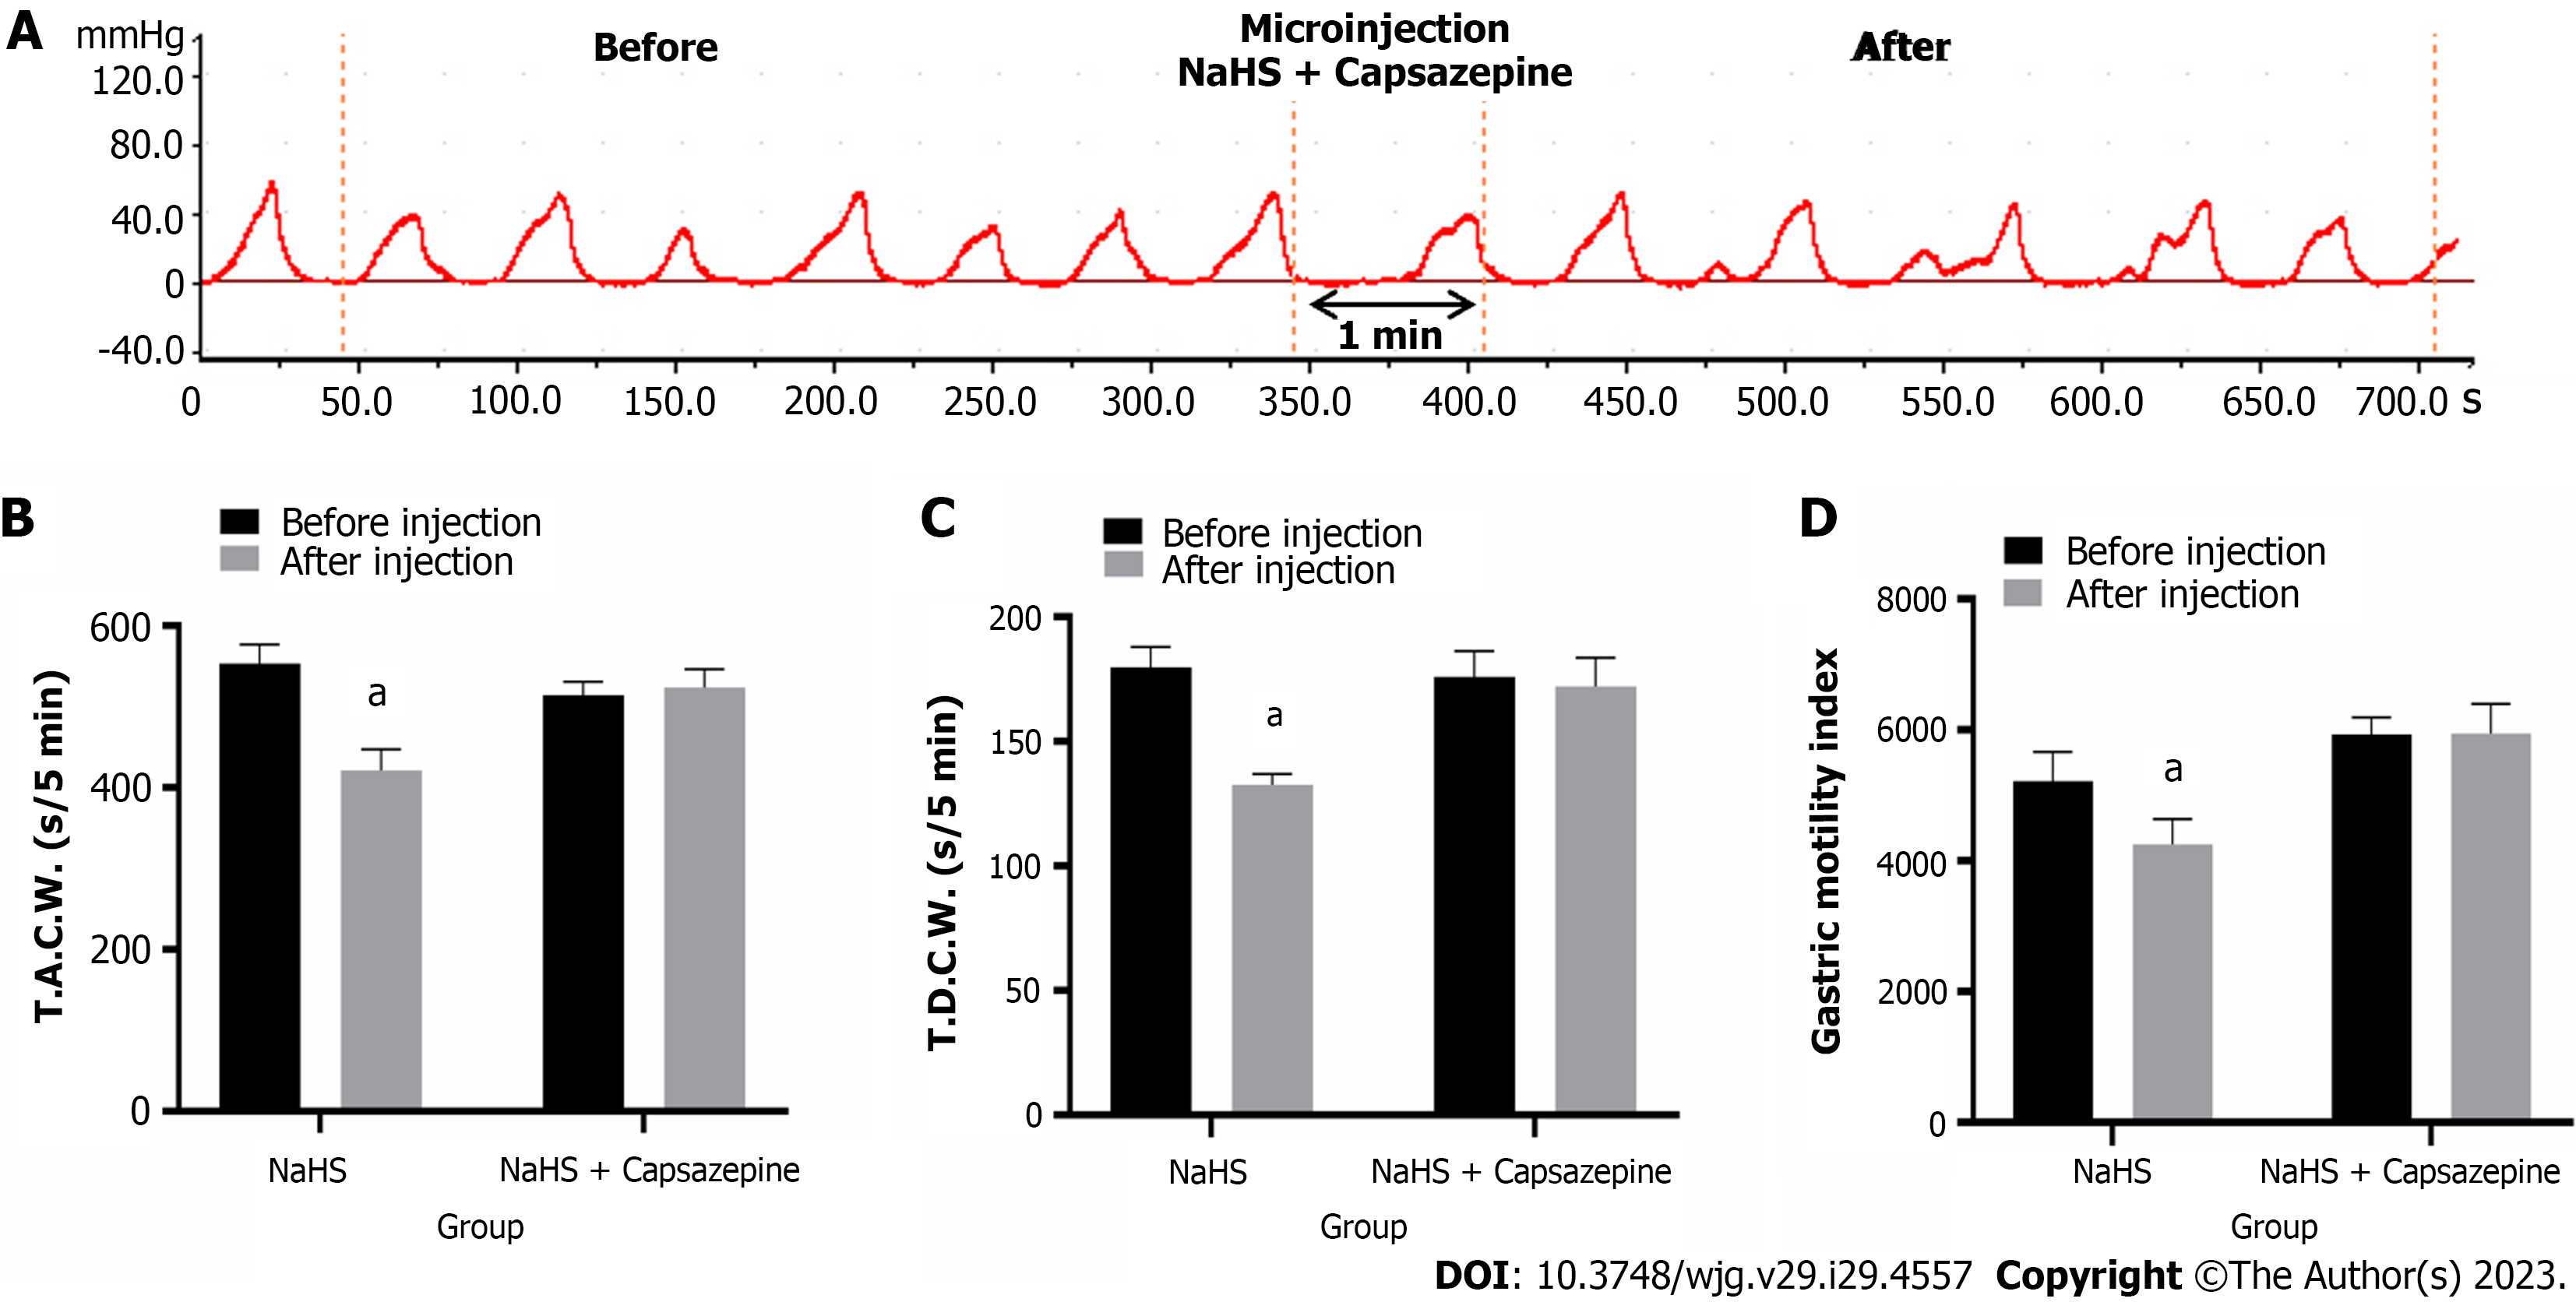
Figure 6 Effects of microinjection of 4 nmol NaHS and 4 nmol NaHS + Capsazepine into the nucleus tractus solitarius on gastric motility in rats.
A: Gastric motility curve recorded in rats with 4 nmol NaHS + Capsazepine microinjection in nucleus tractus solitarius; B: Data of total amplitude of the contraction wave; C: Data of total duration of the contraction wave; D: Data of gastric motility index. aP < 0.01 vs before injection. T.A.C.W.: Total amplitude of the contraction wave; T.D.C.W.: Total duration of the contraction wave.
Figure 7 Effects of microinjection of 4 nmol NaHS and 4 nmol NaHS + L703606 into the nucleus tractus solitarius on gastric motility in rats.
A: Gastric motility curve recorded in rats with 4 nmol NaHS + L703606 microinjection in nucleus tractus solitarius; B: Data of total amplitude of the contraction wave; C: Data of total duration of the contraction wave; D: Data of gastric motility index. aP < 0.01 vs before injection. T.A.C.W.: Total amplitude of the contraction wave; T.D.C.W.: Total duration of the contraction wave.
- Citation: Sun HZ, Li CY, Shi Y, Li JJ, Wang YY, Han LN, Zhu LJ, Zhang YF. Effect of exogenous hydrogen sulfide in the nucleus tractus solitarius on gastric motility in rats. World J Gastroenterol 2023; 29(29): 4557-4570
- URL: https://www.wjgnet.com/1007-9327/full/v29/i29/4557.htm
- DOI: https://dx.doi.org/10.3748/wjg.v29.i29.4557


