Copyright
©The Author(s) 2023.
World J Gastroenterol. Jul 14, 2023; 29(26): 4200-4213
Published online Jul 14, 2023. doi: 10.3748/wjg.v29.i26.4200
Published online Jul 14, 2023. doi: 10.3748/wjg.v29.i26.4200
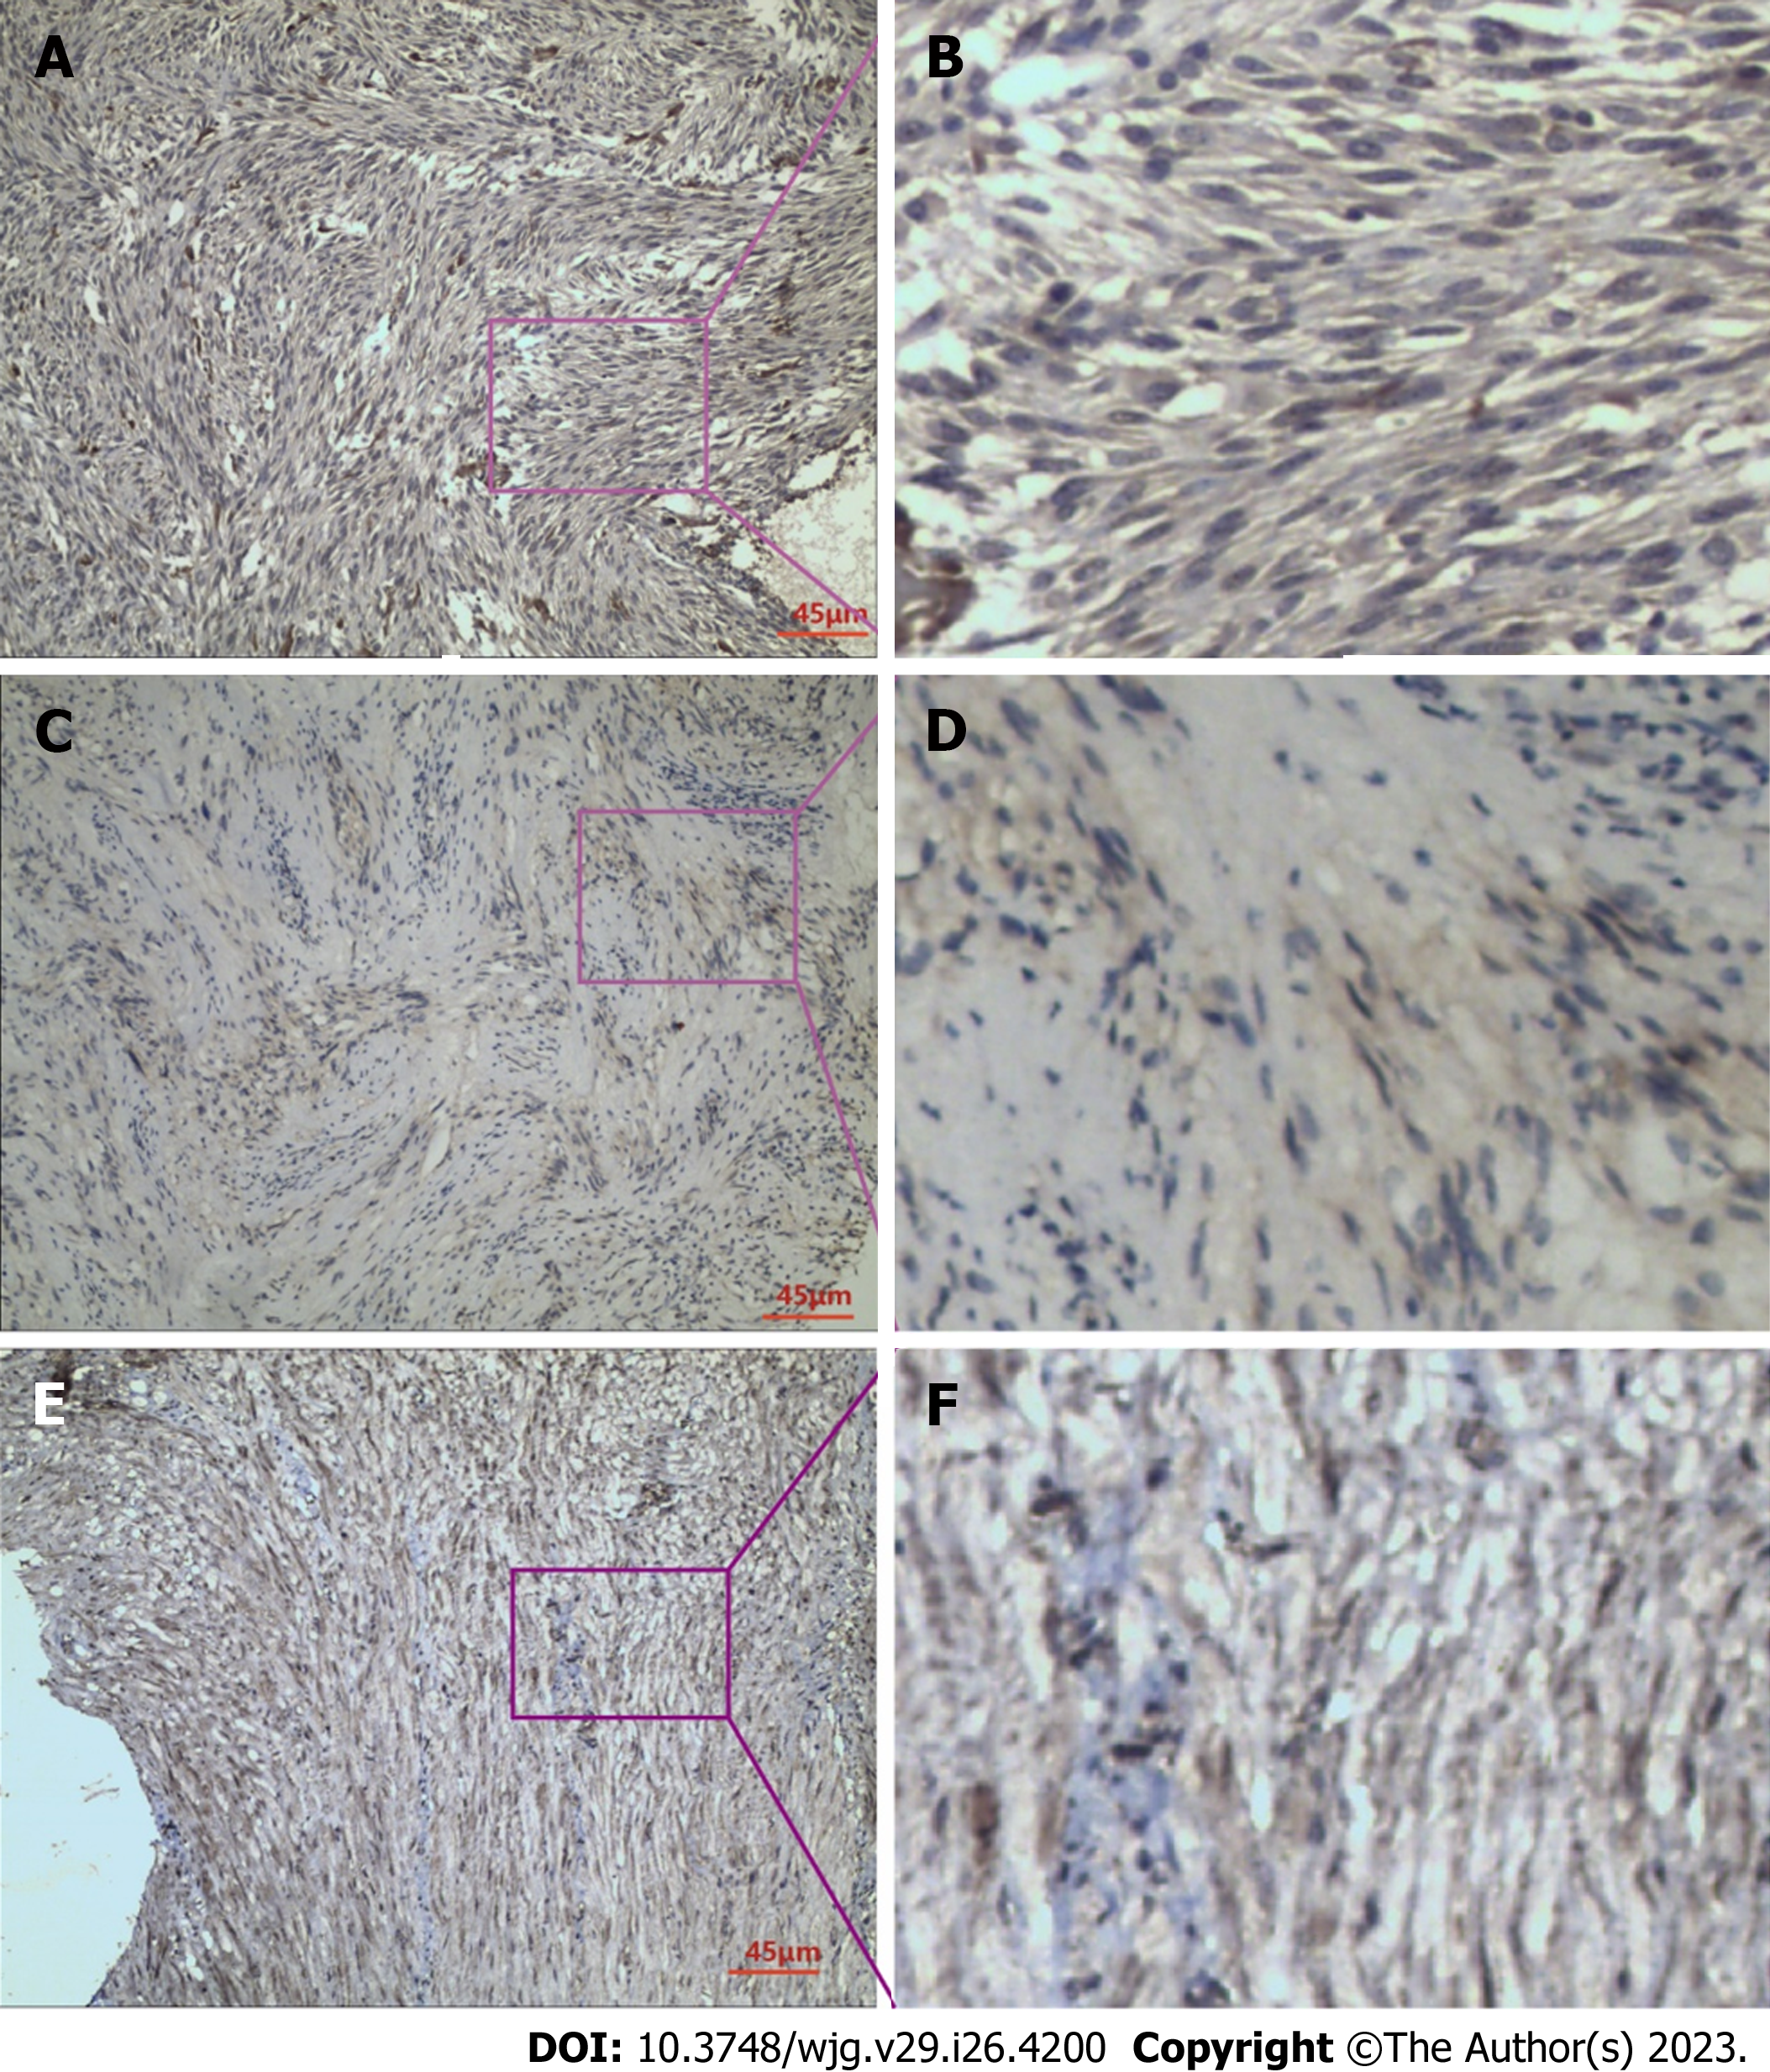
Figure 1 Immunohistochemical staining.
A: Immunohistochemical staining for raf kinase inhibitor protein (RKIP) in gastrointestinal stromal tumor (GIST) tissues; B: RKIP protein showed positive expression in the cytoplasm and cell membrane, appearing as brownish-yellow or brown granules; C: Immunohistochemical staining for phosphorylated-extracellular signal-regulated kinase (P-ERK) in GIST tissues; D: P-ERK protein exhibited heterogeneous distribution in GIST cells, mainly in the cytoplasm, with occasional presence in the nucleus, and appeared as brownish-yellow granules; E: Immunohistochemical staining for phosphorylated-mitogen-activated protein kinase/ERK Kinase (P-MEK) in GIST tissues; F: P-MEK protein expression in GIST cells was observed as brownish-yellow granules, mainly distributed in the cytoplasm, with some in the nucleus, and showed a relatively uniform distribution. A, C and E were taken under 200 × magnification.
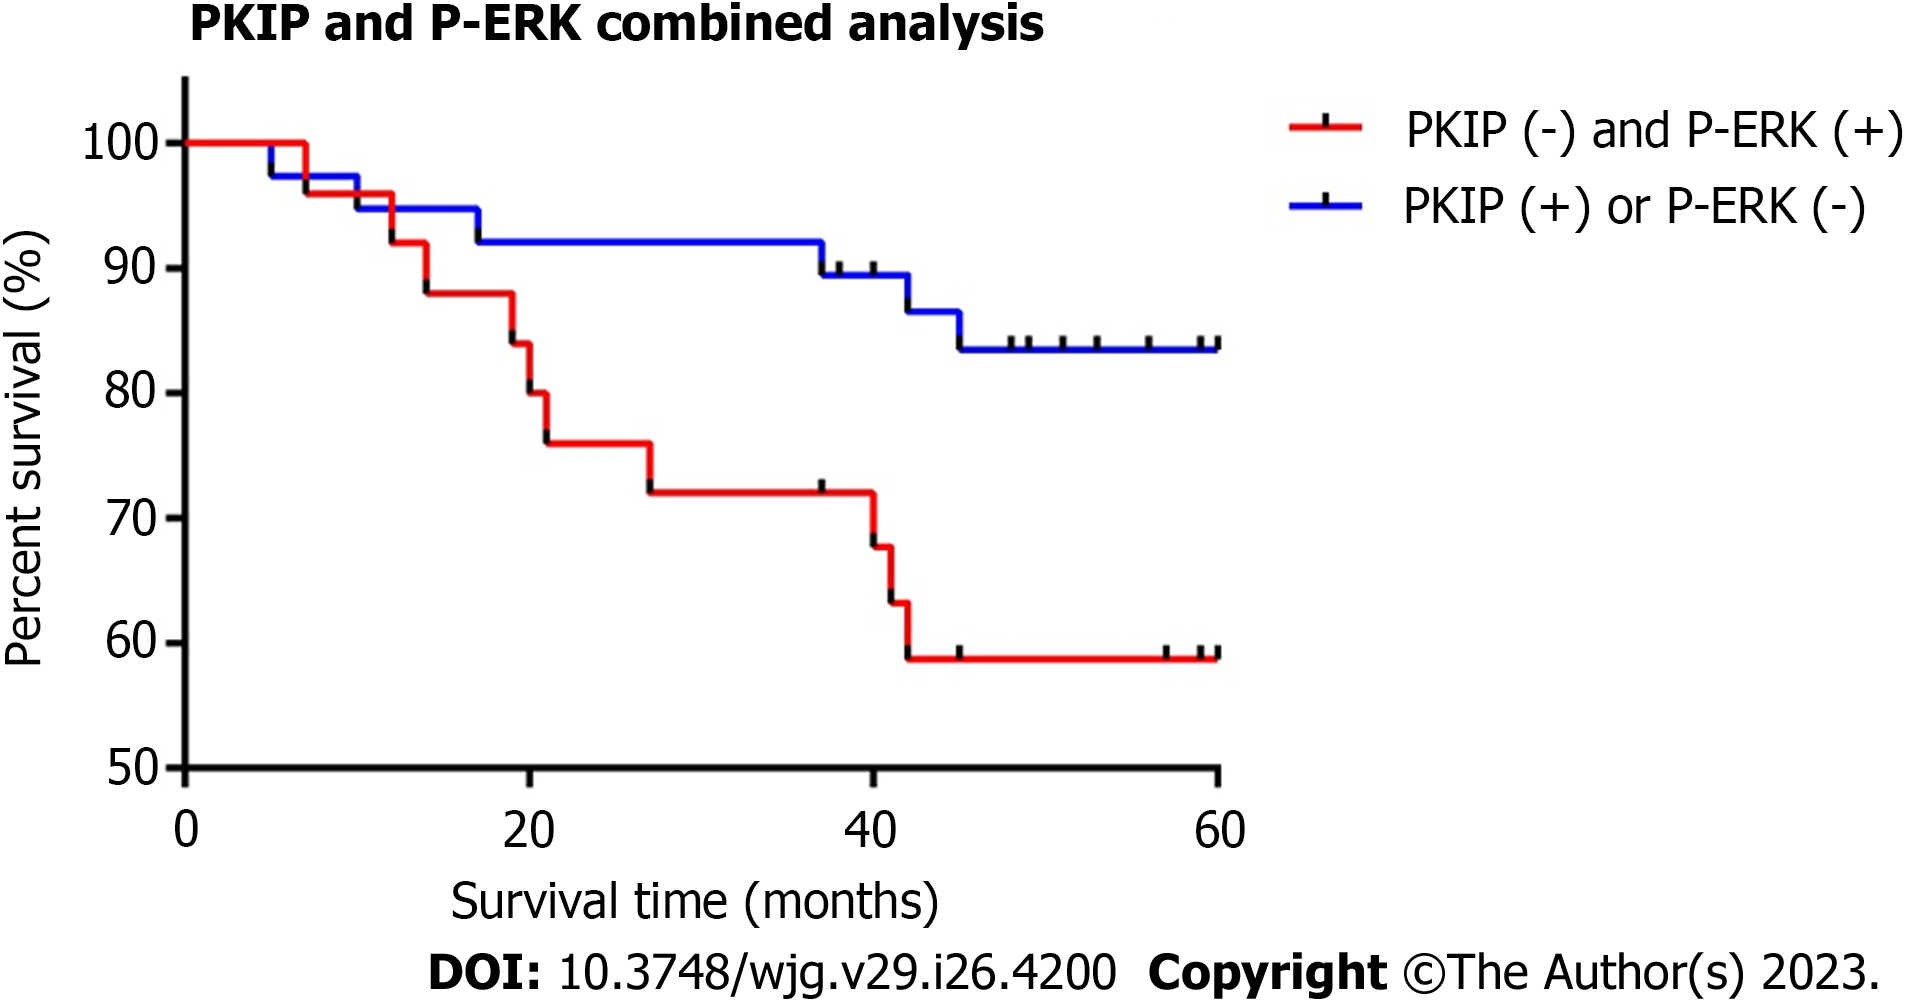
Figure 2 Relationship between raf kinase inhibitor protein and phosphorylated-extracellular-signal regulated kinase co-expression and prognosis in gastrointestinal stromal tumors.
Comparison with the raf kinase inhibitor protein (RKIP)-negative and phosphorylated-extracellular signal-regulated kinase (P-ERK)-positive groups; RKIP high expression group is correlated with a better survival rate and the difference was significant. Log-rank analysis, P = 0.0312.
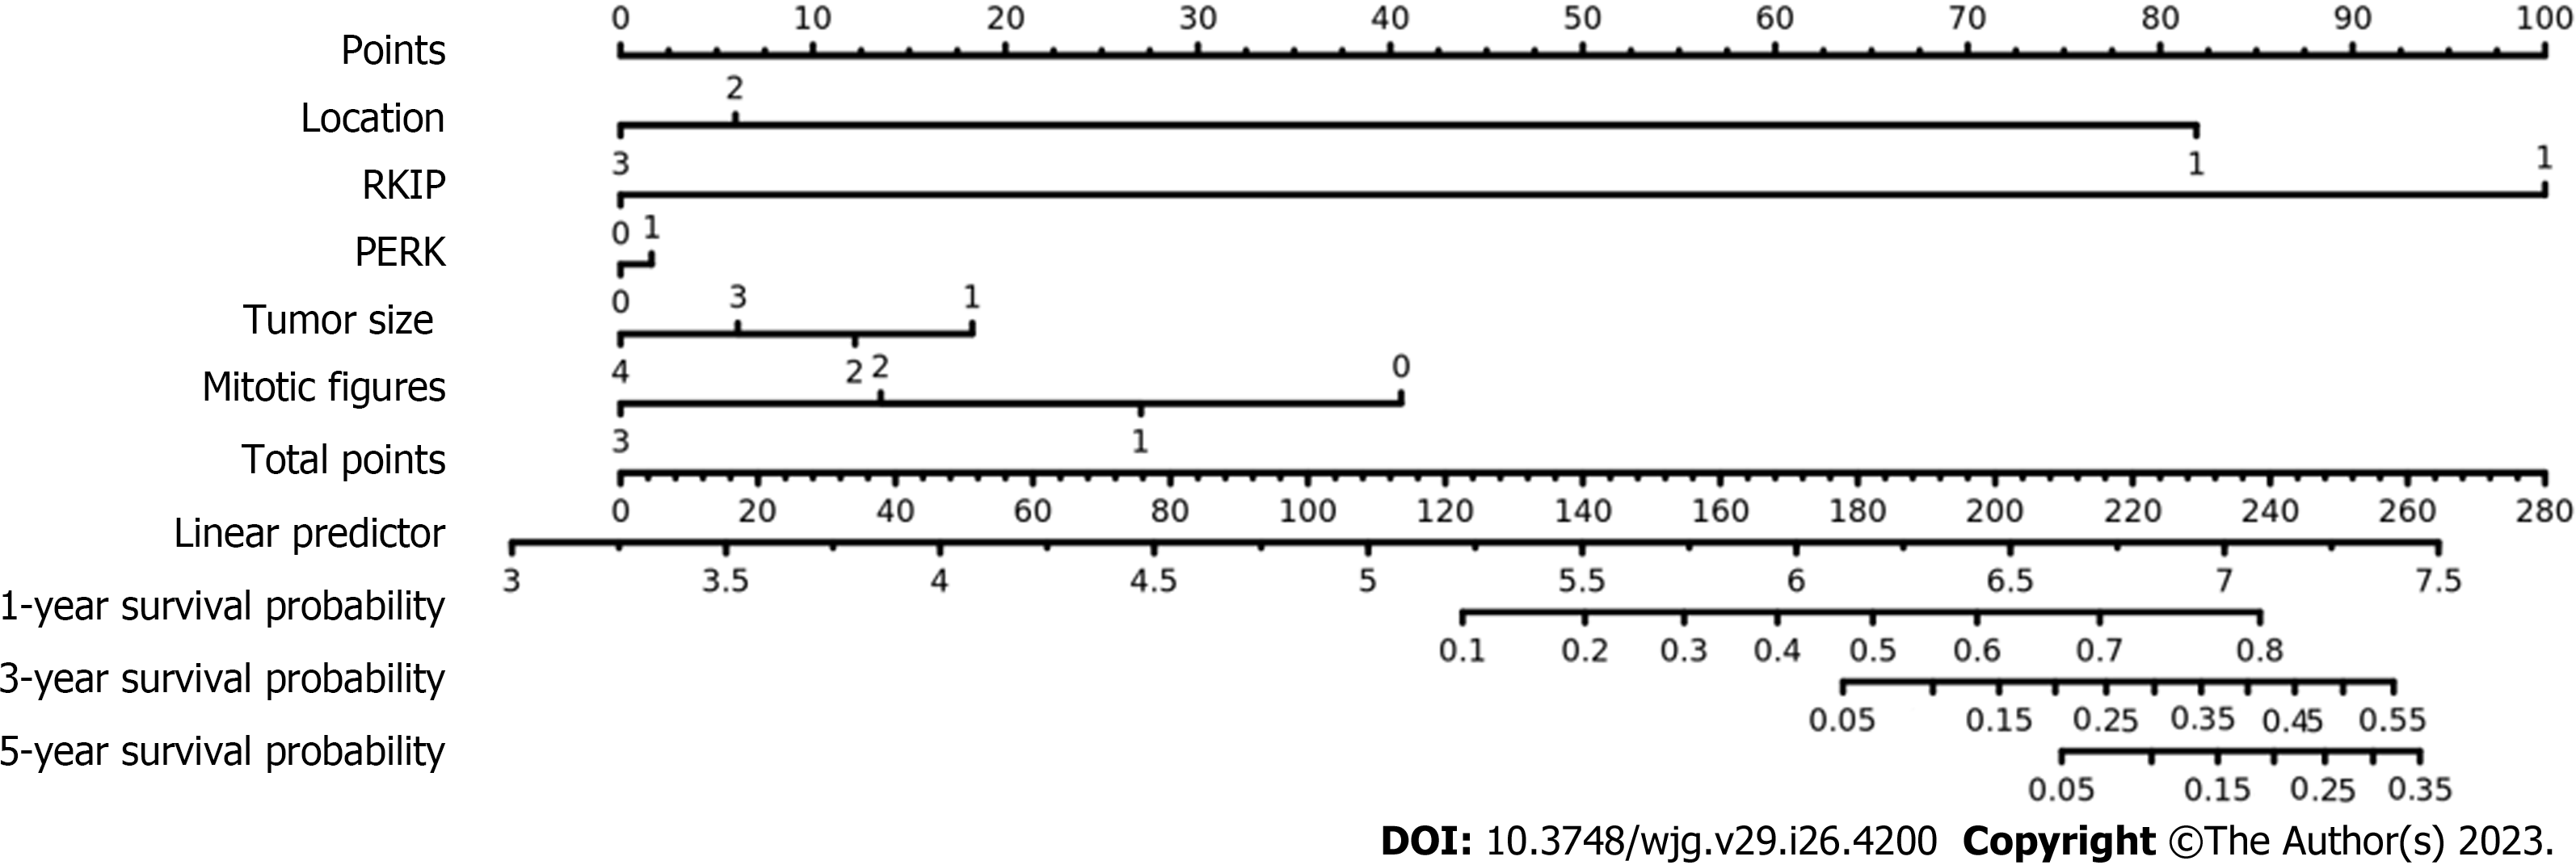
Figure 3 Nomogram for the new risk grade model with consideration of raf kinase inhibitory protein and phosphorylated-extracellular-signal regulated kinase to predict the probabilities of 5-yr survival with gastrointestinal stromal tumors.
Raf kinase inhibitory protein (RKIP) expression, phosphorylated-extracellular-signal regulated kinase (P-ERK) expression, tumor size, tumor location and mitotic count are involved as assessment factors.
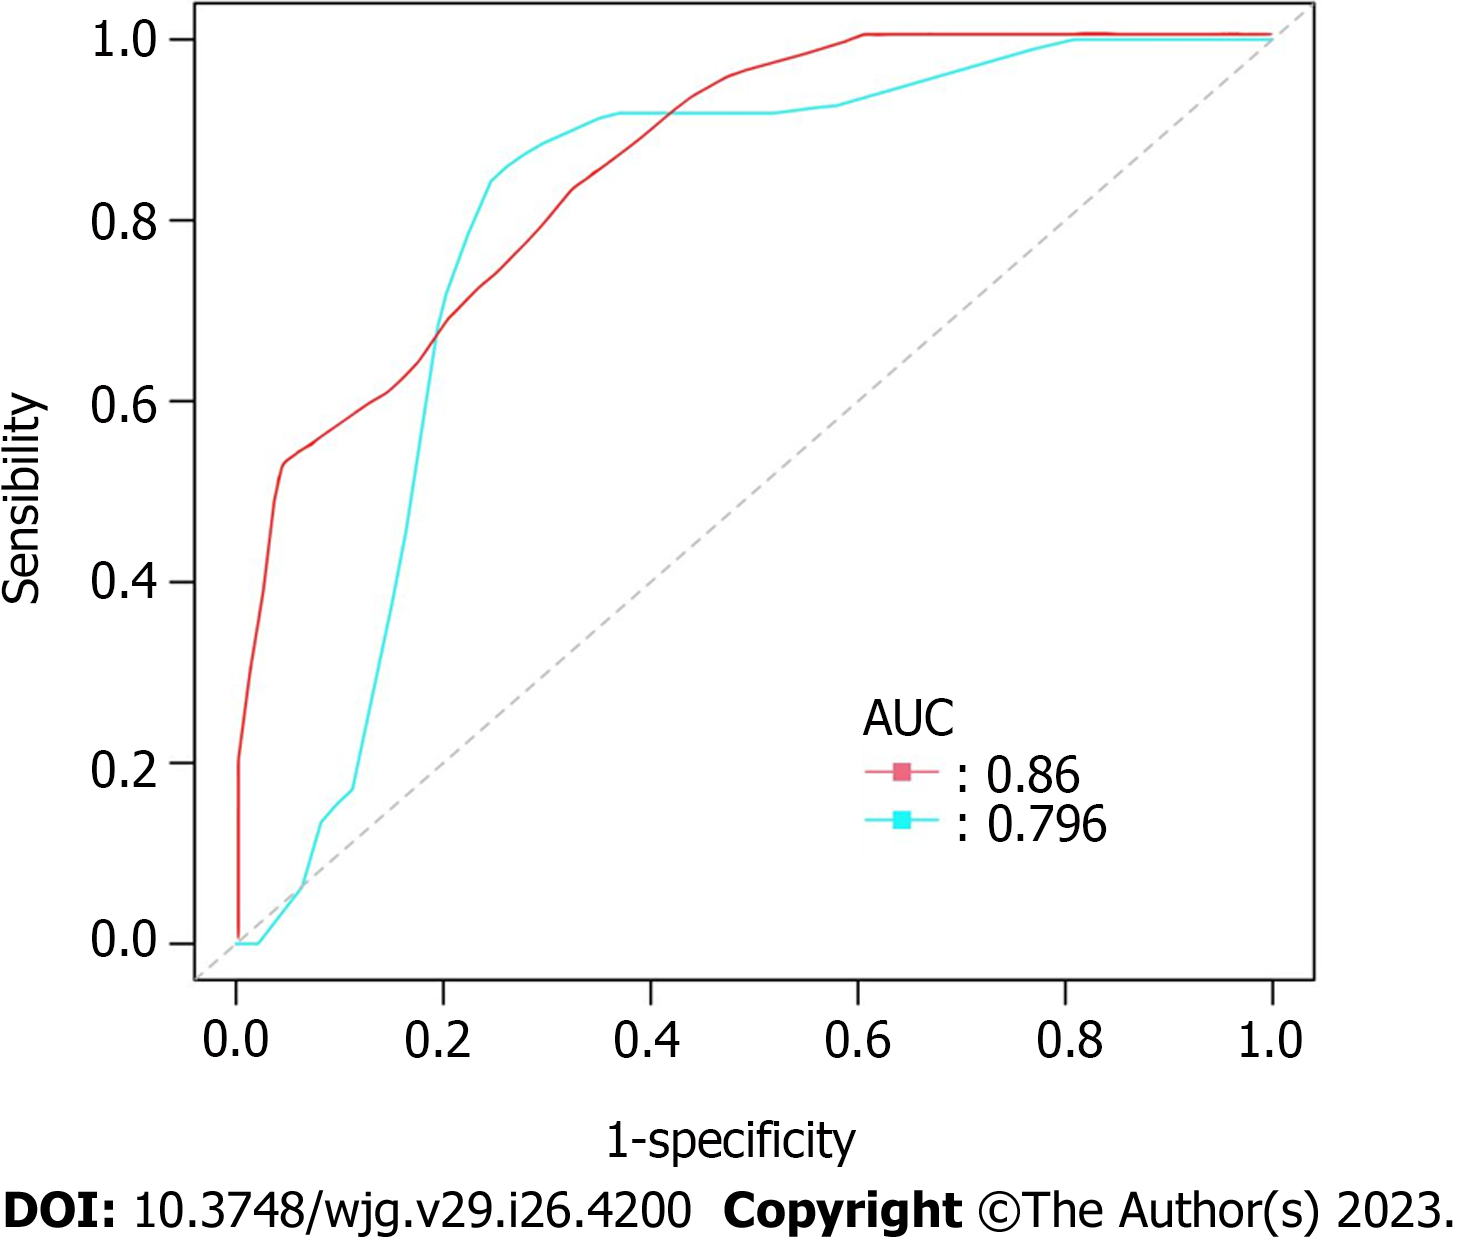
Figure 4 Receiver operating characteristic curves for two risk grade system in predicting overall survival of gastrointestinal stromal tumors.
The red curve represents for the new risk grade model and the blue one represents for National Institutes of Health (NIH) 2008 Risk Grade System. The area under the curve was 0.860 for the new risk grade model, while 0.796 for NIH 2008 Risk Grade System. Compared with the traditional NIH 2008 system, the new model which is with consideration of raf kinase inhibitory protein and phosphorylated-extracellular-signal regulated kinase is correlated with a better prediction efficiency for overall survival of gastrointestinal stromal tumors, the difference was significant. Log-rank analysis, P = 0.0312. AUC: Area under curve.
- Citation: Qu WZ, Wang L, Chen JJ, Wang Y. Raf kinase inhibitor protein combined with phosphorylated extracellular signal-regulated kinase offers valuable prognosis in gastrointestinal stromal tumor. World J Gastroenterol 2023; 29(26): 4200-4213
- URL: https://www.wjgnet.com/1007-9327/full/v29/i26/4200.htm
- DOI: https://dx.doi.org/10.3748/wjg.v29.i26.4200


