Copyright
©The Author(s) 2023.
World J Gastroenterol. Jun 28, 2023; 29(24): 3871-3882
Published online Jun 28, 2023. doi: 10.3748/wjg.v29.i24.3871
Published online Jun 28, 2023. doi: 10.3748/wjg.v29.i24.3871
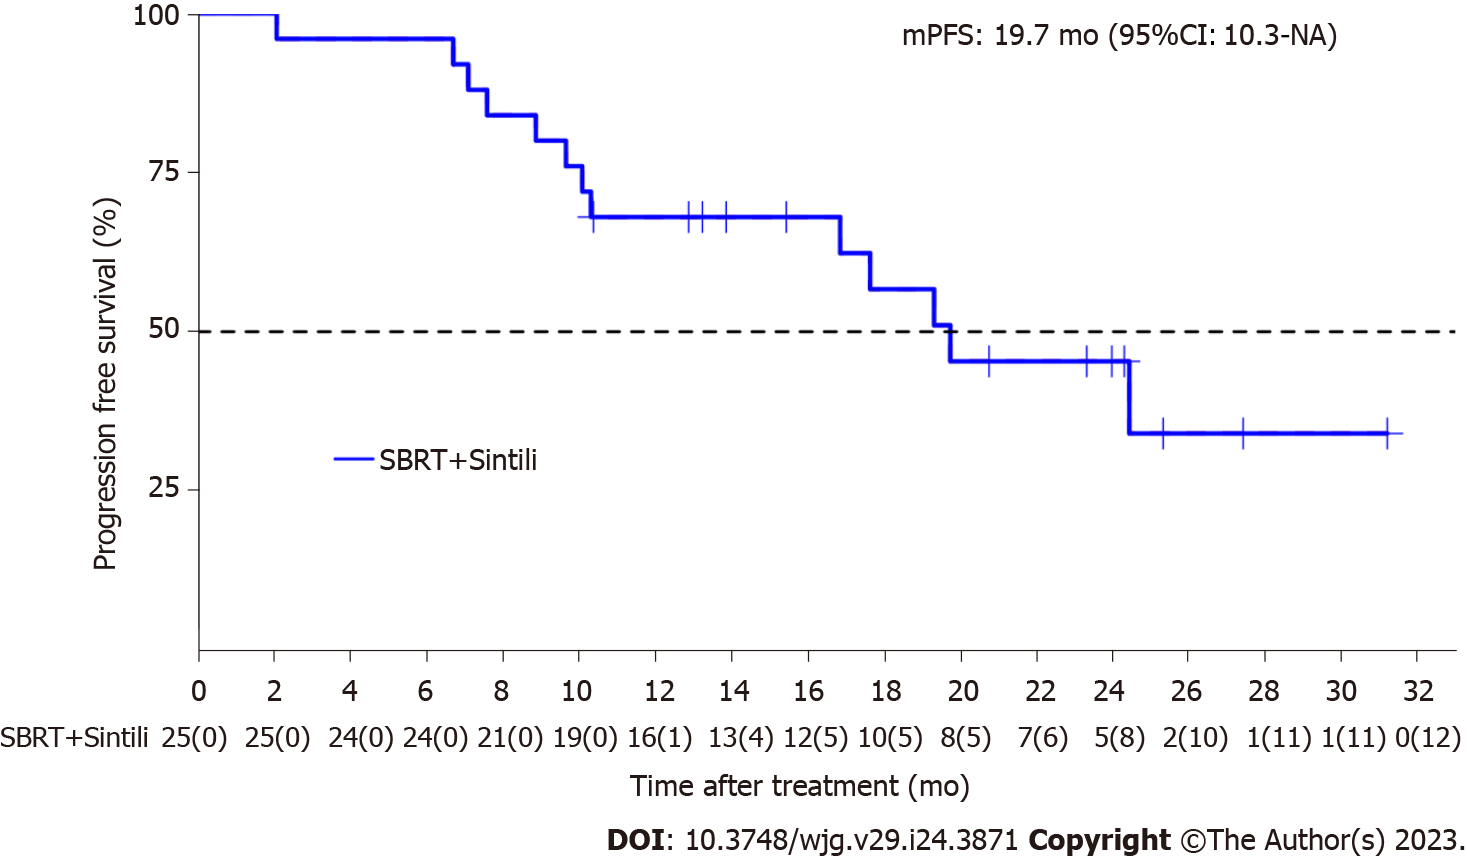
Figure 1 Kaplan-Meier analysis of median progression-free survival according to the response evaluation criteria in solid tumors version 1.
1. mPFS: Median progression-free survival; SBRT: Stereotactic body radiotherapy.
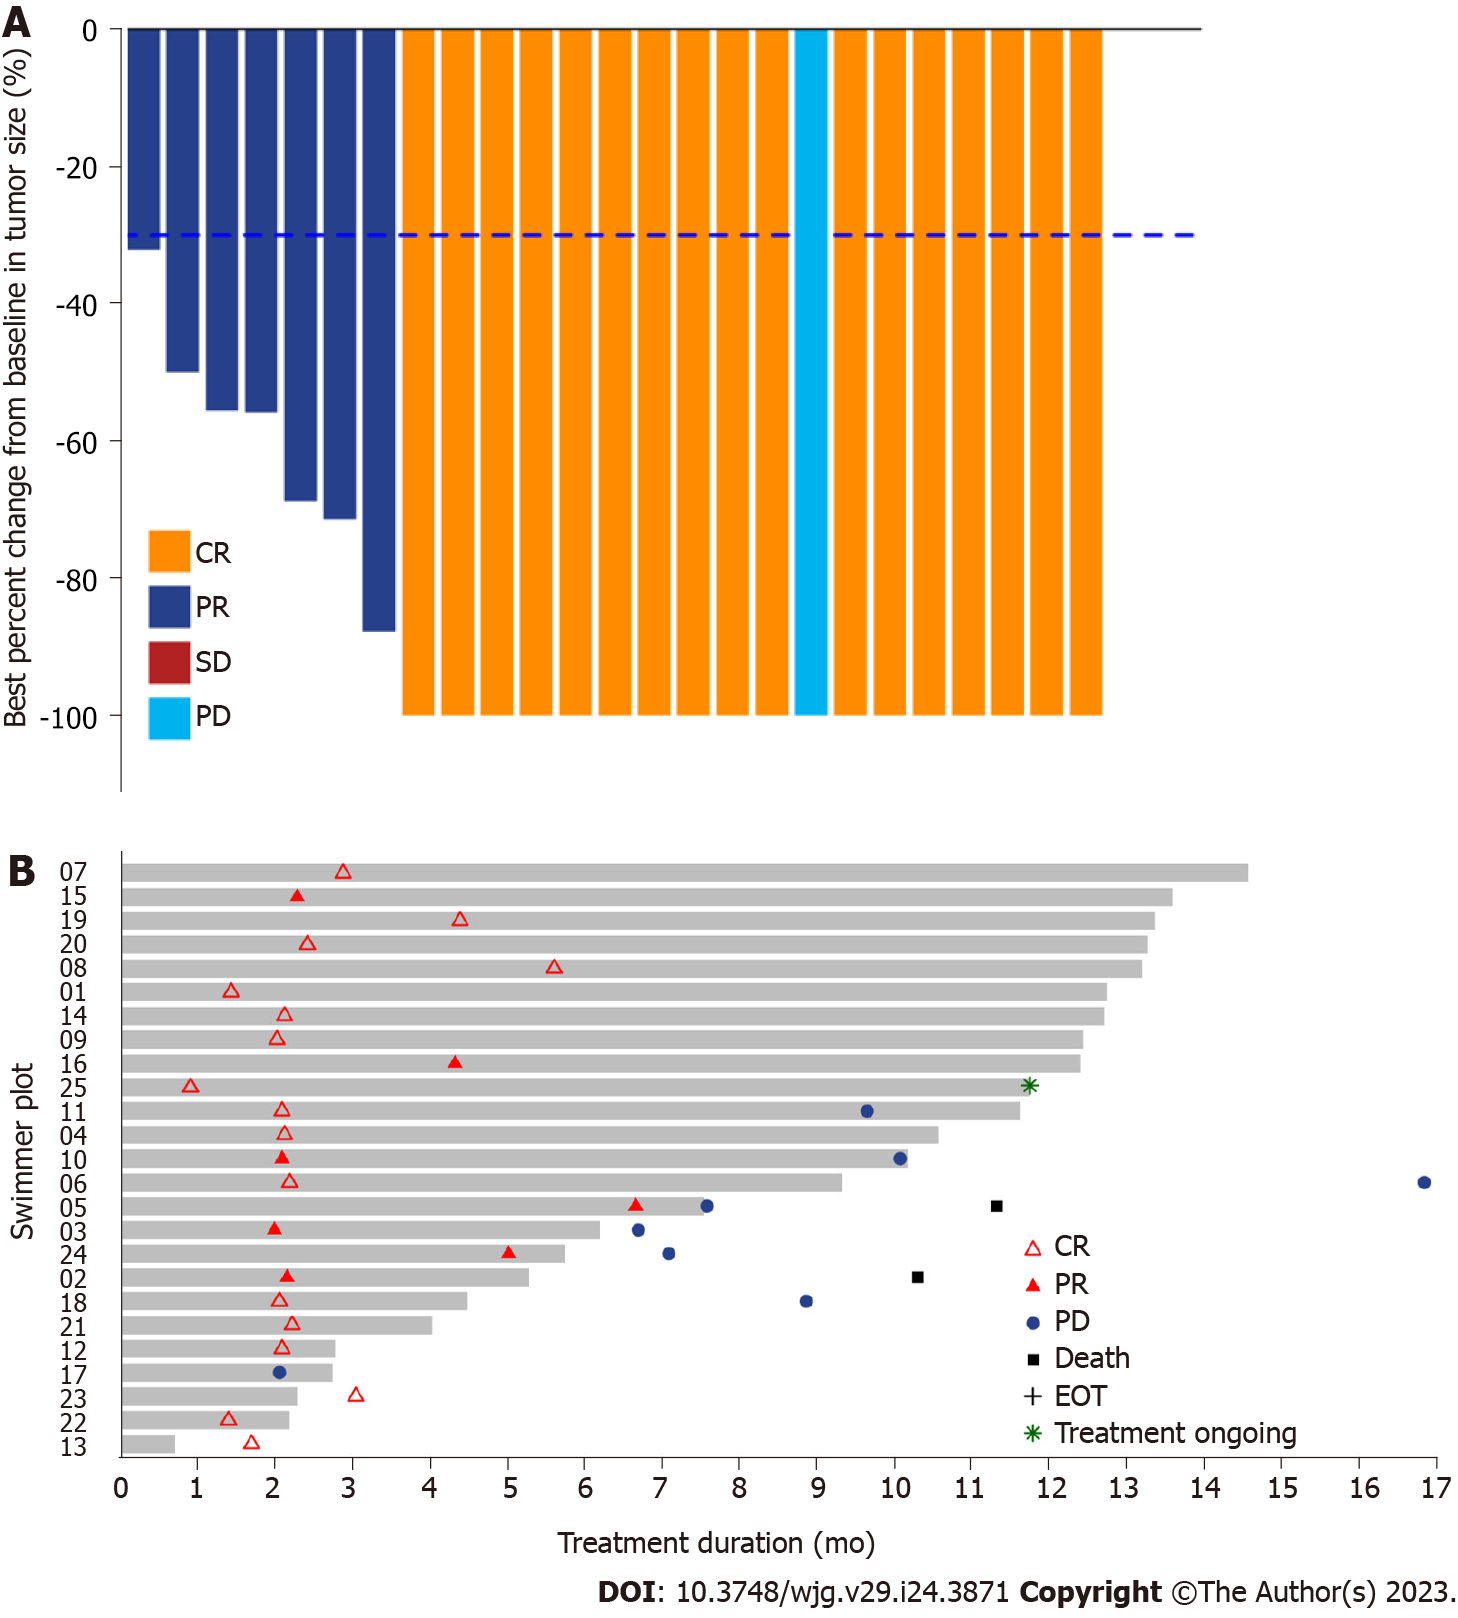
Figure 2 Radiographic responses to stereotactic body radiotherapy plus sintilimab.
A: Waterfall plots of the proportion of patients with an overall response according to the response evaluation criteria in solid tumors version 1.1; B: The swimmer plot shows the treatment duration for patients receiving stereotactic body radiotherapy and sintilimab. CR: Complete response; PR: Partial response; PD: Progressive disease; EOT: End-of-treatment; SD: Stable disease.
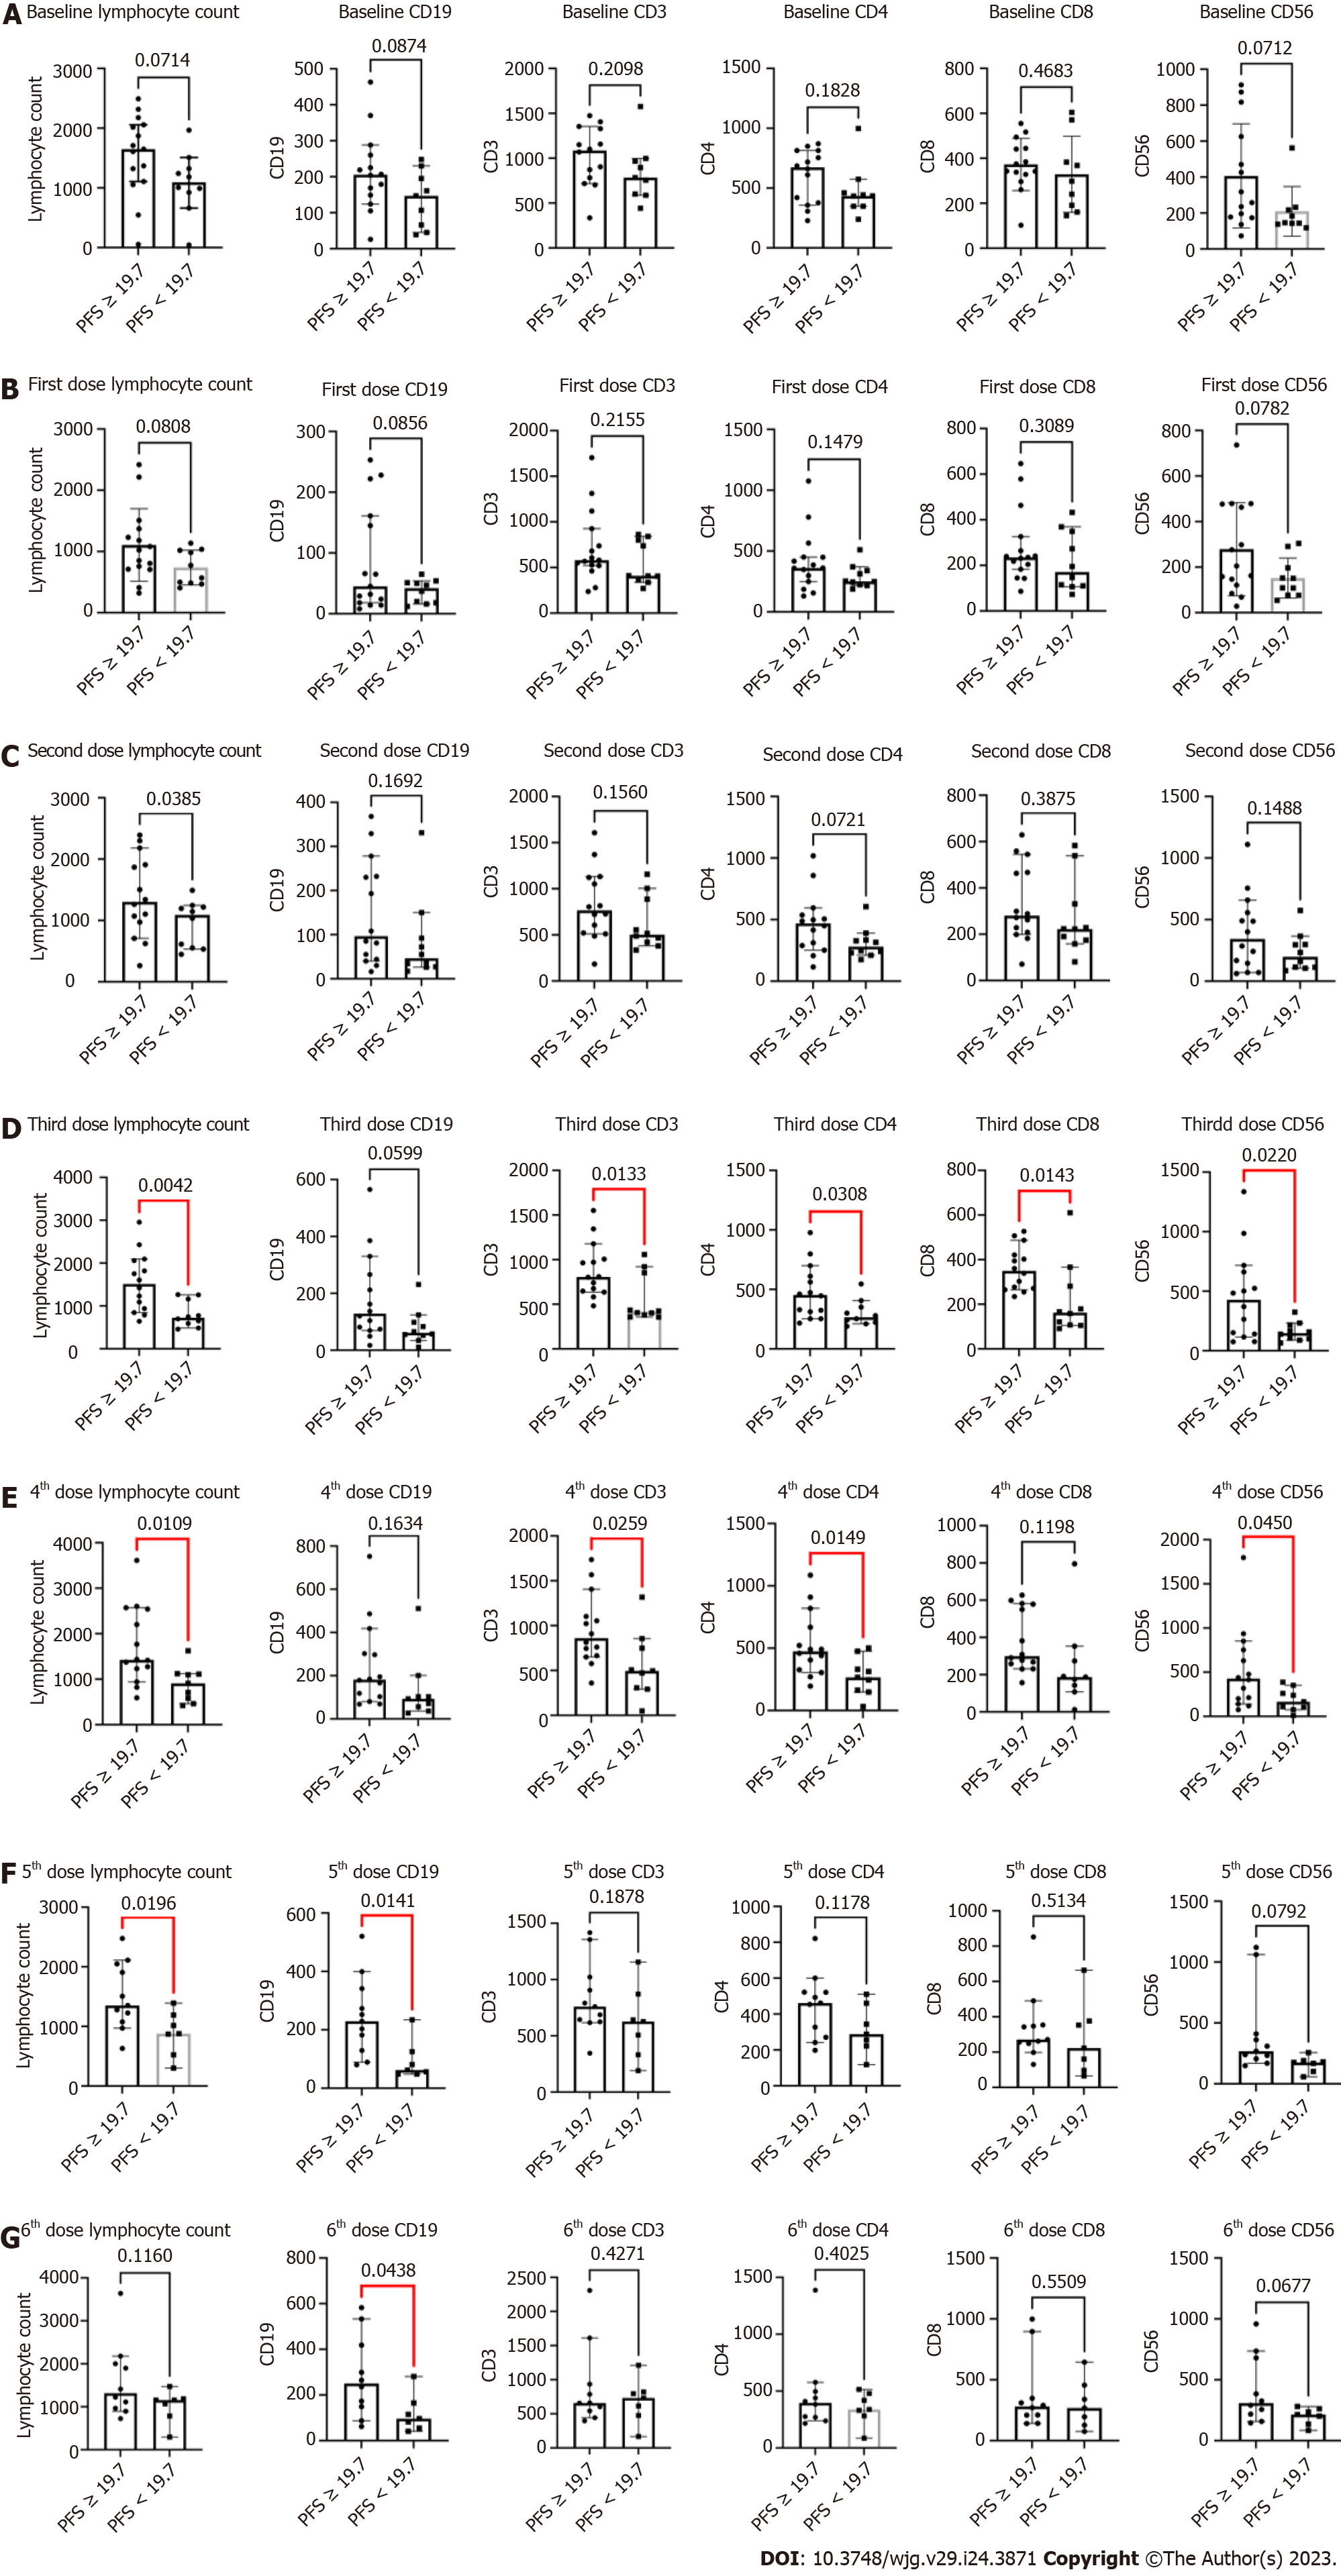
Figure 3 Biomarker analysis.
A: Baseline: Progression-free survival (PFS) ≥ 19.7 vs PFS < 19.7; B: 1st Dose: PFS ≥ 19.7 vs PFS < 19.7; C: 2nd Dose: PFS ≥ 19.7 vs PFS < 19.7; D: 3rd Dose: PFS ≥ 19.7 vs PFS < 19.7; E: 4th Dose: PFS ≥ 19.7 vs PFS < 19.7; F: 5th Dose: PFS ≥ 19.7 vs PFS < 19.7; G: 6th Dose: PFS ≥ 19.7 vs PFS < 19.7. PFS: Progression-free survival.
- Citation: Chen YX, Yang P, Du SS, Zhuang Y, Huang C, Hu Y, Zhu WC, Yu YY, Liu TS, Zeng ZC. Stereotactic body radiotherapy combined with sintilimab in patients with recurrent or oligometastatic hepatocellular carcinoma: A phase II clinical trial. World J Gastroenterol 2023; 29(24): 3871-3882
- URL: https://www.wjgnet.com/1007-9327/full/v29/i24/3871.htm
- DOI: https://dx.doi.org/10.3748/wjg.v29.i24.3871


