Copyright
©The Author(s) 2023.
World J Gastroenterol. Jun 28, 2023; 29(24): 3825-3842
Published online Jun 28, 2023. doi: 10.3748/wjg.v29.i24.3825
Published online Jun 28, 2023. doi: 10.3748/wjg.v29.i24.3825
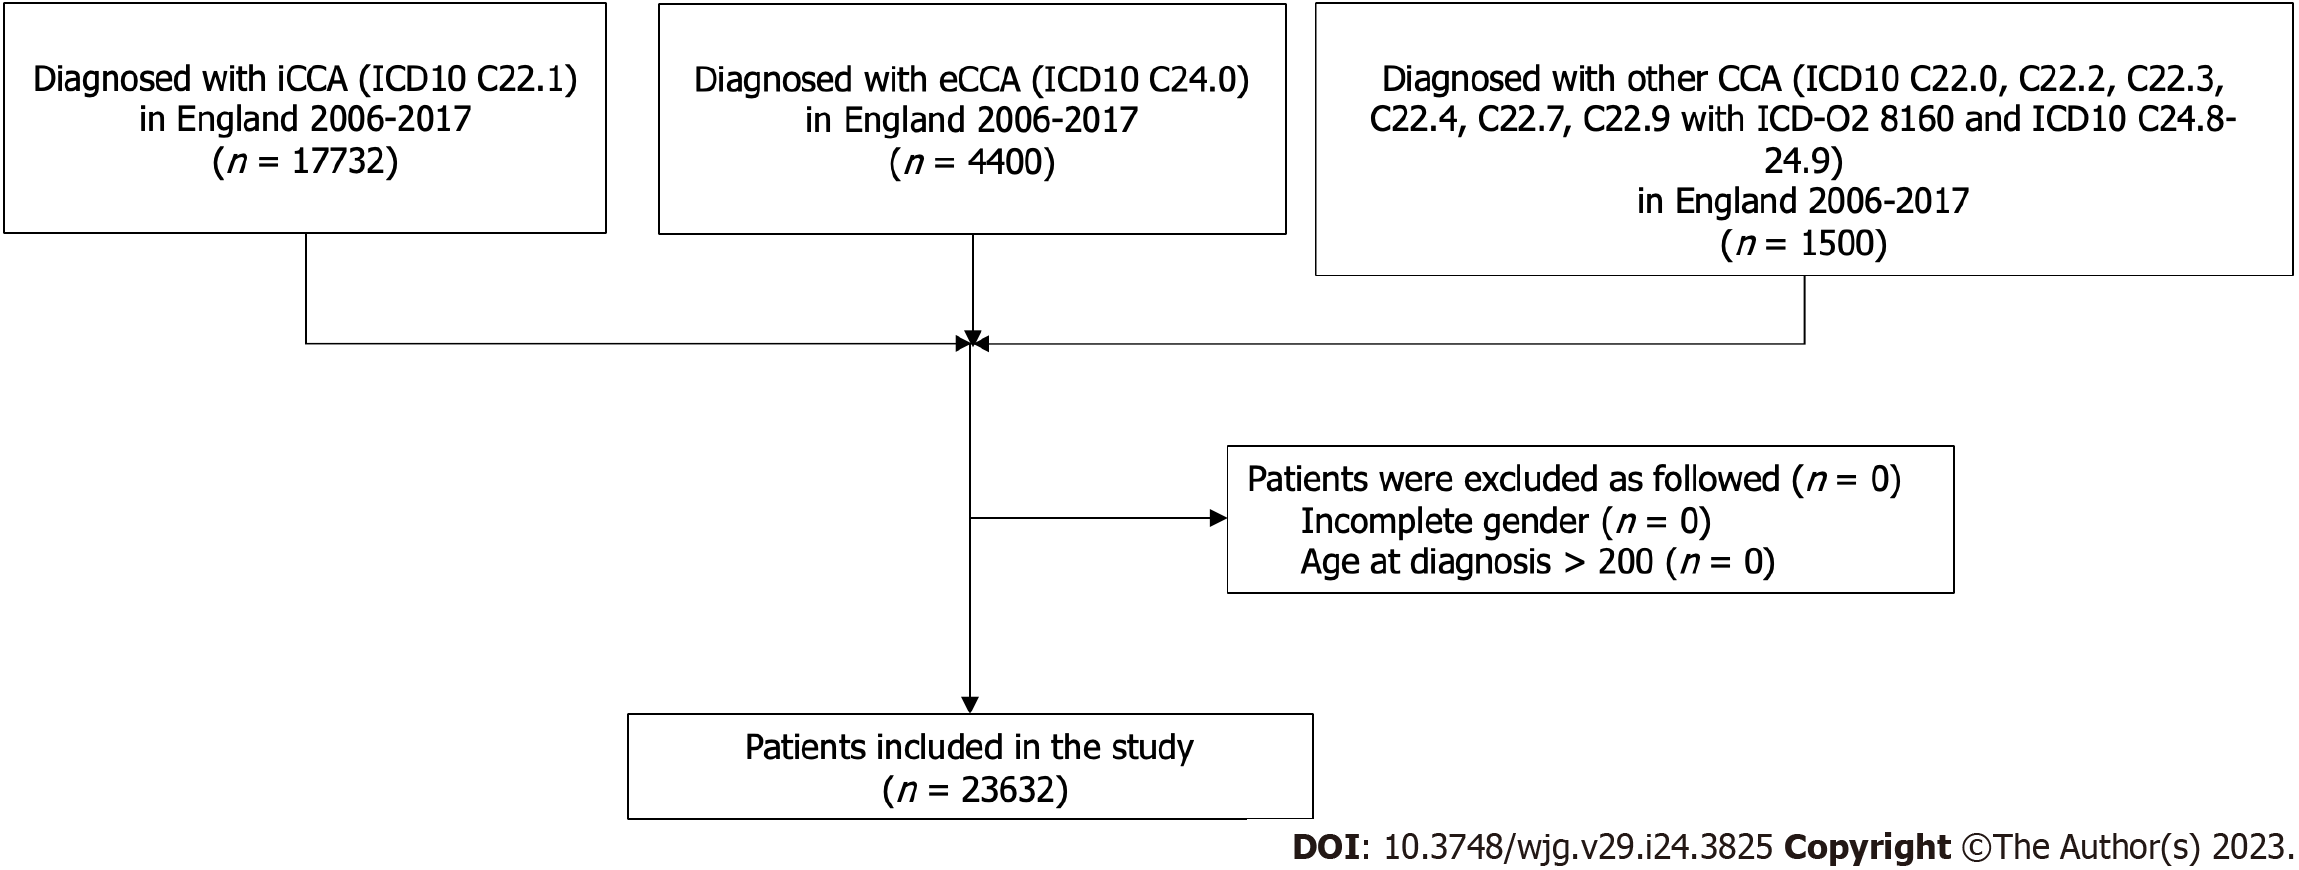
Figure 1 Flow diagram of eligible patients.
iCCA: Intrahepatic cholangiocarcinoma; eCCA: Extrahepatic cholangiocarcinoma; CCA: Cholangiocarcinoma; ICD: International Classification of Disease.
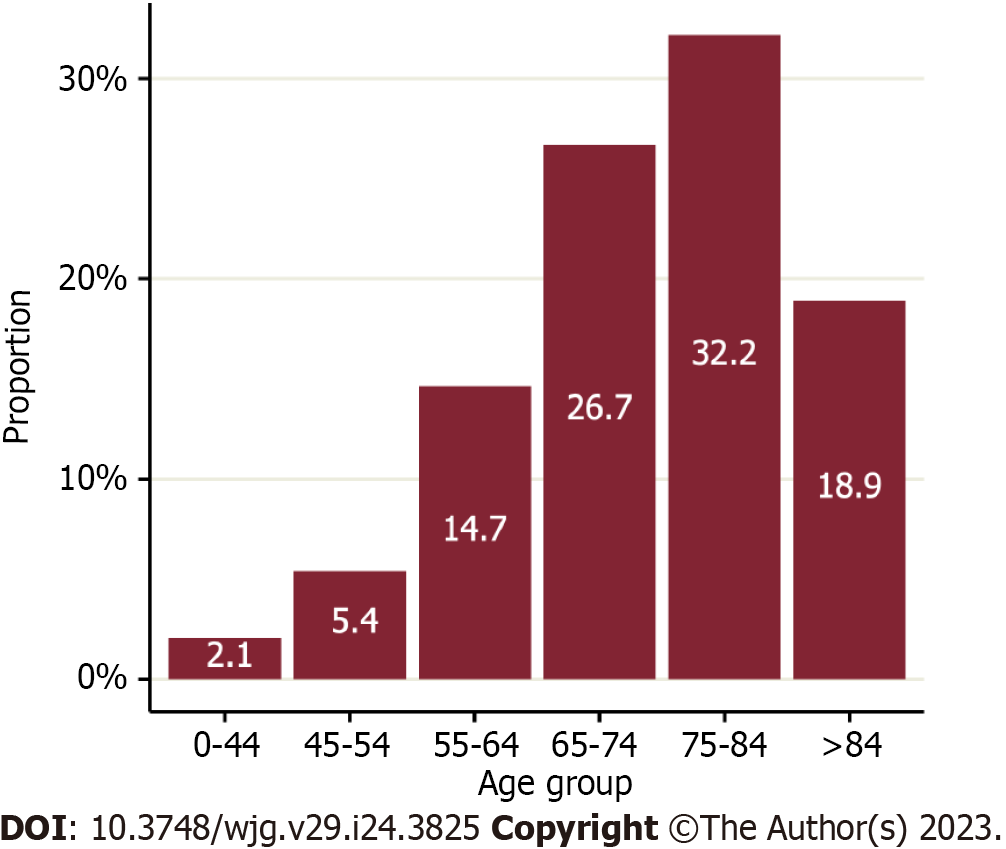
Figure 2 Age at diagnosis for cholangiocarcinoma cohort diagnosed in England 2006-2017.
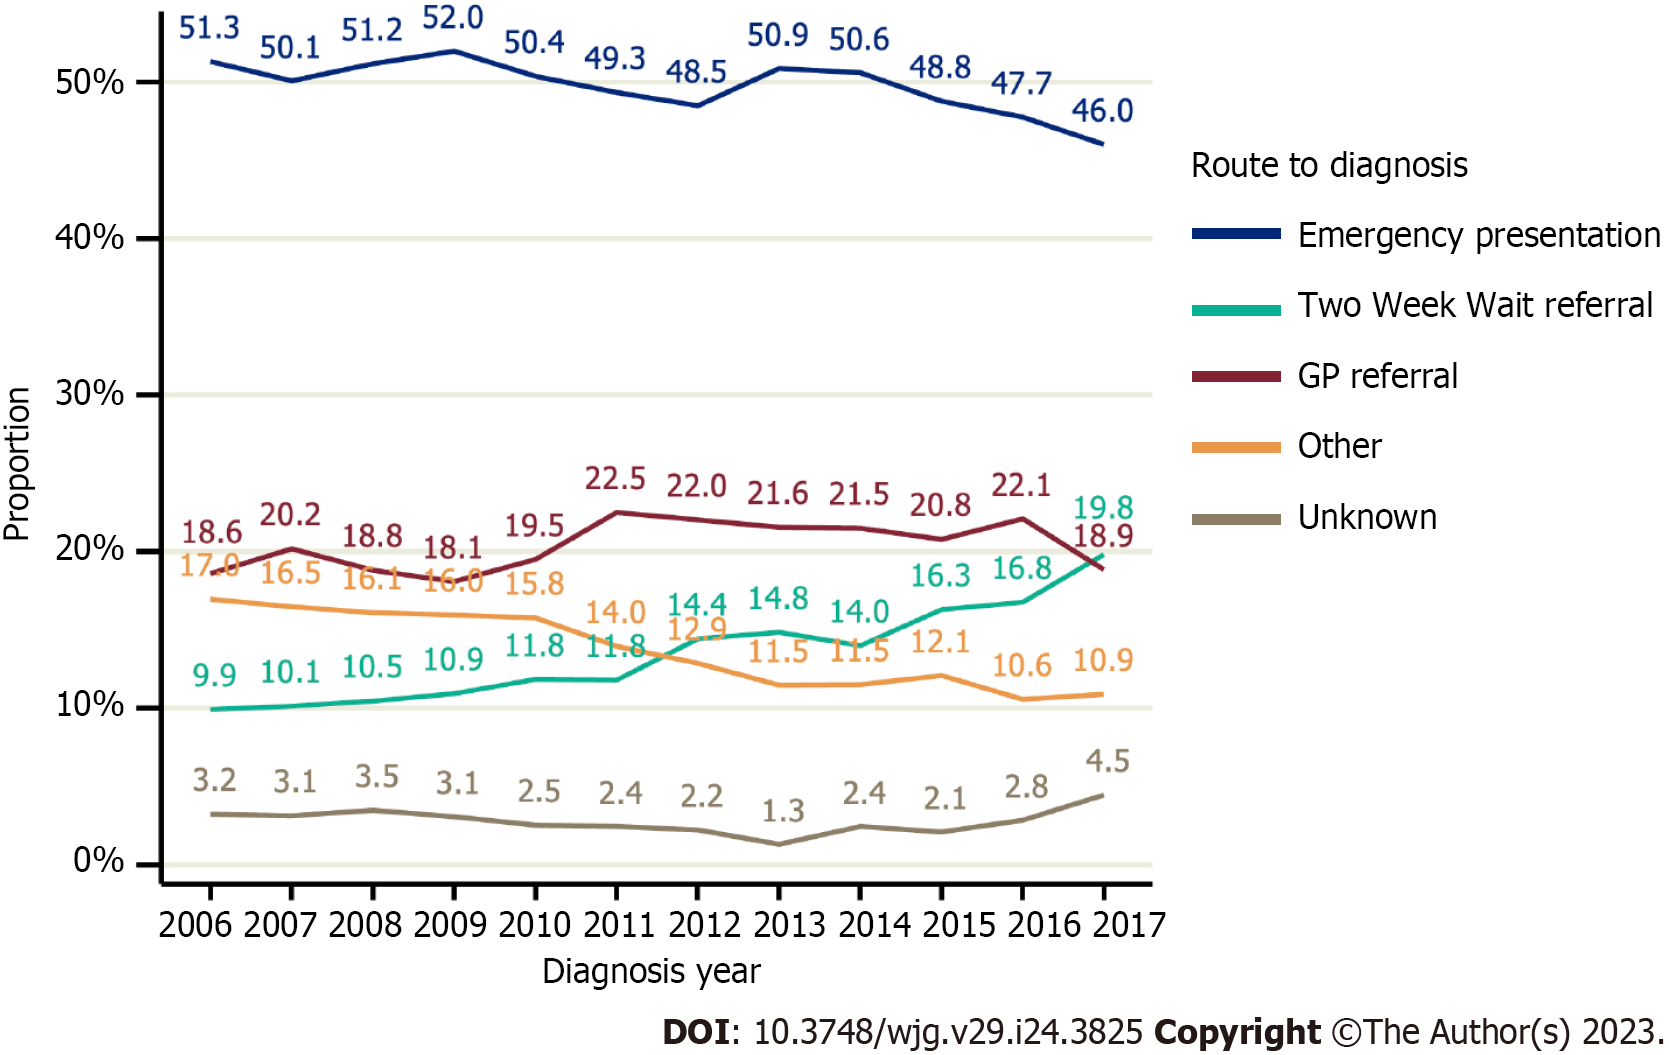
Figure 3 Routes to diagnosis of cholangiocarcinoma patients in England, 2006-2017.
GP: General practitioner.
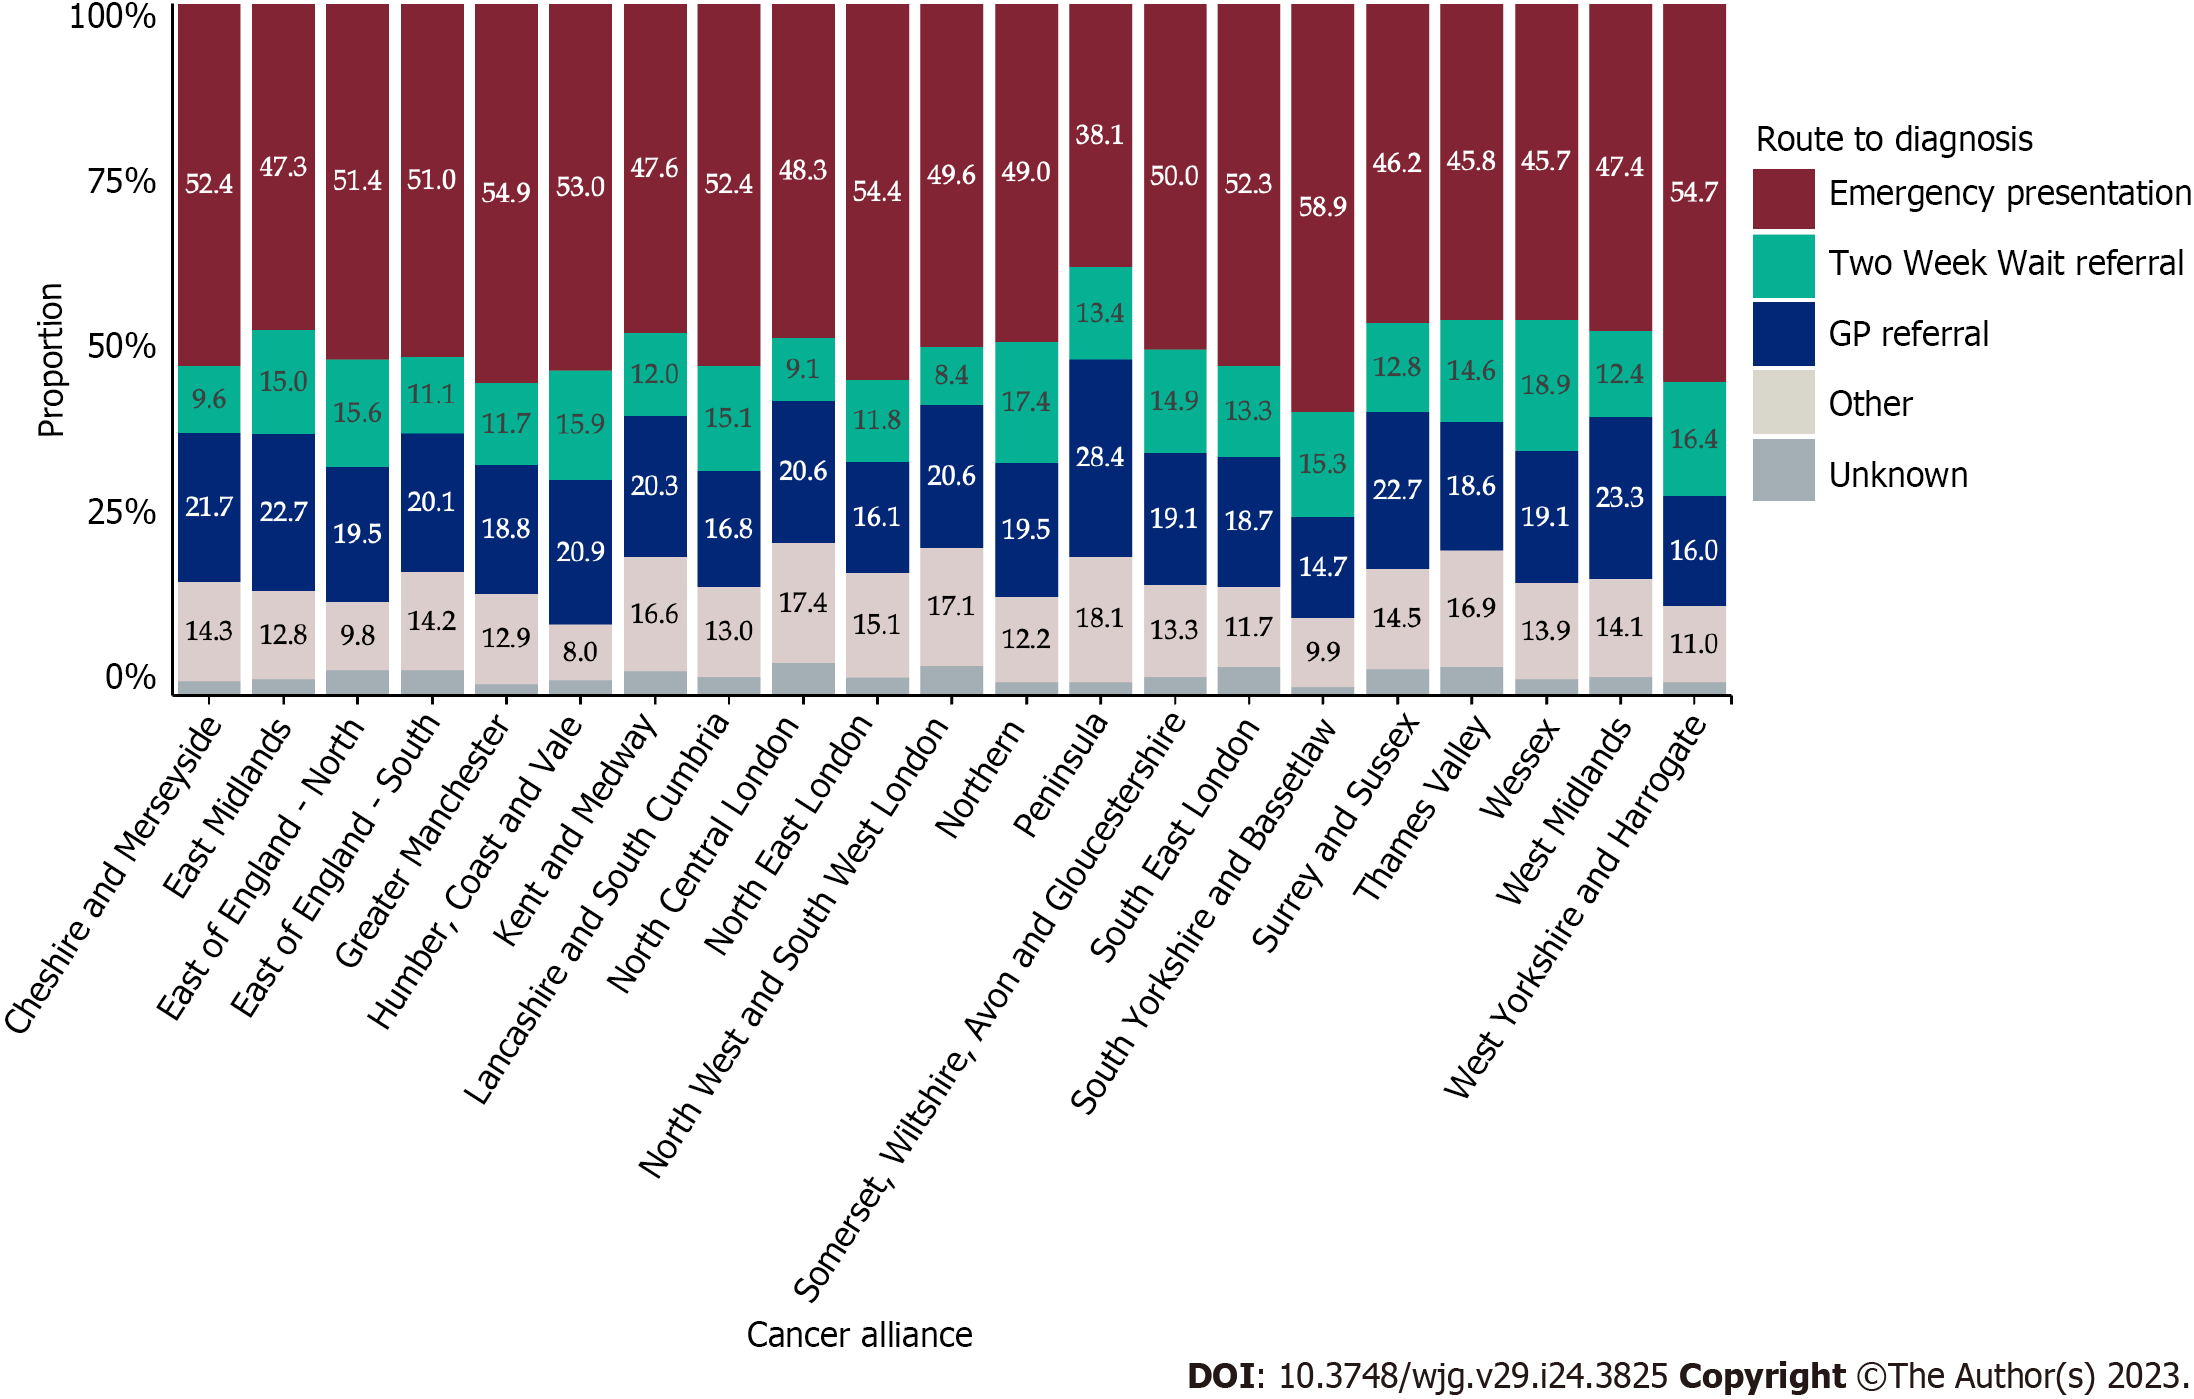
Figure 4 Routes to diagnosis according to Cancer Alliance of residence at diagnosis.
GP: General practitioner.
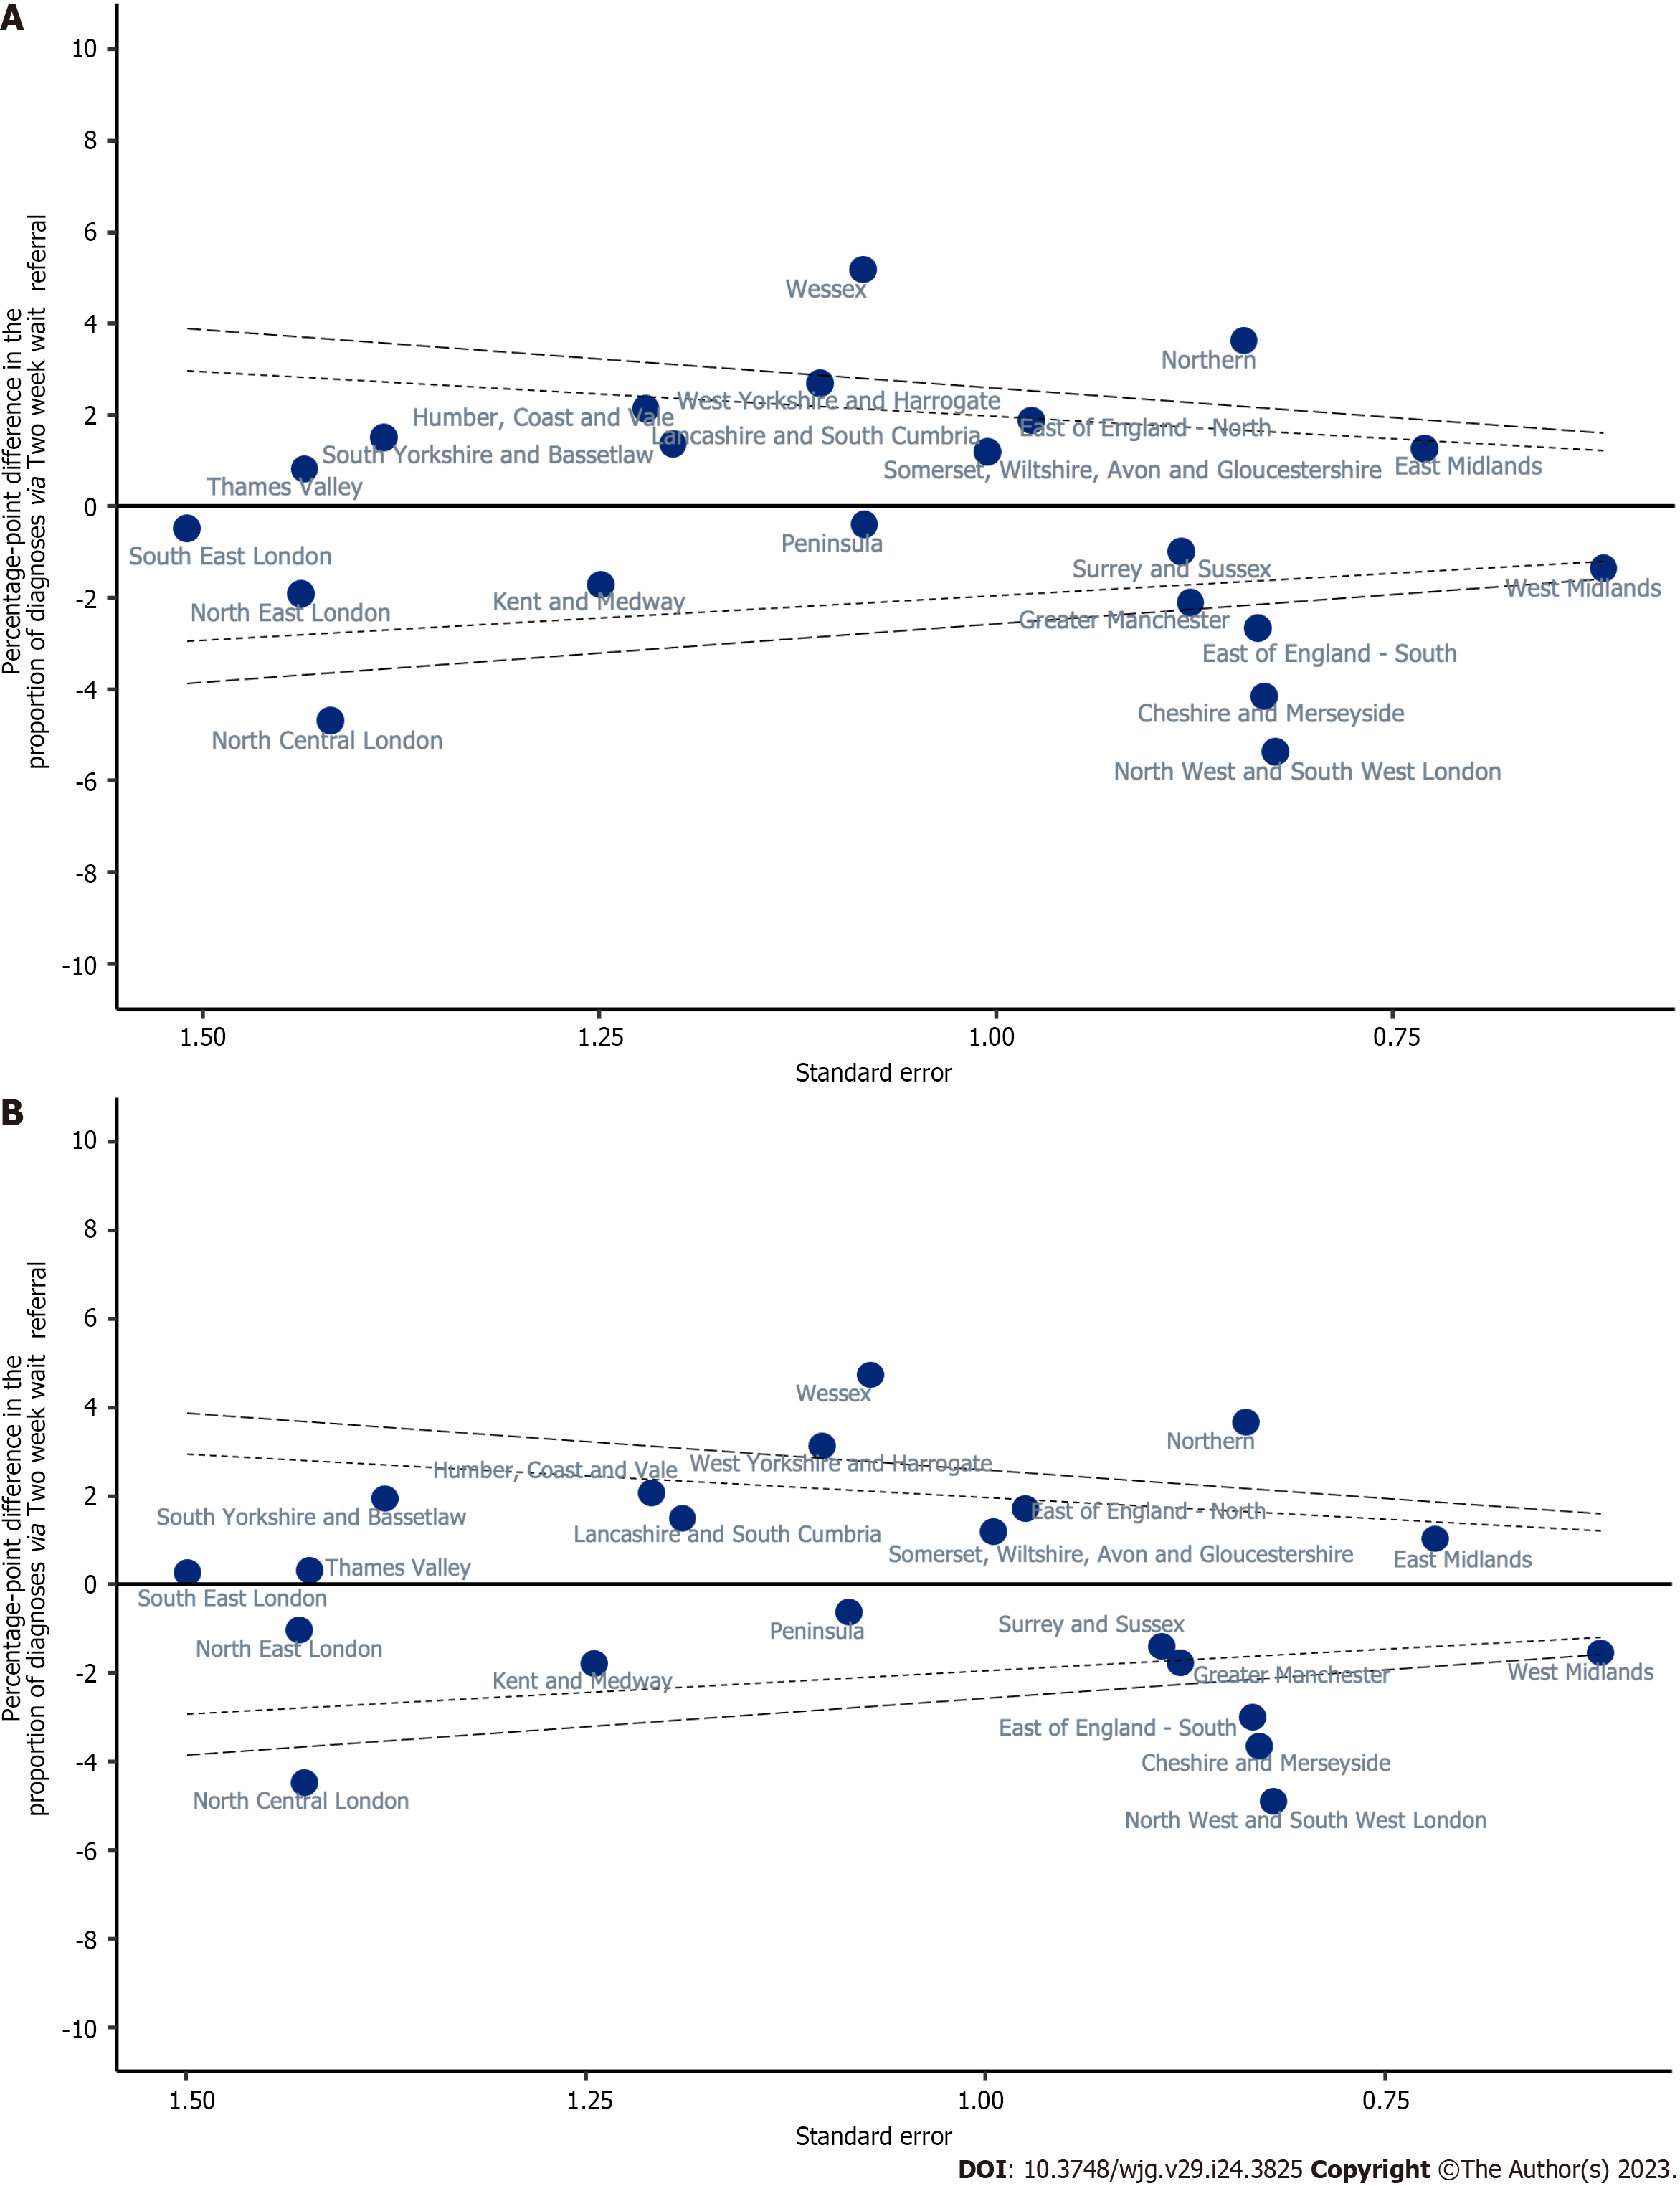
Figure 5 Proportion of people diagnosed via a Two Week Wait referral in each Cancer Alliance: Results from linear probability model.
A: Unadjusted estimates. Inner dashed line = 2 SD difference from average. Outer dashed line = 3 SD difference from average; B: Adjusted estimates. Inner dashed line = 2 SD difference from average. Outer dashed line = 3 SD difference from average. Adjustment for: age, gender, income deprivation quintile, Charlson comorbidity index, underlying liver disease, diagnosis year, tumour morphology and sub-type.
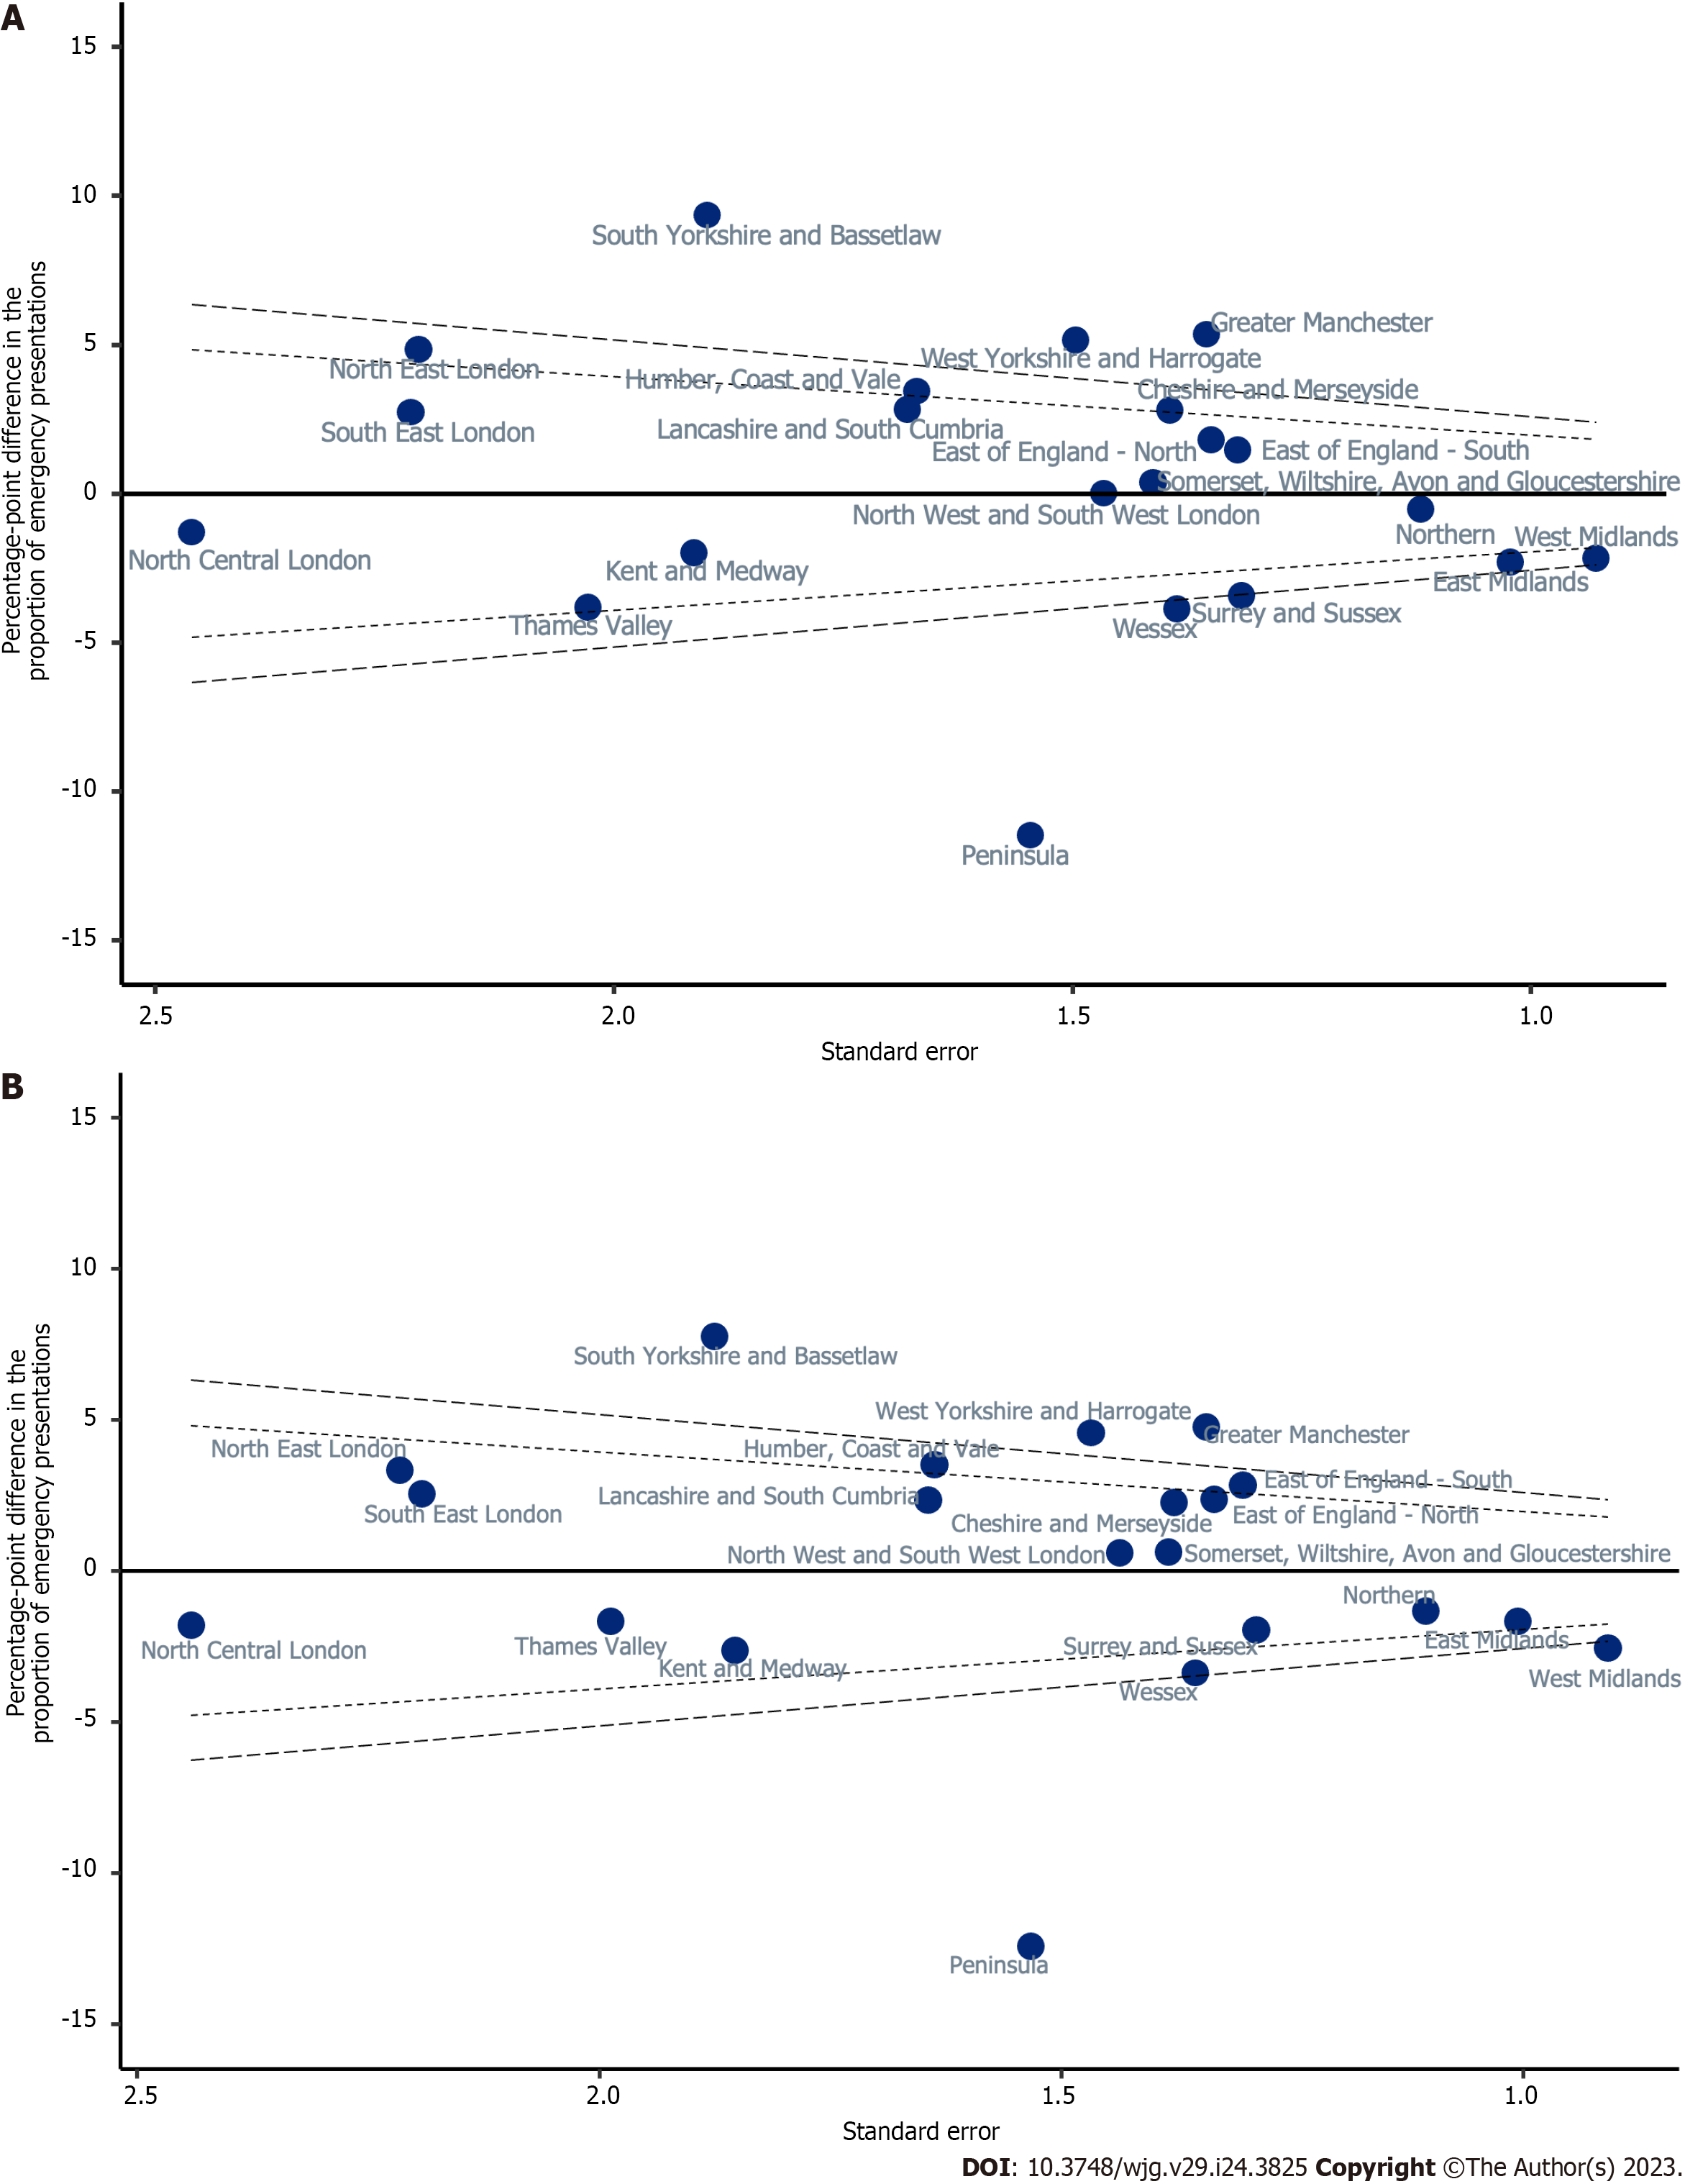
Figure 6 Proportion of people diagnosed via an emergency presentation in each Cancer Alliance: Results from linear probability models.
A: Unadjusted estimates. Inner dashed line = 2 SD difference from average. Outer dashed line = 3 SD difference from average; B: Adjusted estimates. Inner dashed line = 2 SD difference from average. Outer dashed line = 3 SD difference from average. Adjustment for: Age, gender, income deprivation quintile, Charlson comorbidity index, underlying liver disease, diagnosis year, tumour morphology and sub-type.
- Citation: Zalin-Miller A, Jose S, Knott C, Paley L, Tataru D, Morement H, Toledano MB, Khan SA. Regional variation in routes to diagnosis of cholangiocarcinoma in England from 2006 to 2017. World J Gastroenterol 2023; 29(24): 3825-3842
- URL: https://www.wjgnet.com/1007-9327/full/v29/i24/3825.htm
- DOI: https://dx.doi.org/10.3748/wjg.v29.i24.3825


