Copyright
©The Author(s) 2023.
World J Gastroenterol. Jun 28, 2023; 29(24): 3807-3824
Published online Jun 28, 2023. doi: 10.3748/wjg.v29.i24.3807
Published online Jun 28, 2023. doi: 10.3748/wjg.v29.i24.3807
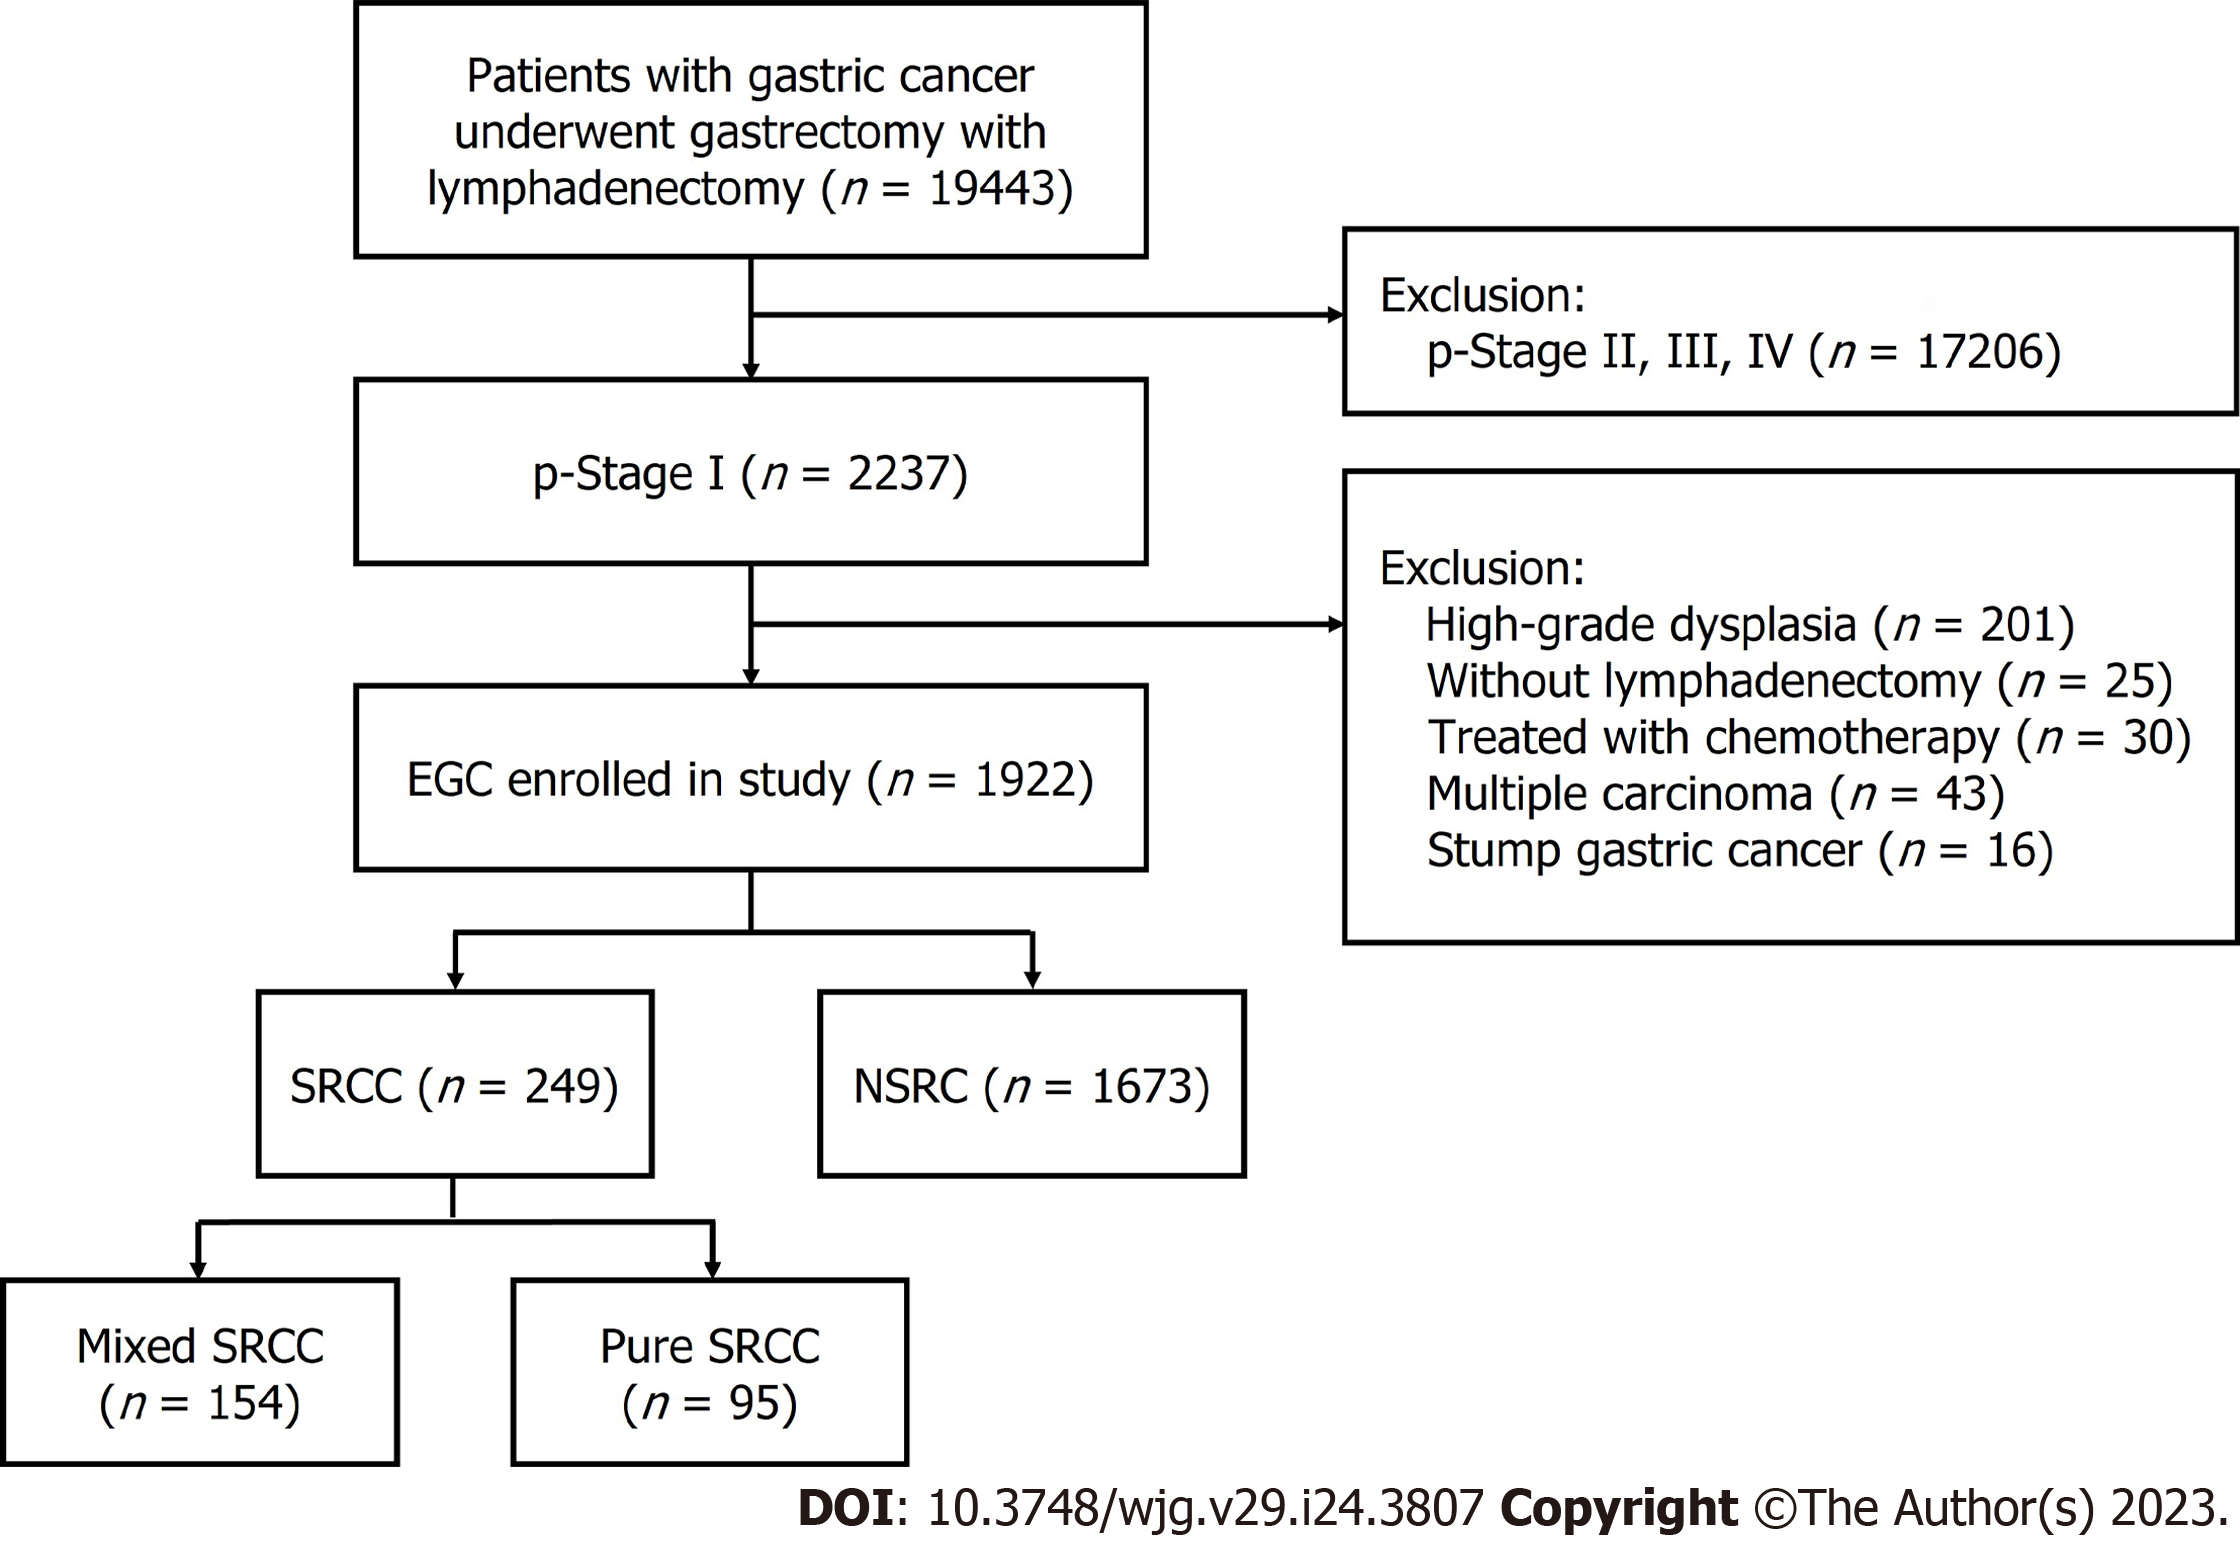
Figure 1 Flow diagram showing the study design and population.
EGC: Early gastric cancer; SRCC: Signet ring cell carcinoma; NSRC: Non-signet ring cell carcinoma.
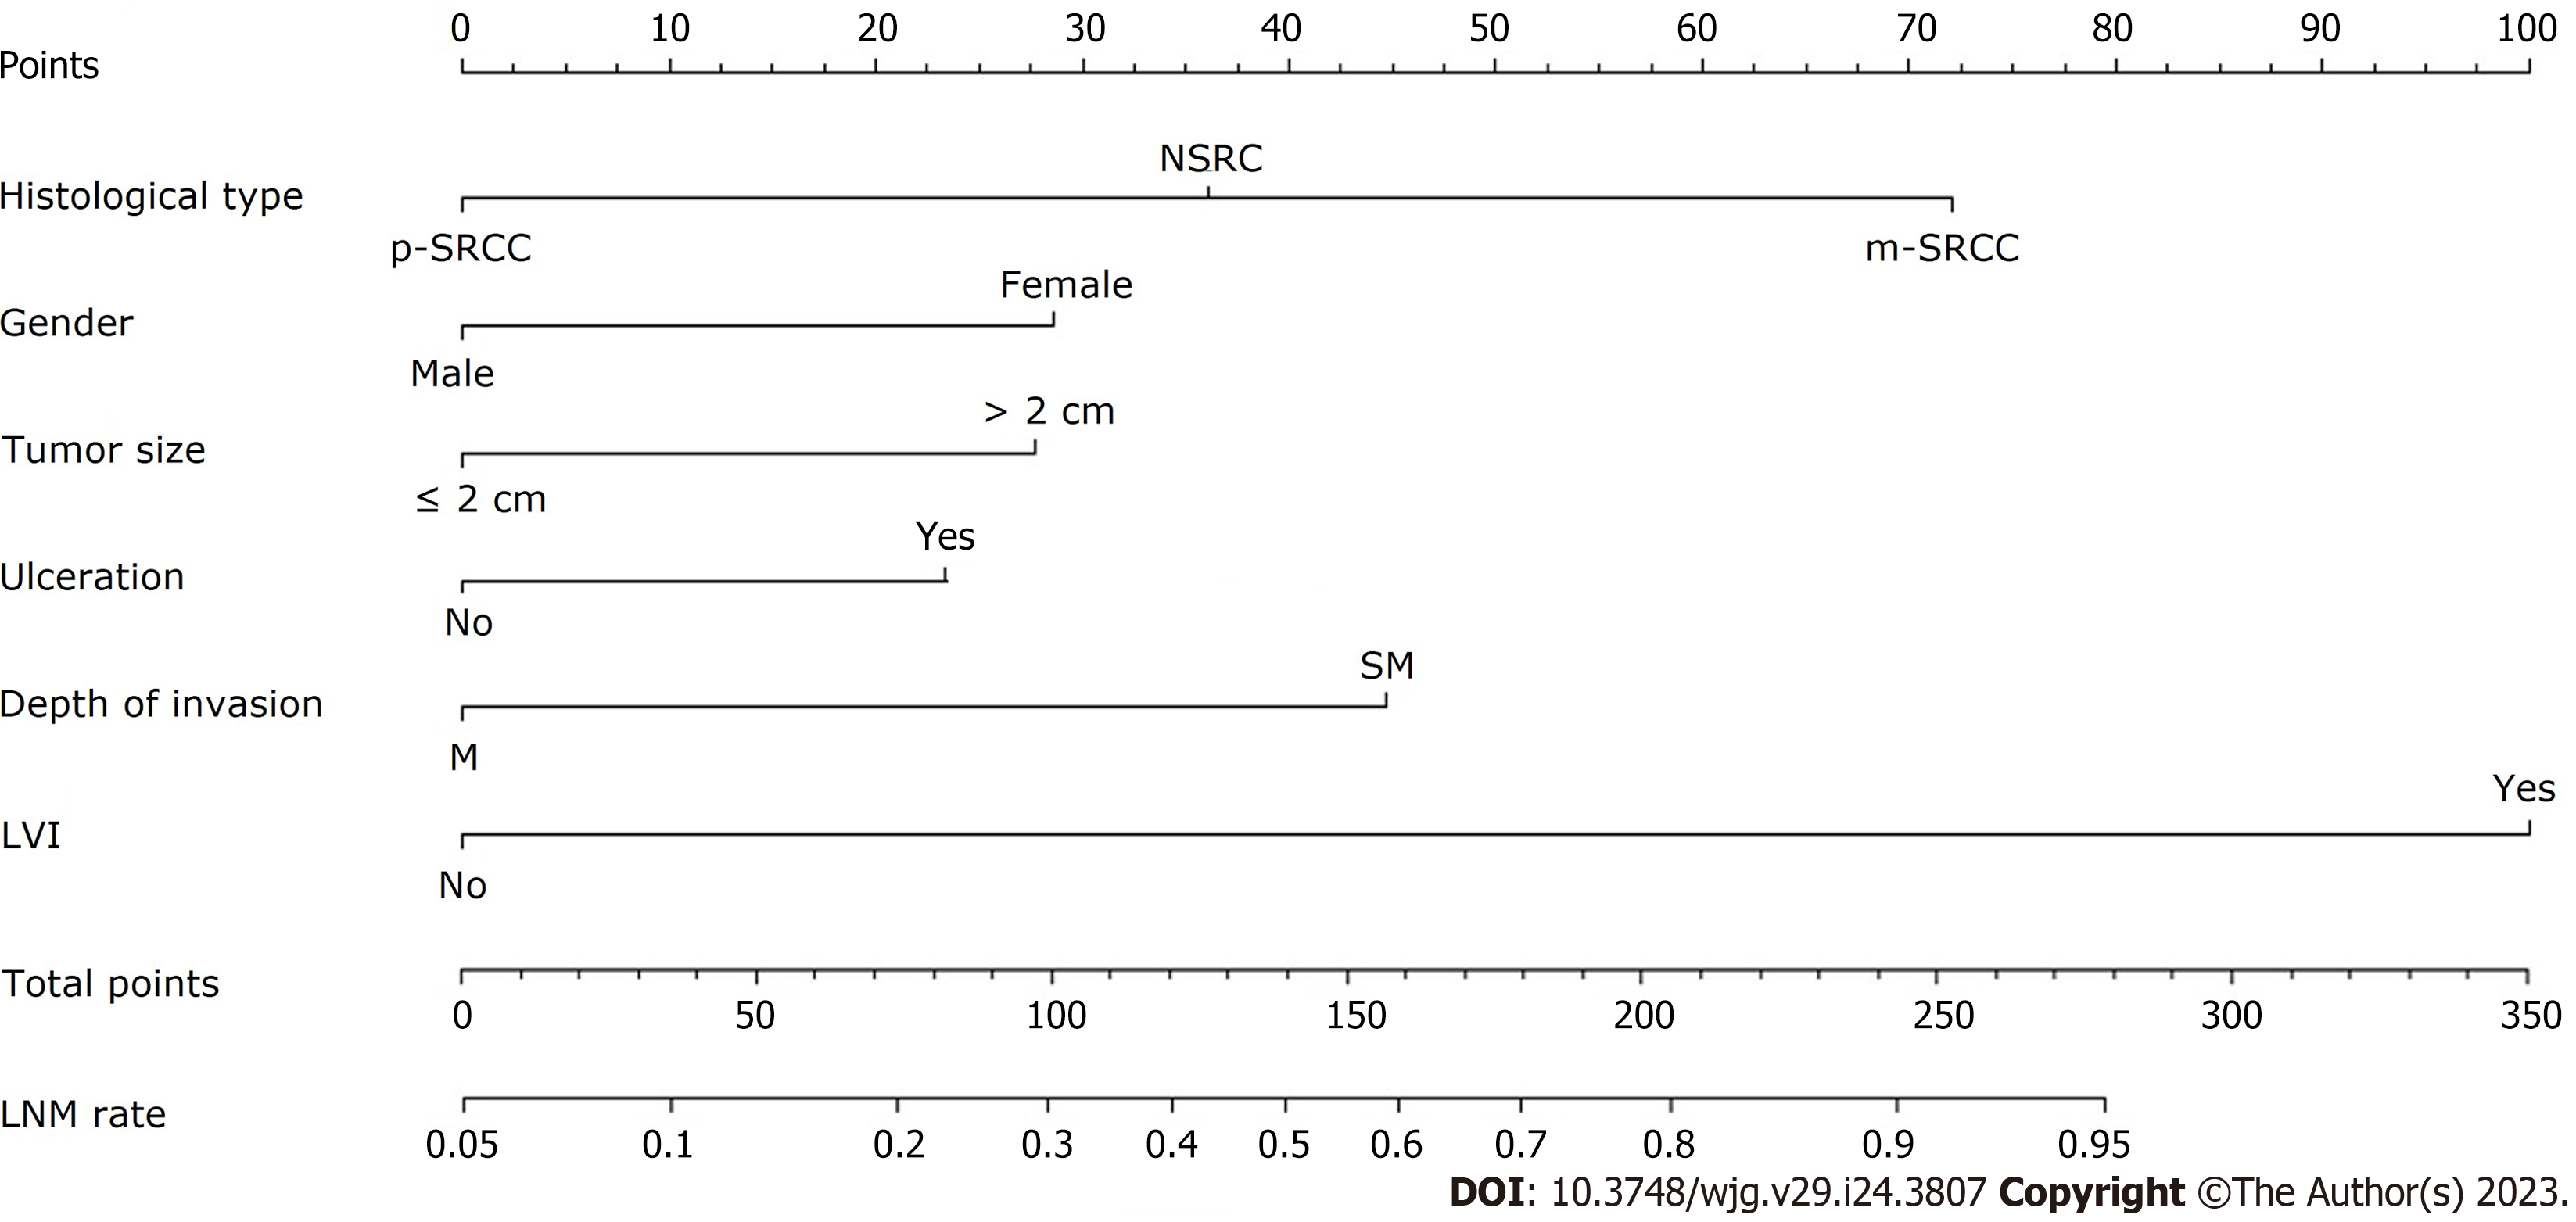
Figure 2 Nomogram for predicting lymph node metastasis in early gastric cancer patients.
The factors of histological type, gender, tumor size, ulceration, depth of invasion and lymphovascular invasion were included in the model. p-SRCC: Pure signet-ring cell carcinoma; NSRC: Non-signet ring cell carcinoma; m-SRCC: Mixed signet-ring cell carcinoma; M: Mucosal; SM: Submucosal; LVI: Lymphovascular invasion; LNM: Lymph node metastasis.
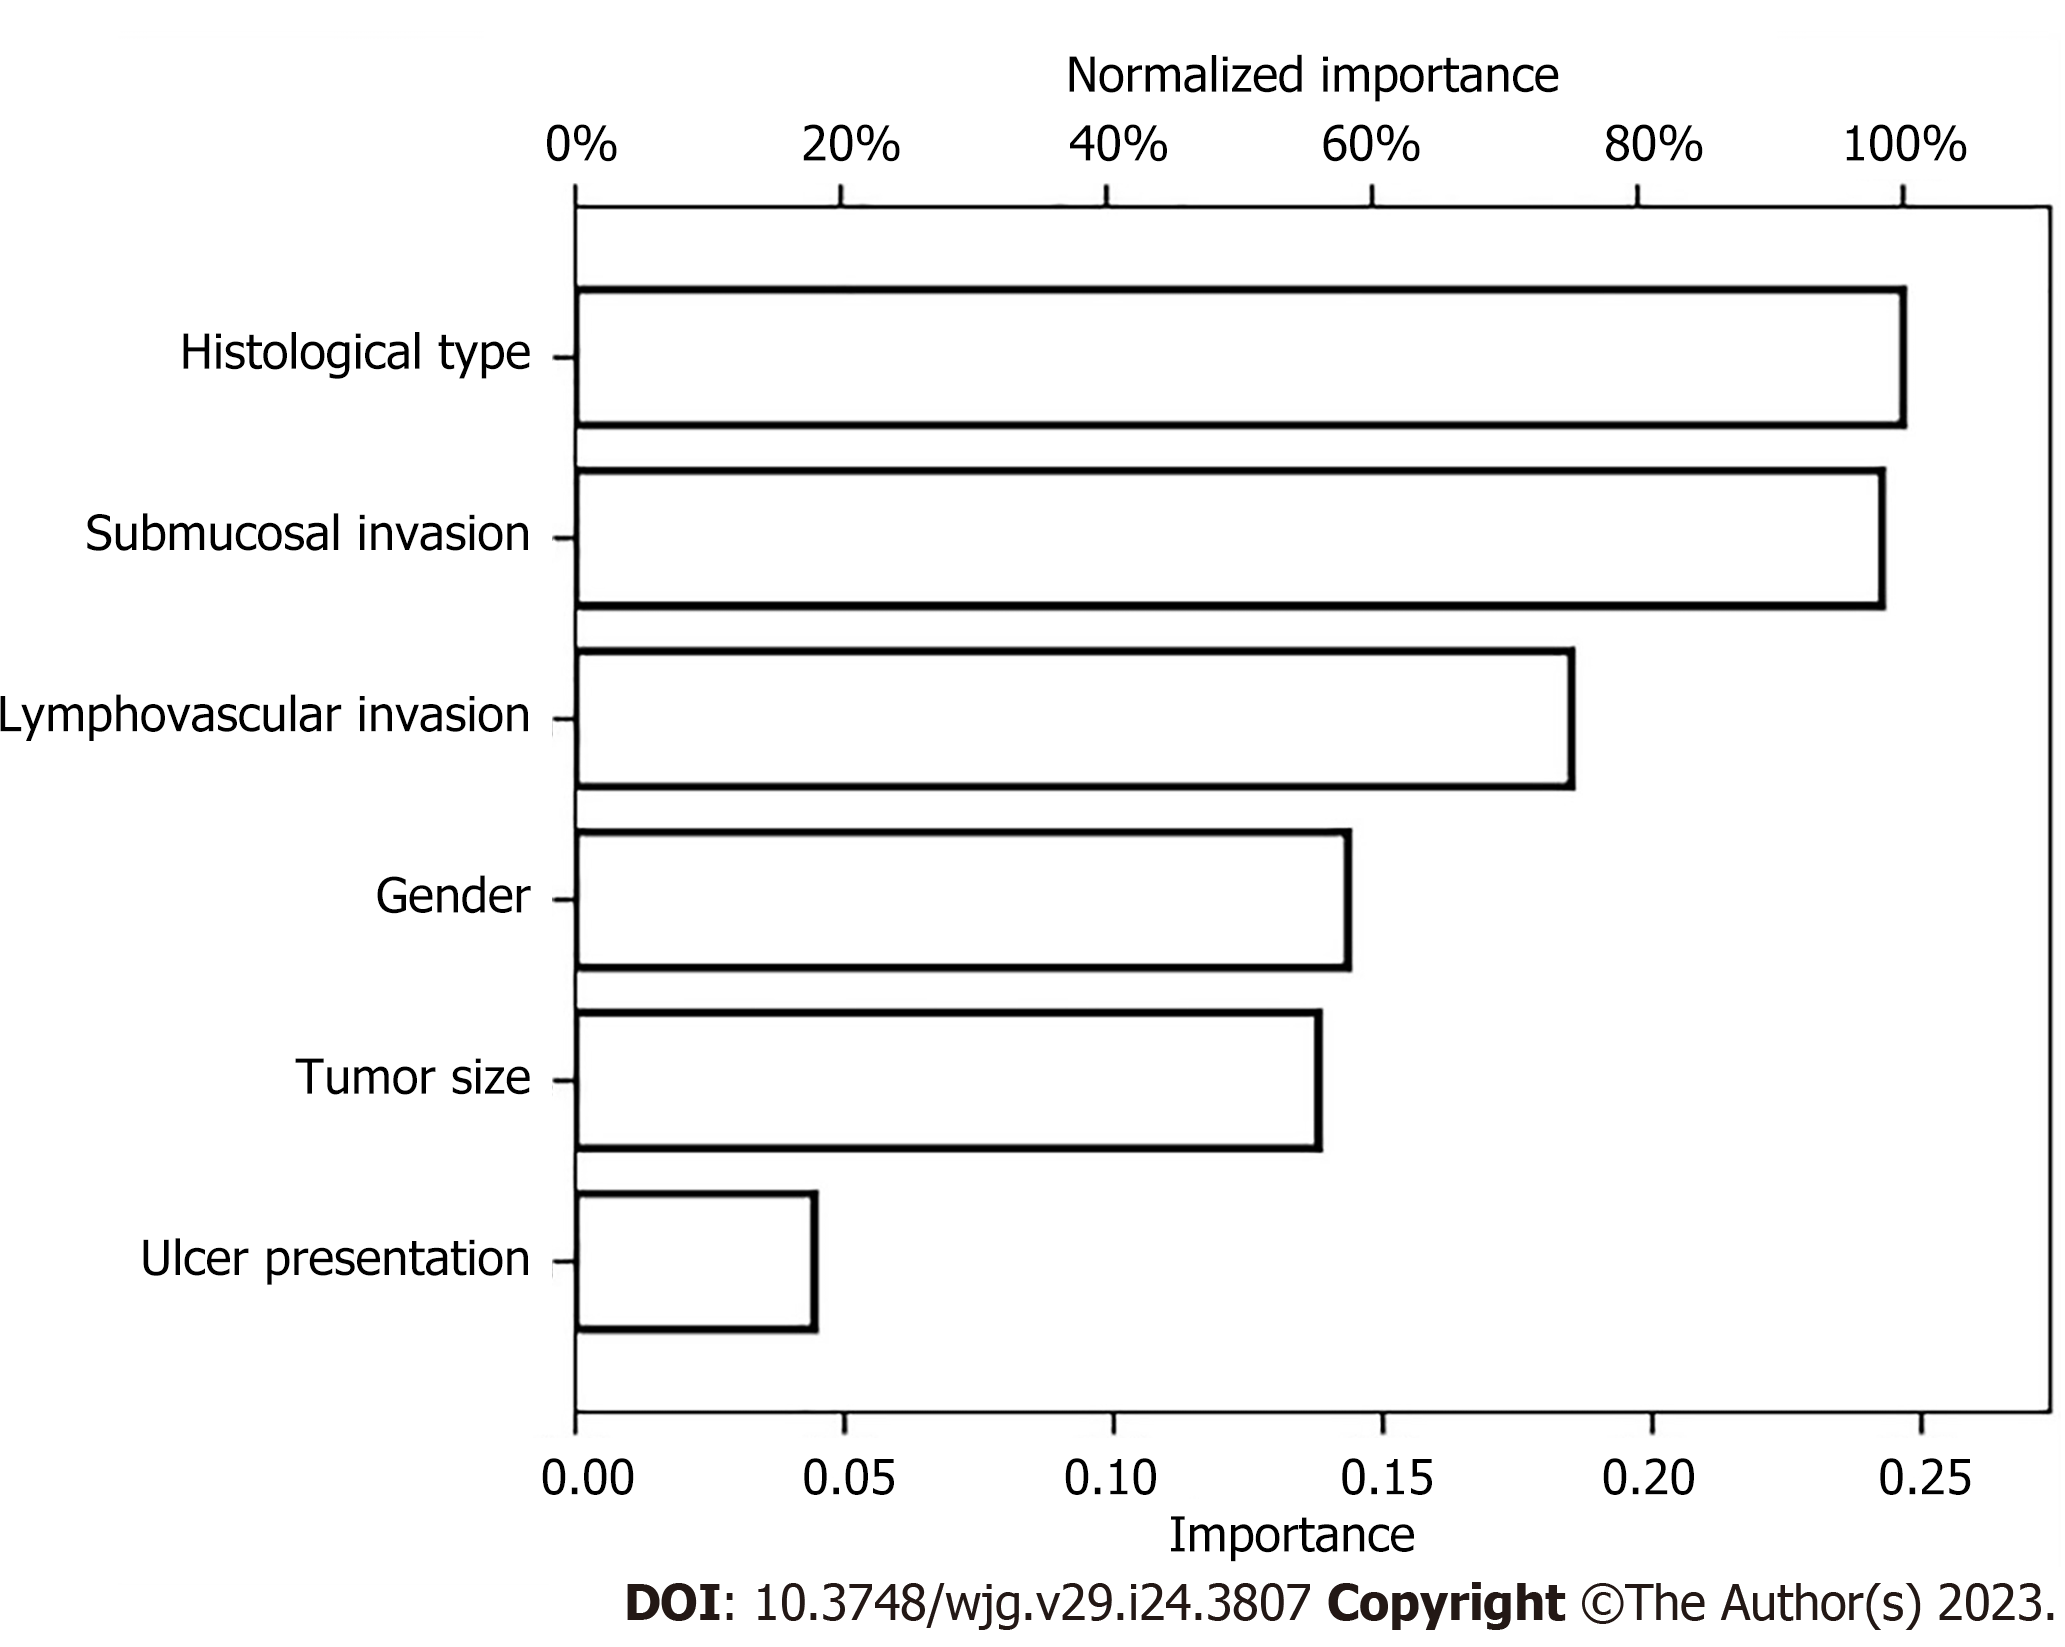
Figure 3 Artificial neural network model for predicting lymph node metastasis in early gastric cancer patients.
This model consists of six parameters: histological type, submucosal invasion, lymphovascular invasion, gender, tumor size and ulcer presentation.
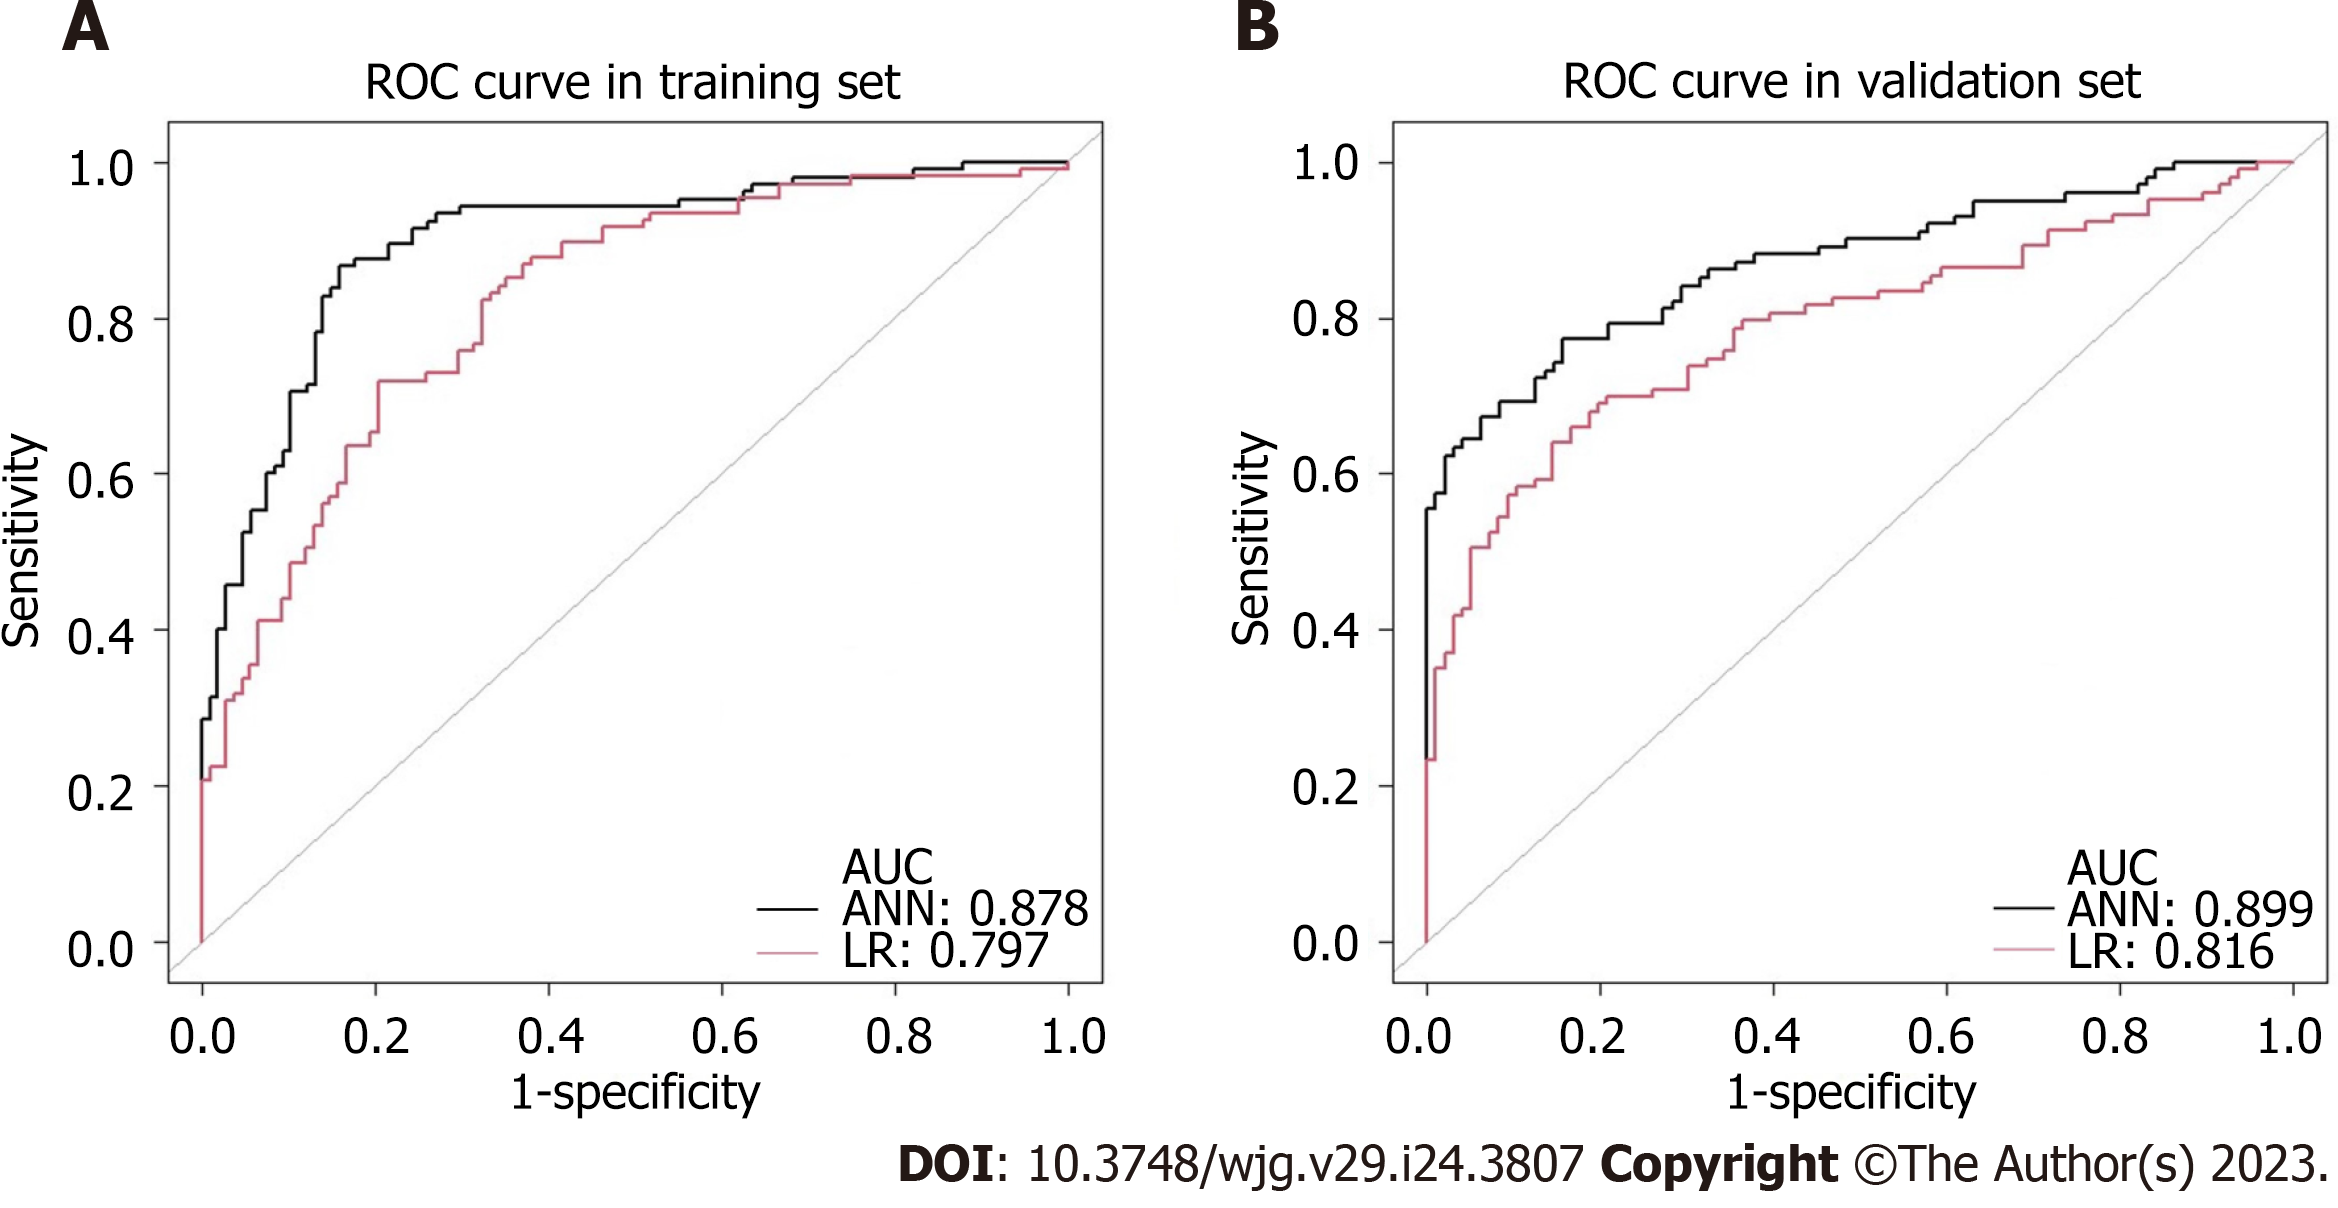
Figure 4 Receiver-operating characteristic curves of the established models for predicting lymph node metastasis in early gastric cancer.
The black and the red curve represent the development data of the artificial neural network and logistic regression model, respectively. A: Comparison of receiver-operating characteristic (ROC) plot in the training set, the area under the curve (AUC) was 0.878 vs 0.797, P < 0.001; B: Comparison of ROC plot in the validation set, the AUC was 0.899 vs 0.816, P < 0.001. ROC: Receiver-operating characteristic; AUC: Area under the curve; ANN: Artificial neural network; LR: Logistic regression.
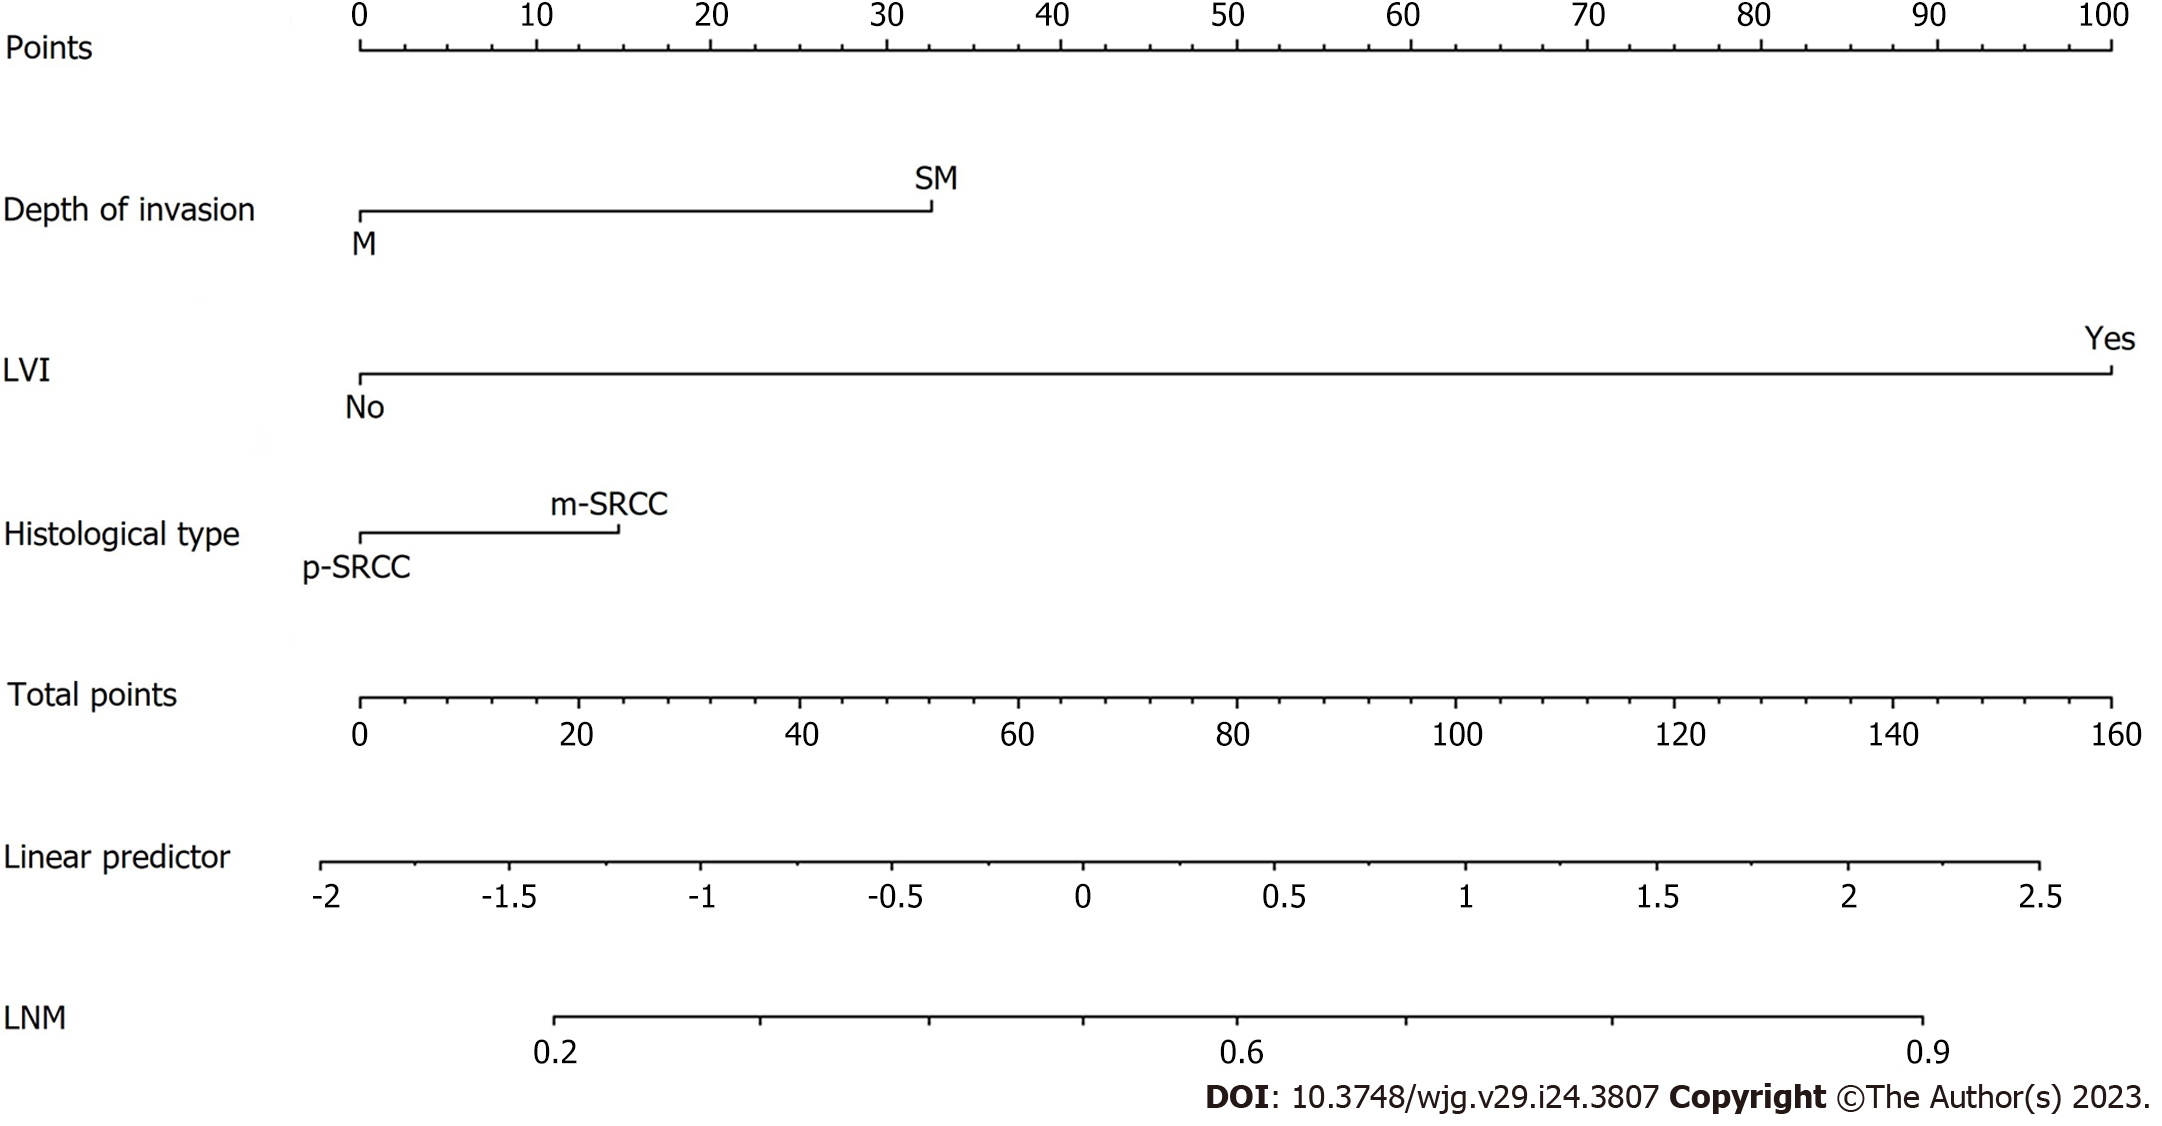
Figure 5 Nomogram for predicting lymph node metastasis in early signet-ring cell carcinoma patients.
The factors of histological type, depth of invasion and lymphovascular invasion were included in the model. M: Mucosal; SM: Submucosal; LVI: Lymphovascular invasion; p-SRCC: Pure signet-ring cell carcinoma; m-SRCC: Mixed signet-ring cell carcinoma; LNM: Lymph node metastasis.
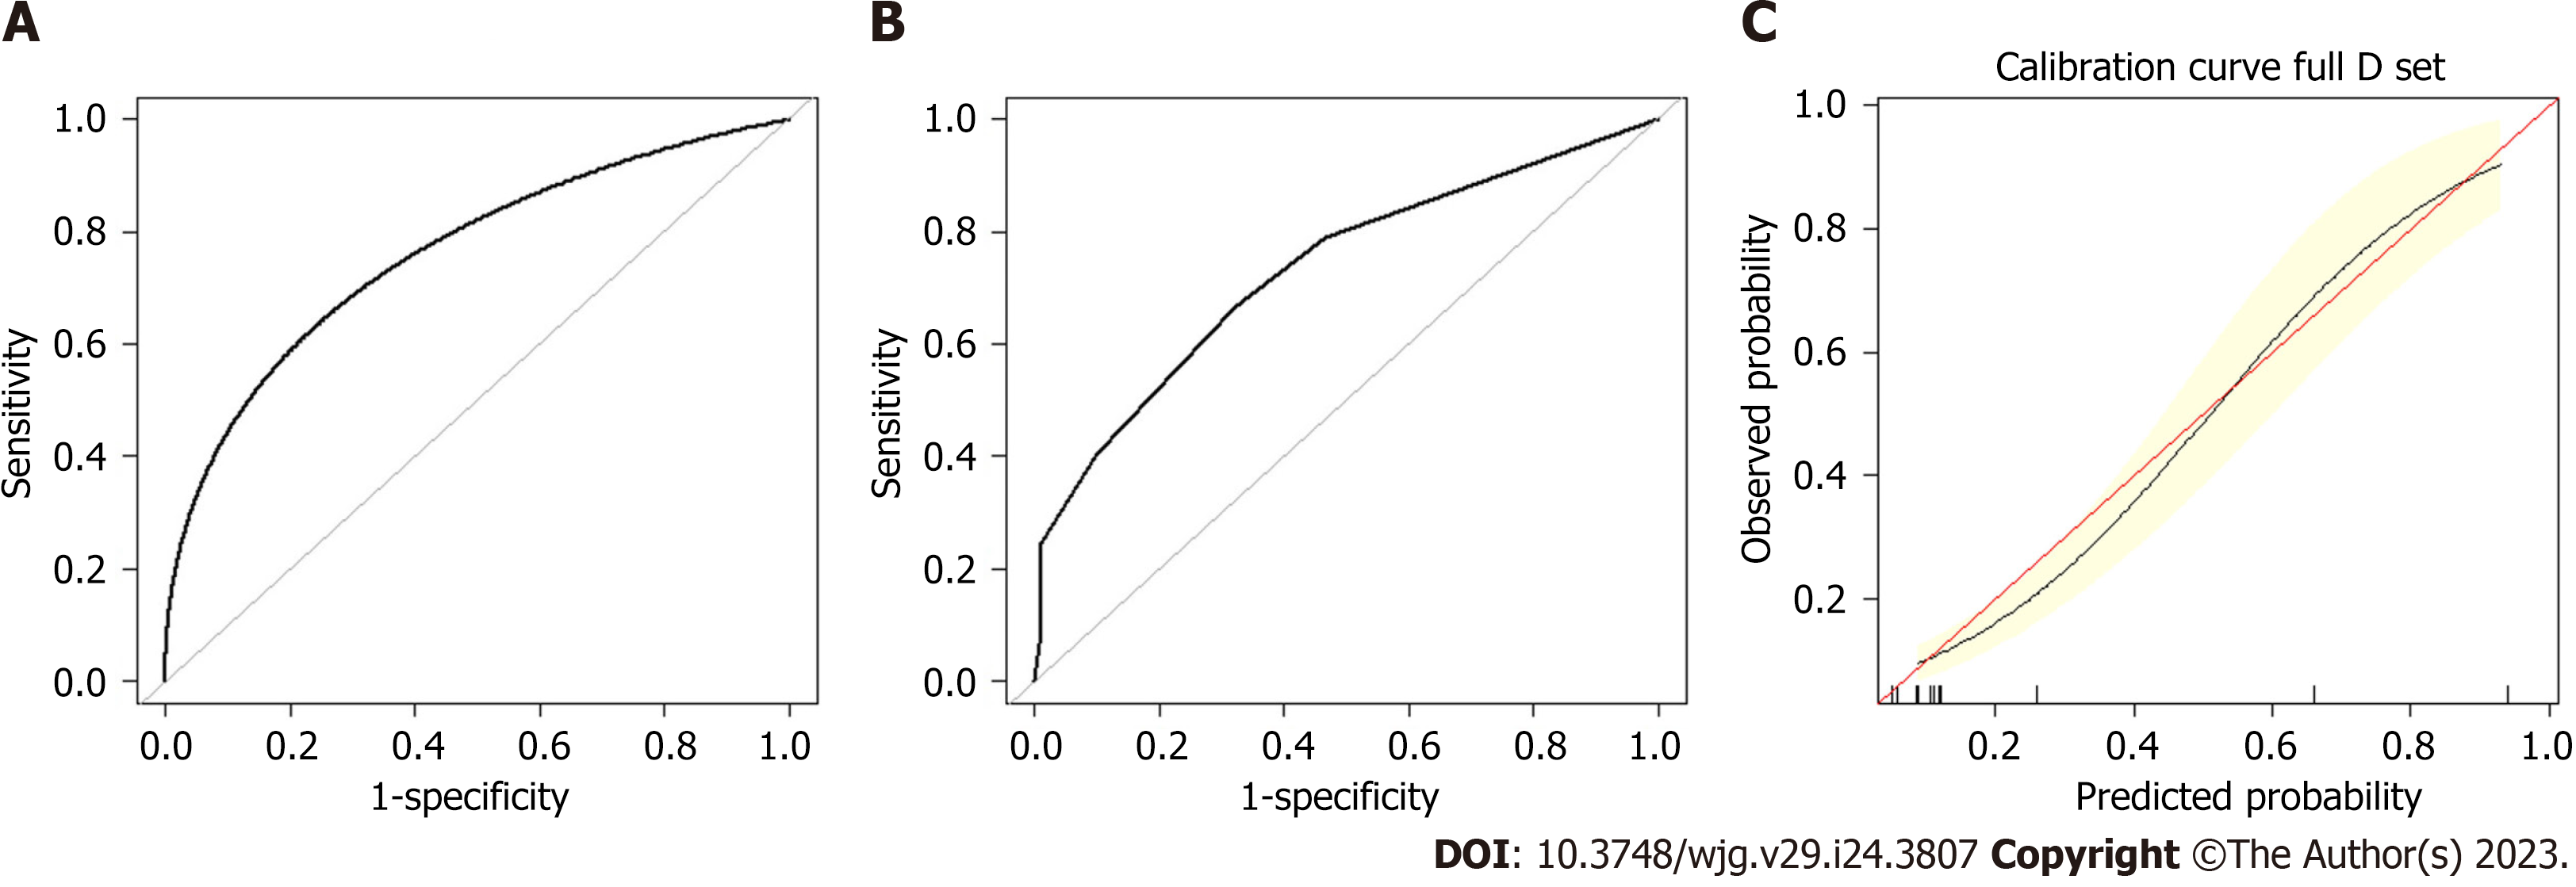
Figure 6 Assessment of the nomogram for predicting lymph node metastasis in the training set and validation set.
A: Receiver-operating characteristic receiver-operating characteristic (ROC) plot in the training set. The area under the curve (AUC) of the ROC was 0.760 (95%CI: 0.682-0.843); B: ROC plot in the validation set. The AUC of the ROC was 0.734 (95%CI: 0.643-0.826); C: Calibration plot in the training set. After 2000 repetitions, the bootstrap-corrected calibration curve (black line) lay close to the ideal reference line (red line), which demonstrated a perfect agreement between the predicted and actual outcomes (mean absolute error 0.012).
- Citation: Yang JJ, Wang XY, Ma R, Chen MH, Zhang GX, Li X. Prediction of lymph node metastasis in early gastric signet-ring cell carcinoma: A real-world retrospective cohort study. World J Gastroenterol 2023; 29(24): 3807-3824
- URL: https://www.wjgnet.com/1007-9327/full/v29/i24/3807.htm
- DOI: https://dx.doi.org/10.3748/wjg.v29.i24.3807


