Copyright
©The Author(s) 2023.
World J Gastroenterol. Jun 21, 2023; 29(23): 3645-3657
Published online Jun 21, 2023. doi: 10.3748/wjg.v29.i23.3645
Published online Jun 21, 2023. doi: 10.3748/wjg.v29.i23.3645
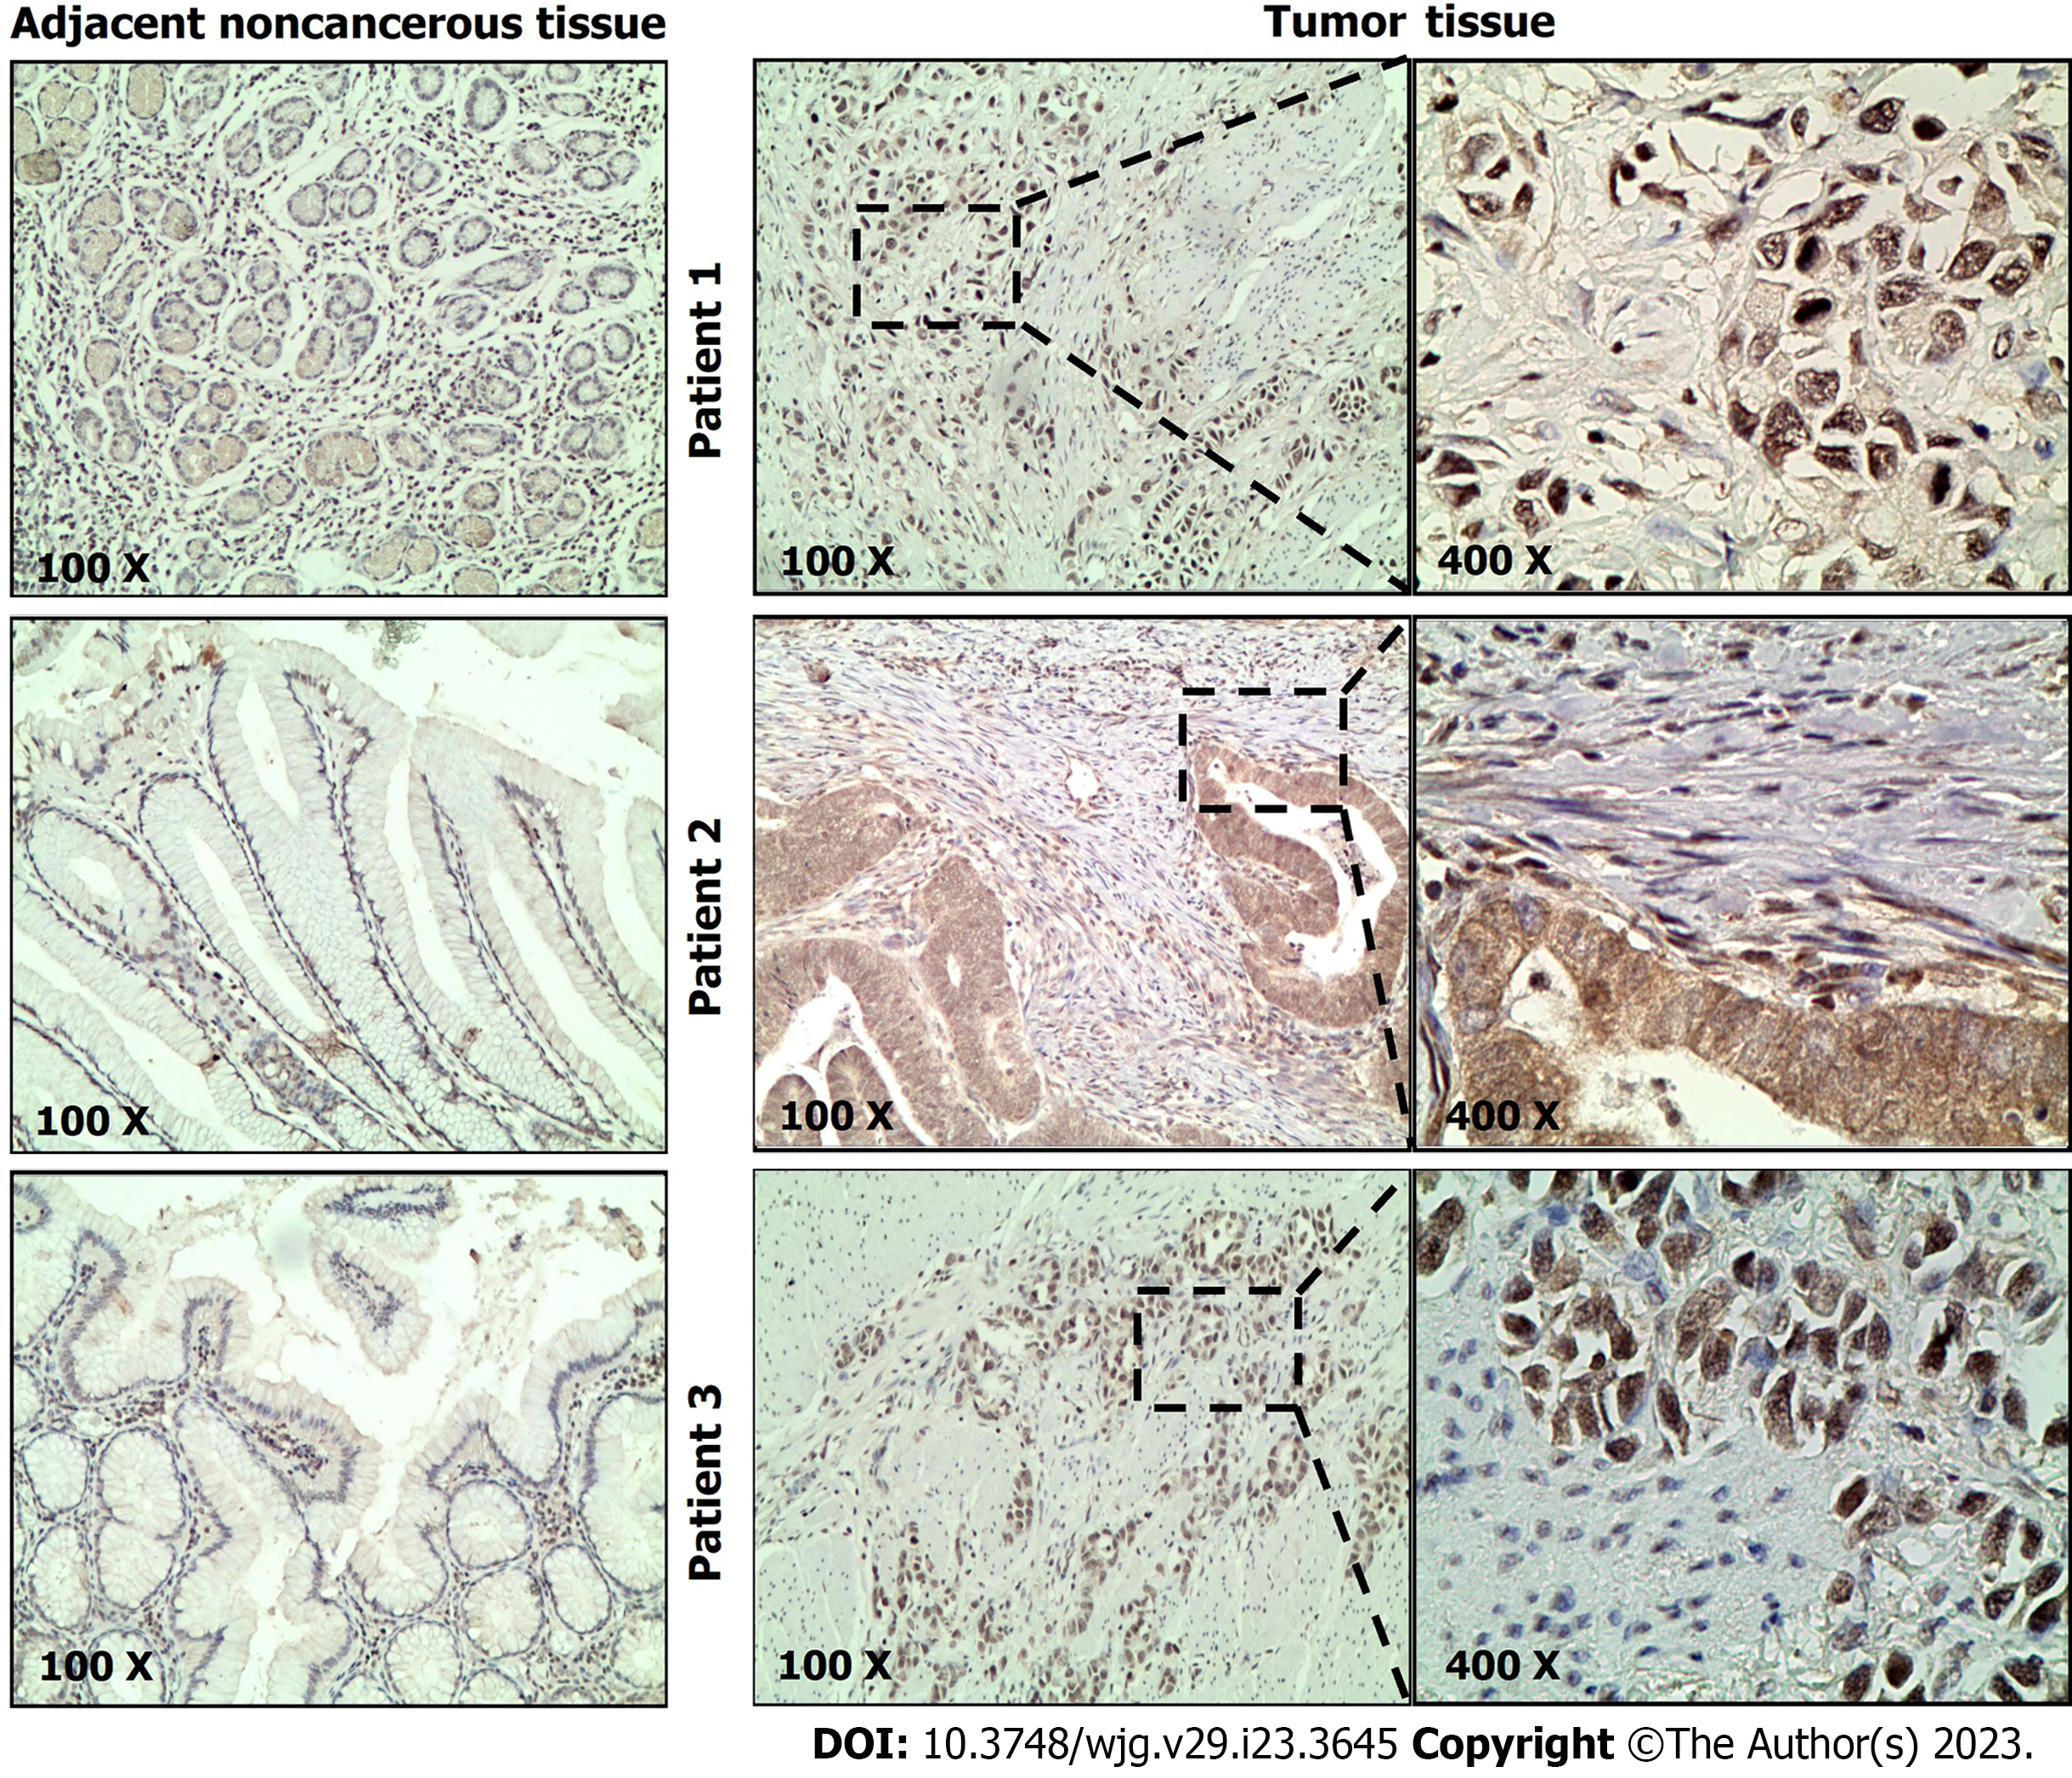
Figure 1 Expression of NPAS2 in gastric cancer.
The expression of NPAS2 in tumor tissues of gastric cancer was detected by immunohistochemical staining and compared with adjacent normal tissues. High expression of NPAS2 in gastric cancer and low expression in adjacent non-cancerous tissue.
Figure 2 Kaplan–Meier curves for NPAS2 expression in gastric cancer.
Gastric cancer patients with high NPAS2 expression were significantly associated with shorter overall survival.
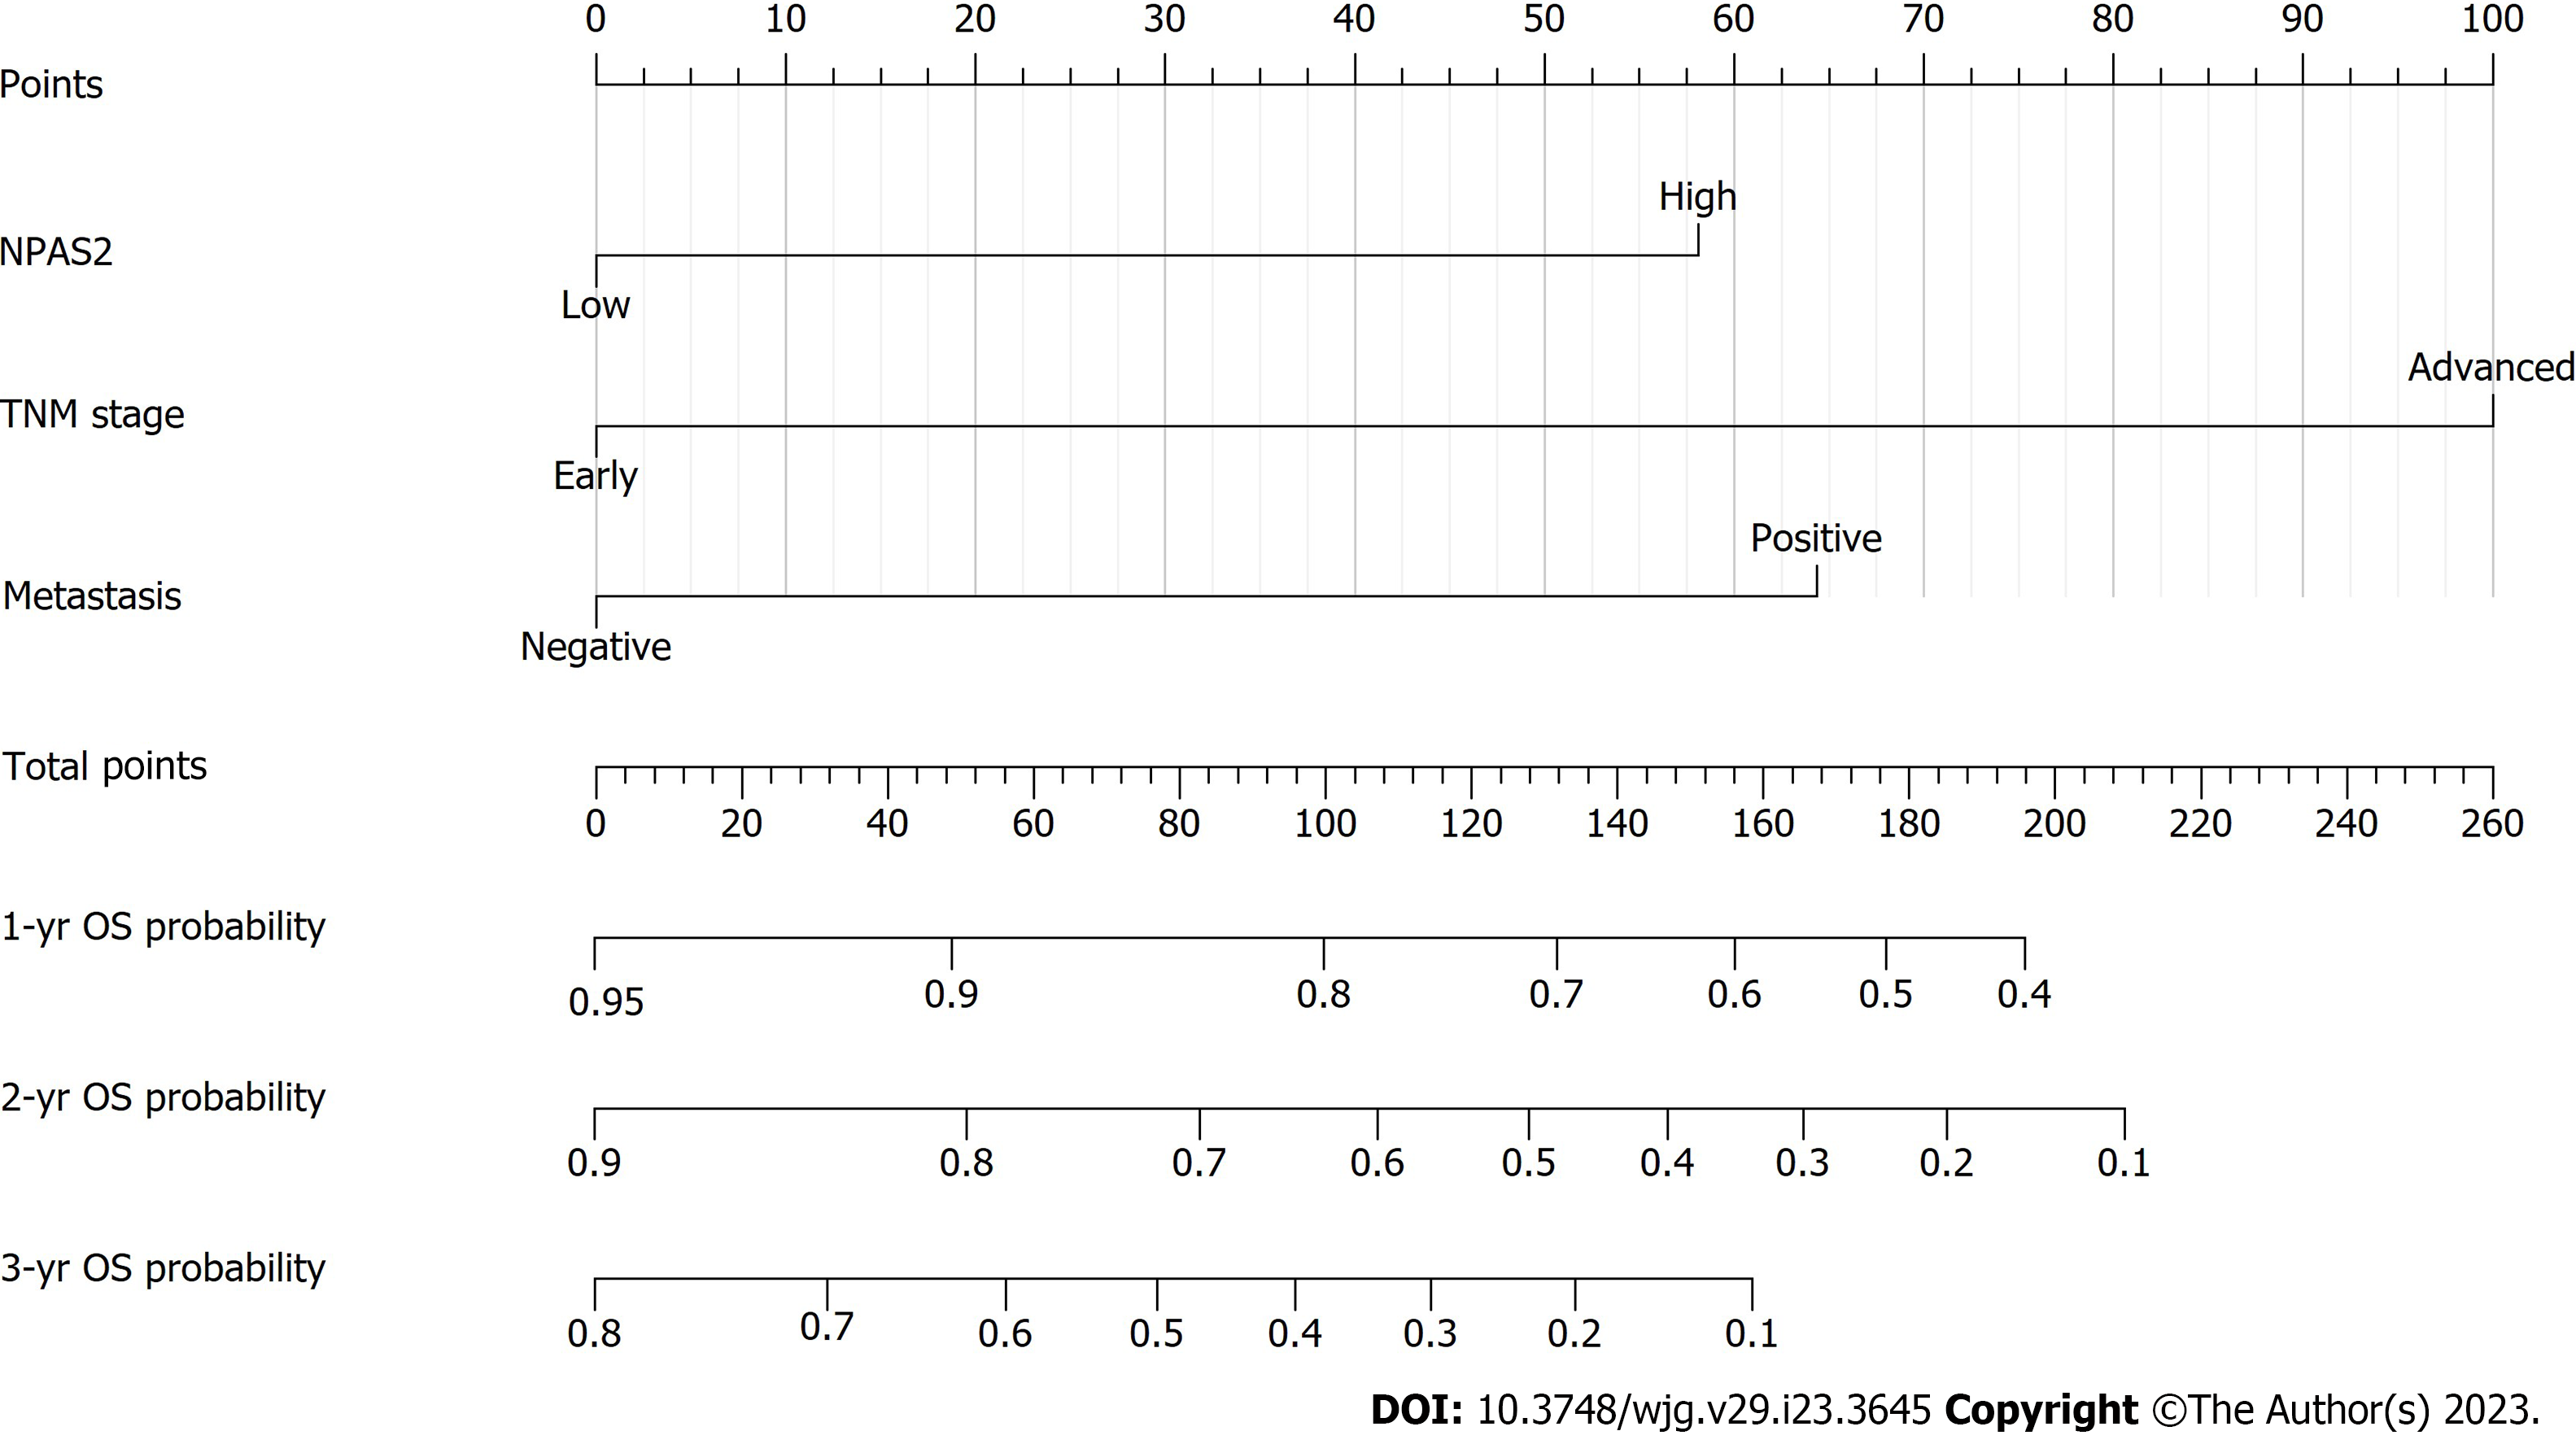
Figure 3 Nomogram prediction of 1-, 2-and 3-year overall survival rate in patients with gastric cancer.
The total points is calculated by adding up the points of each factor. The total points corresponds to the 1-year, 2-year and 3-year survival probability of the patients. OS: Overall survival; TNM: Tumor-node-metastasis.
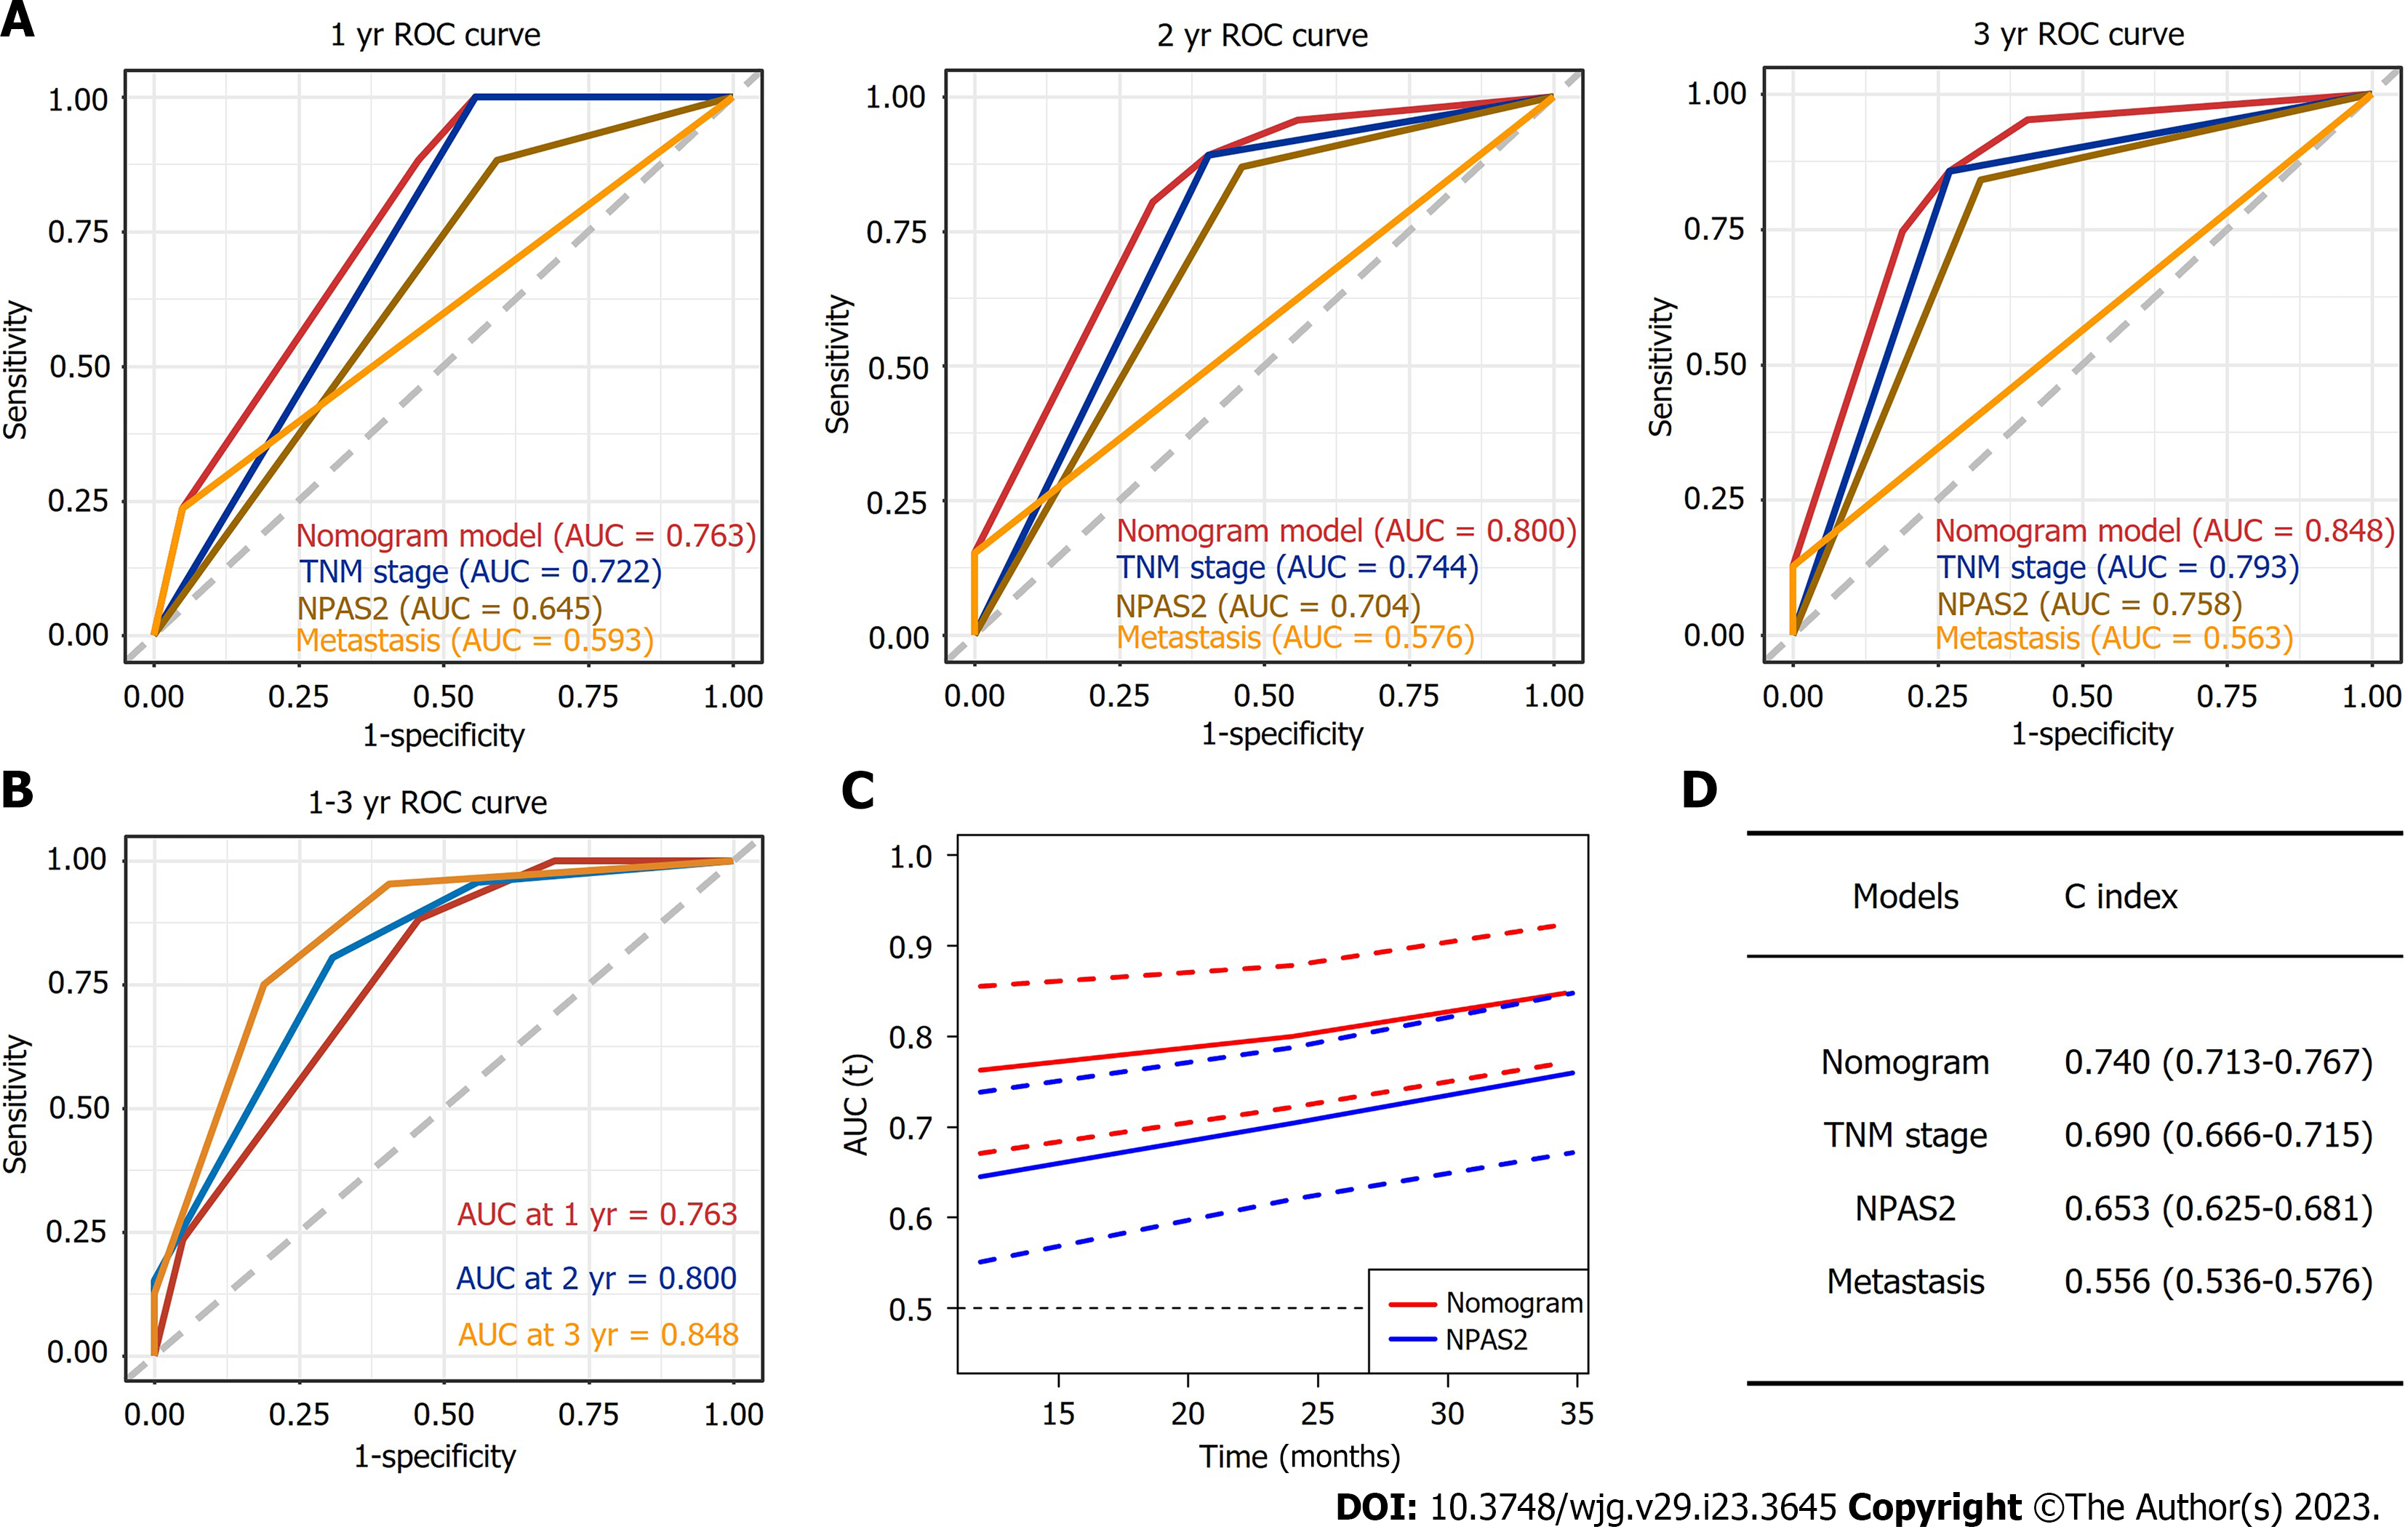
Figure 4 Construction of prognostic nomogram in gastric cancer.
A: NPAS2, tumor-node-metastasis (TNM) stage, metastasis, and nomogram predict the receiver operating characteristic (ROC) curves of 1-year, 2-year and 3-year overall survival (OS) in gastric cancer patients; B: Nomogram predict the ROC curve of 1-year, 2-year and 3-year OS in gastric cancer patients; C: Comparison of time-dependent ROC curves between nomogram and NPAS2; D: C-index for nomogram, NPAS2, TNM stage, metastasis. ROC: Receiver operating characteristic; OS: Overall survival; TNM: Tumor-node-metastasis; AUC: Area under the curve.
Figure 5 Nomogram calibration plots to predict 1-, 2-, and 3-year overall survival in gastric cancer patients.
OS: Overall survival.
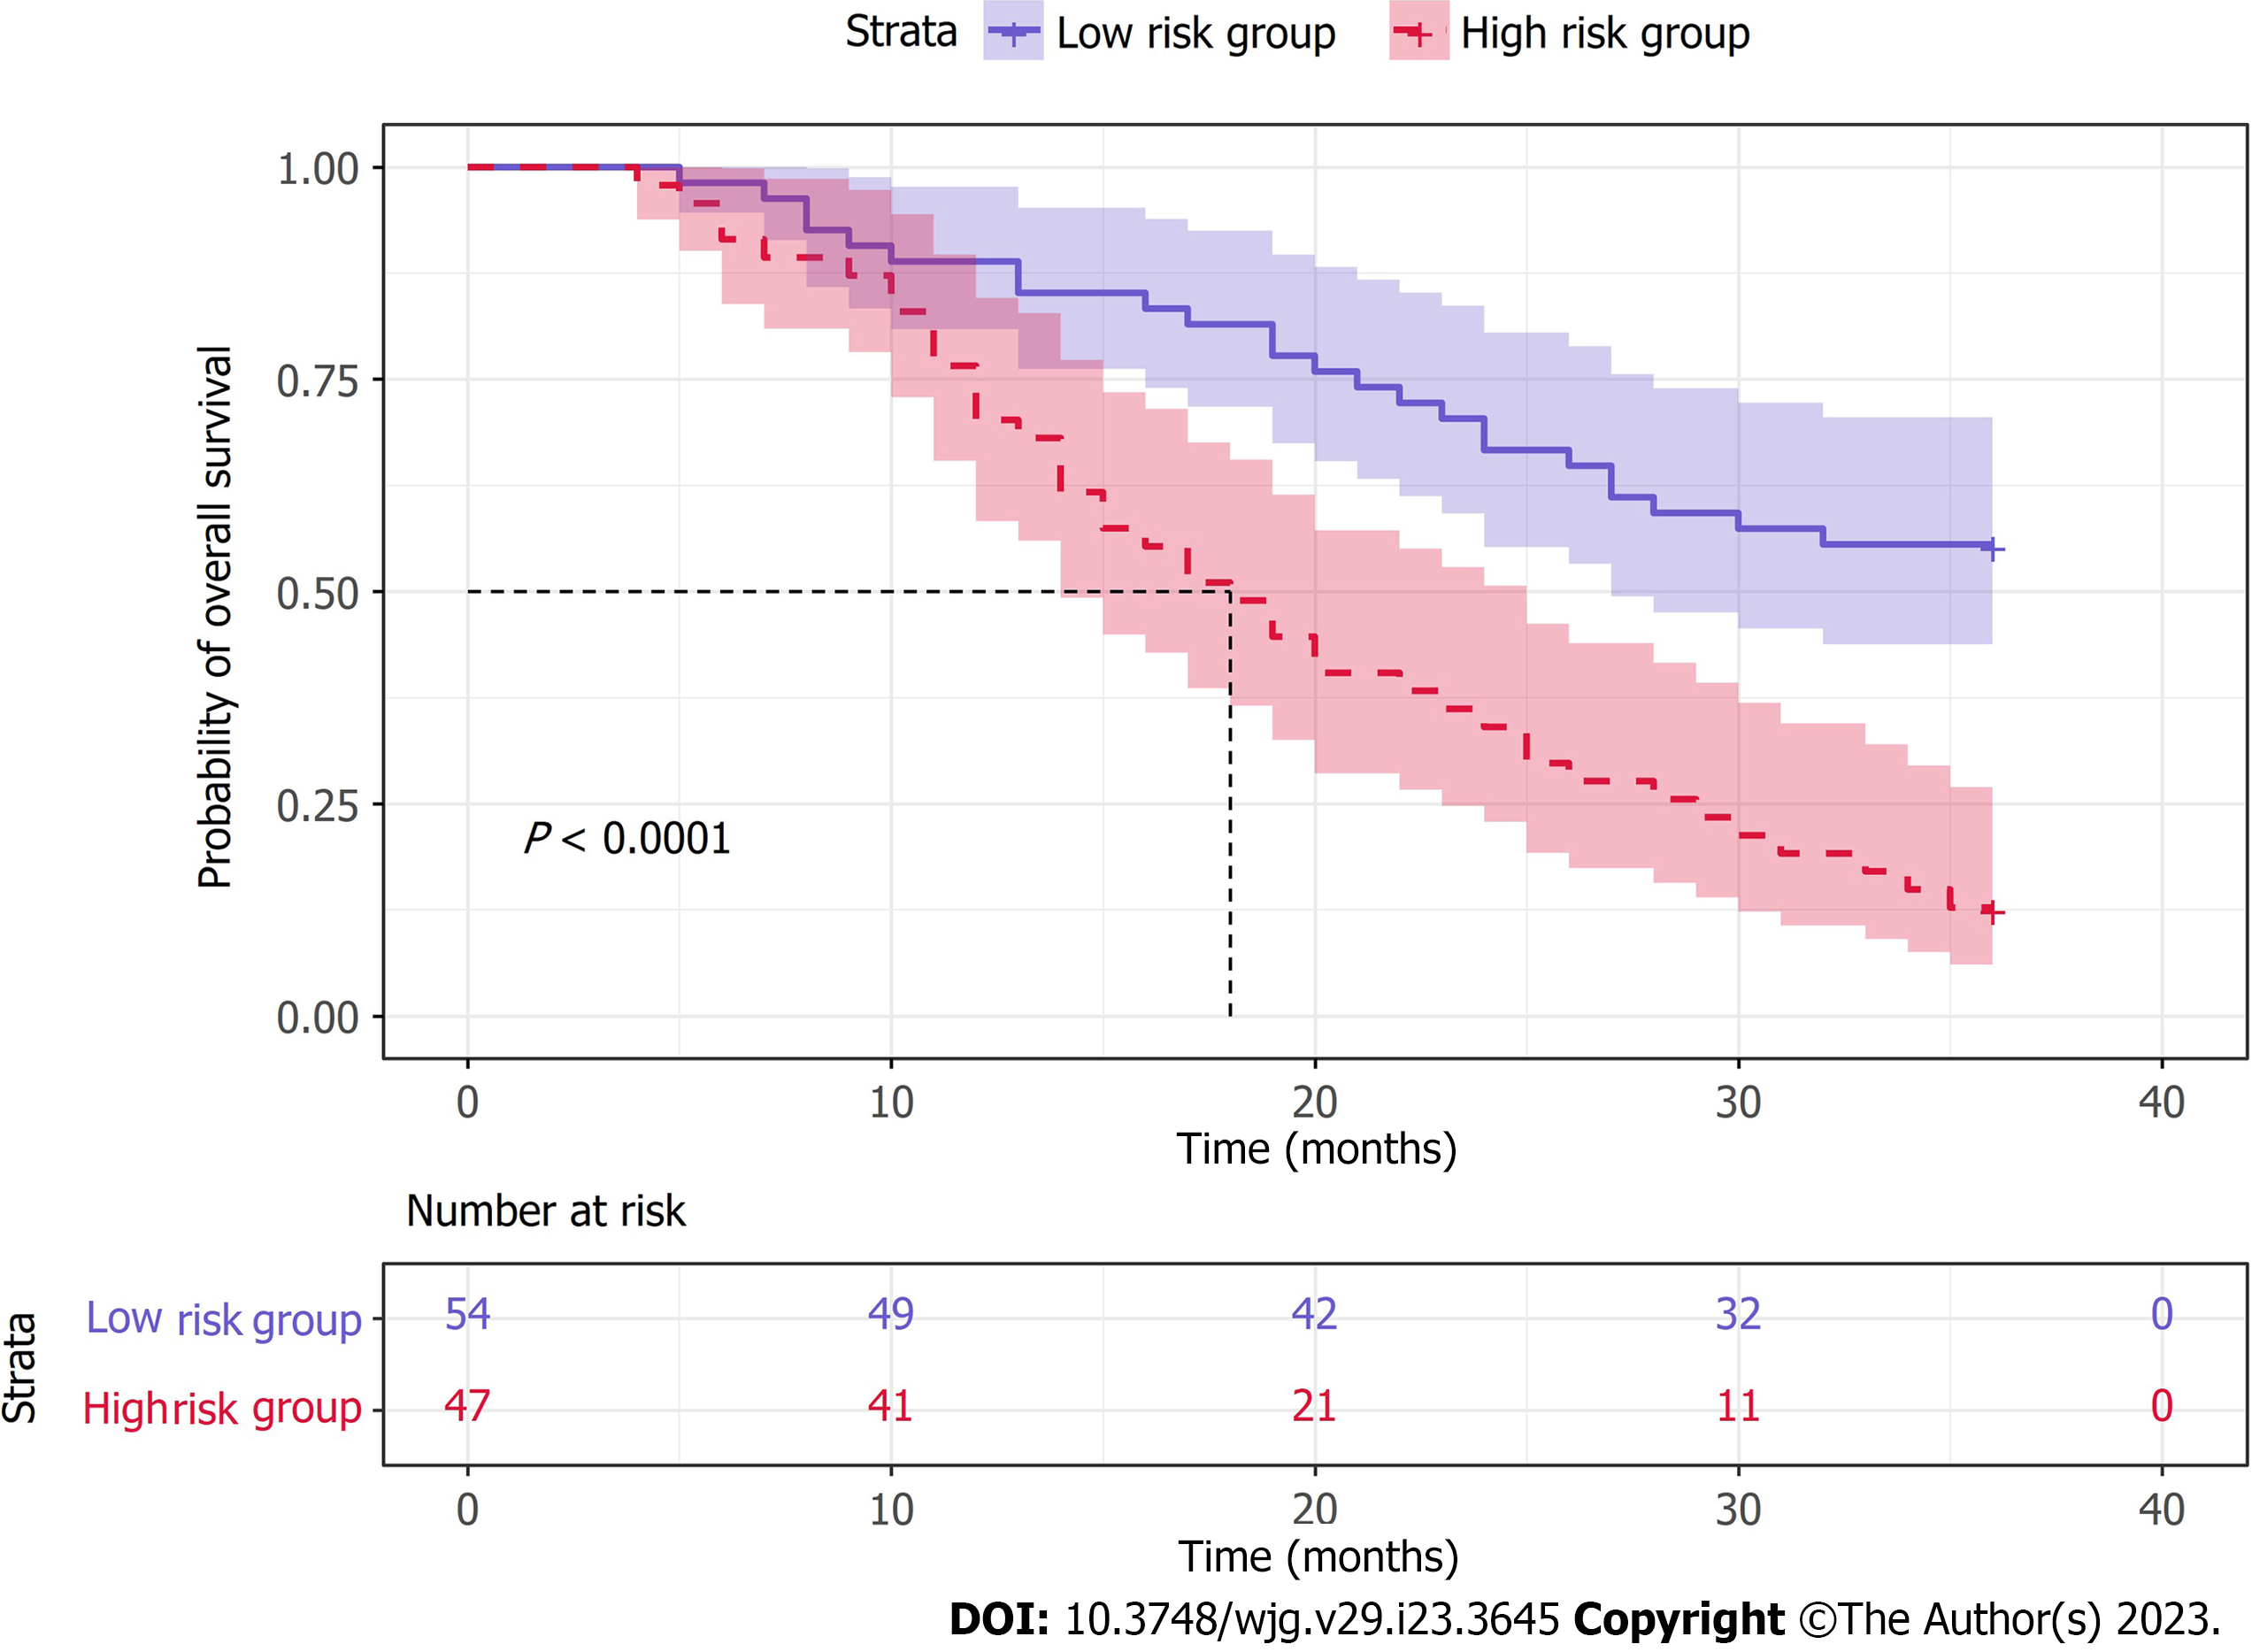
Figure 6 Overall survival Kaplan-Meier curves for patients in the low- and high-risk groups.
- Citation: Cao XM, Kang WD, Xia TH, Yuan SB, Guo CA, Wang WJ, Liu HB. High expression of the circadian clock gene NPAS2 is associated with progression and poor prognosis of gastric cancer: A single-center study. World J Gastroenterol 2023; 29(23): 3645-3657
- URL: https://www.wjgnet.com/1007-9327/full/v29/i23/3645.htm
- DOI: https://dx.doi.org/10.3748/wjg.v29.i23.3645


