Copyright
©The Author(s) 2023.
World J Gastroenterol. May 21, 2023; 29(19): 2961-2978
Published online May 21, 2023. doi: 10.3748/wjg.v29.i19.2961
Published online May 21, 2023. doi: 10.3748/wjg.v29.i19.2961
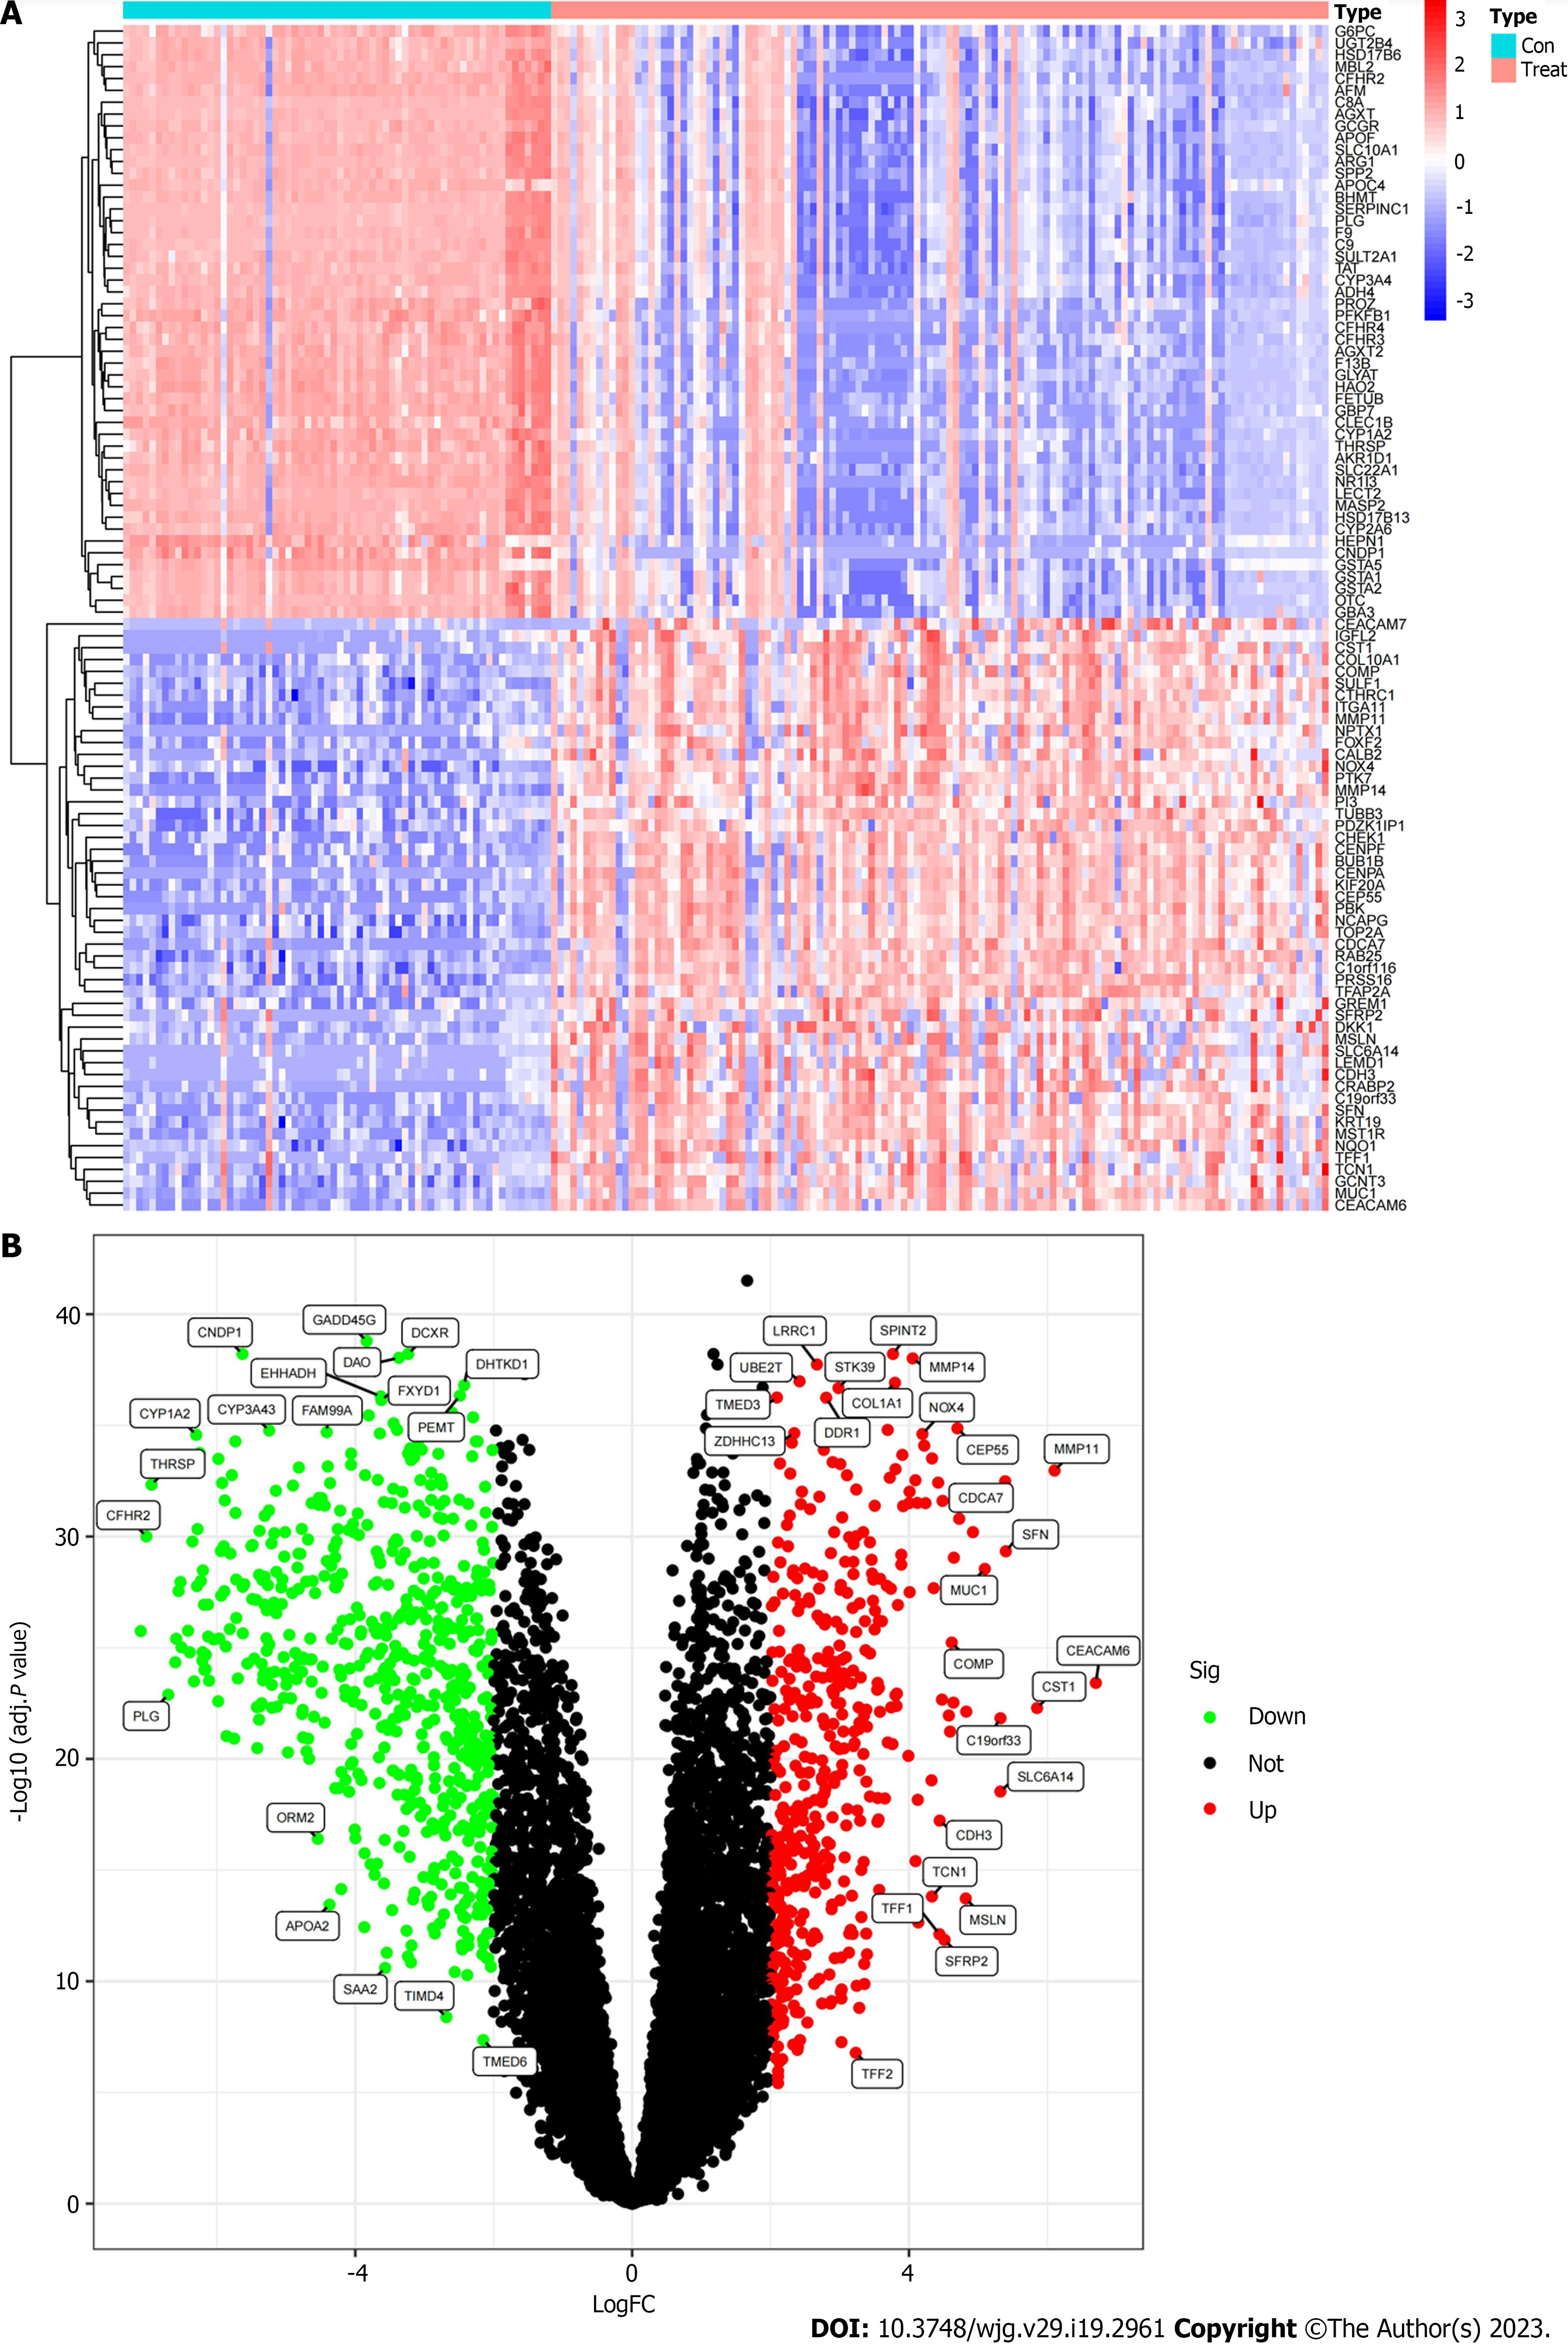
Figure 1 The differentially expressed mRNA of intrahepatic cholangiocarcinoma patients was screened based on GEO database training group.
A: The heat map of differential gene expression in cancer tissues (Treat) and paracancerous tissues (Con); B: The Volcano map of differential gene expression between cancer and paracancerous tissues.
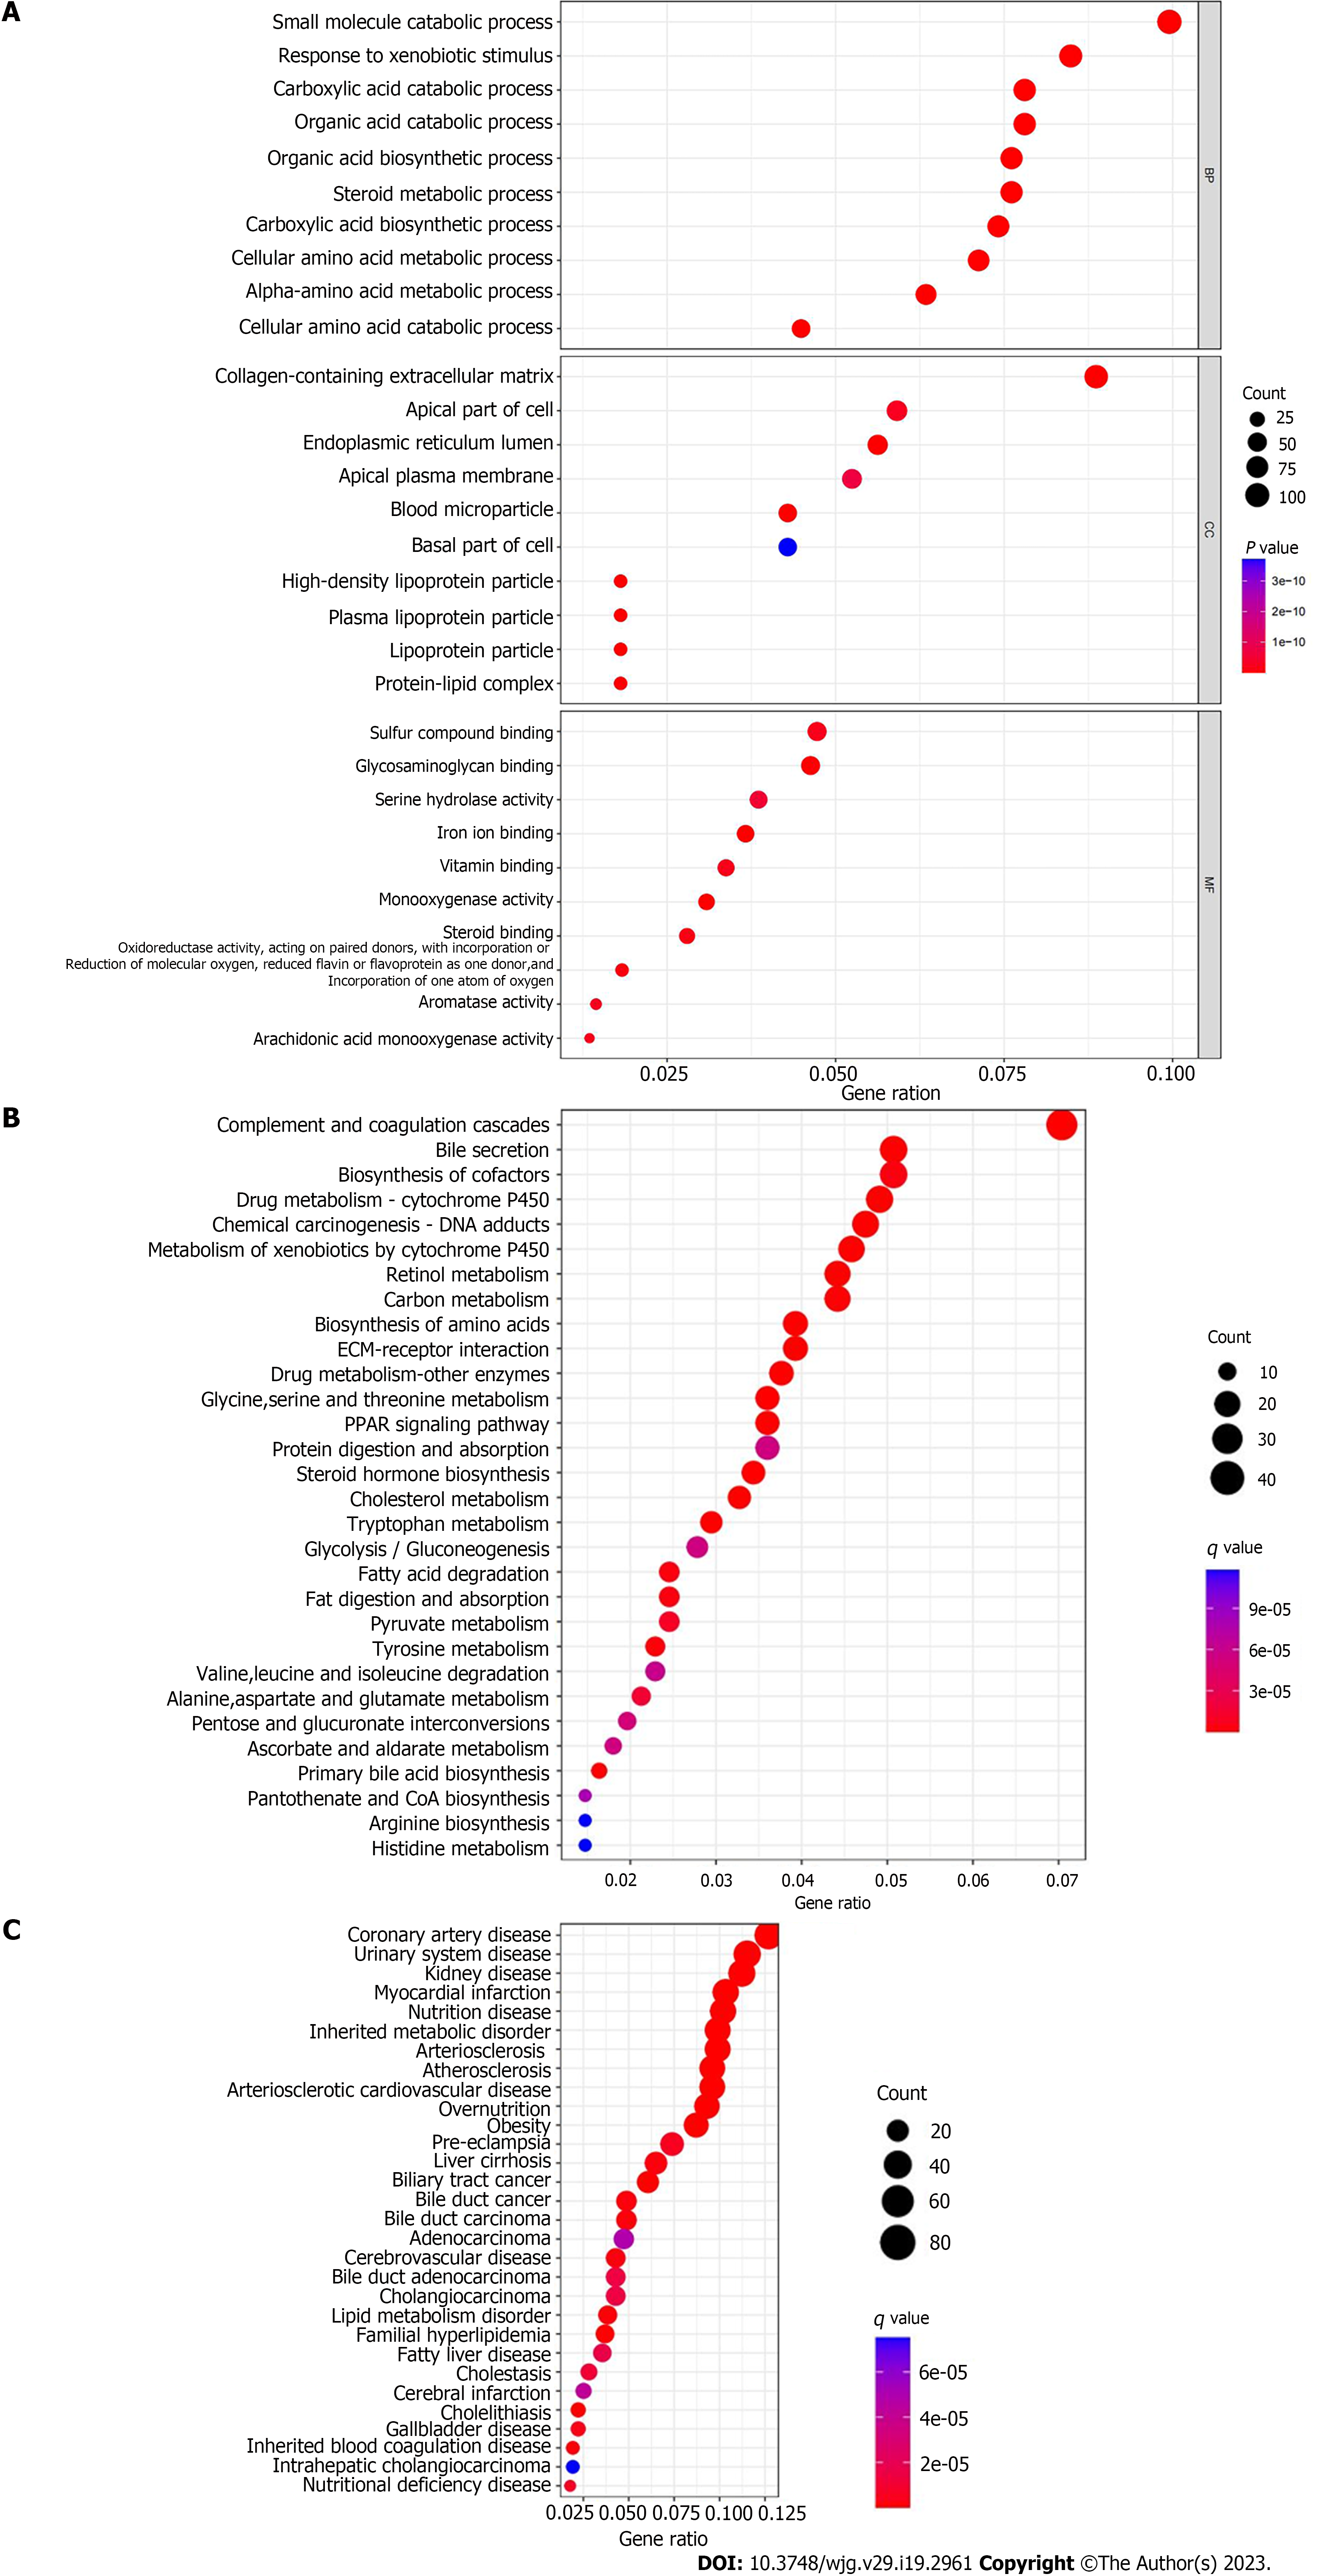
Figure 2 Enrichment analysis of differential genes.
A: GO functional enrichment analysis; B: KEGG pathway enrichment analysis; C: DO disease enrichment analysis.
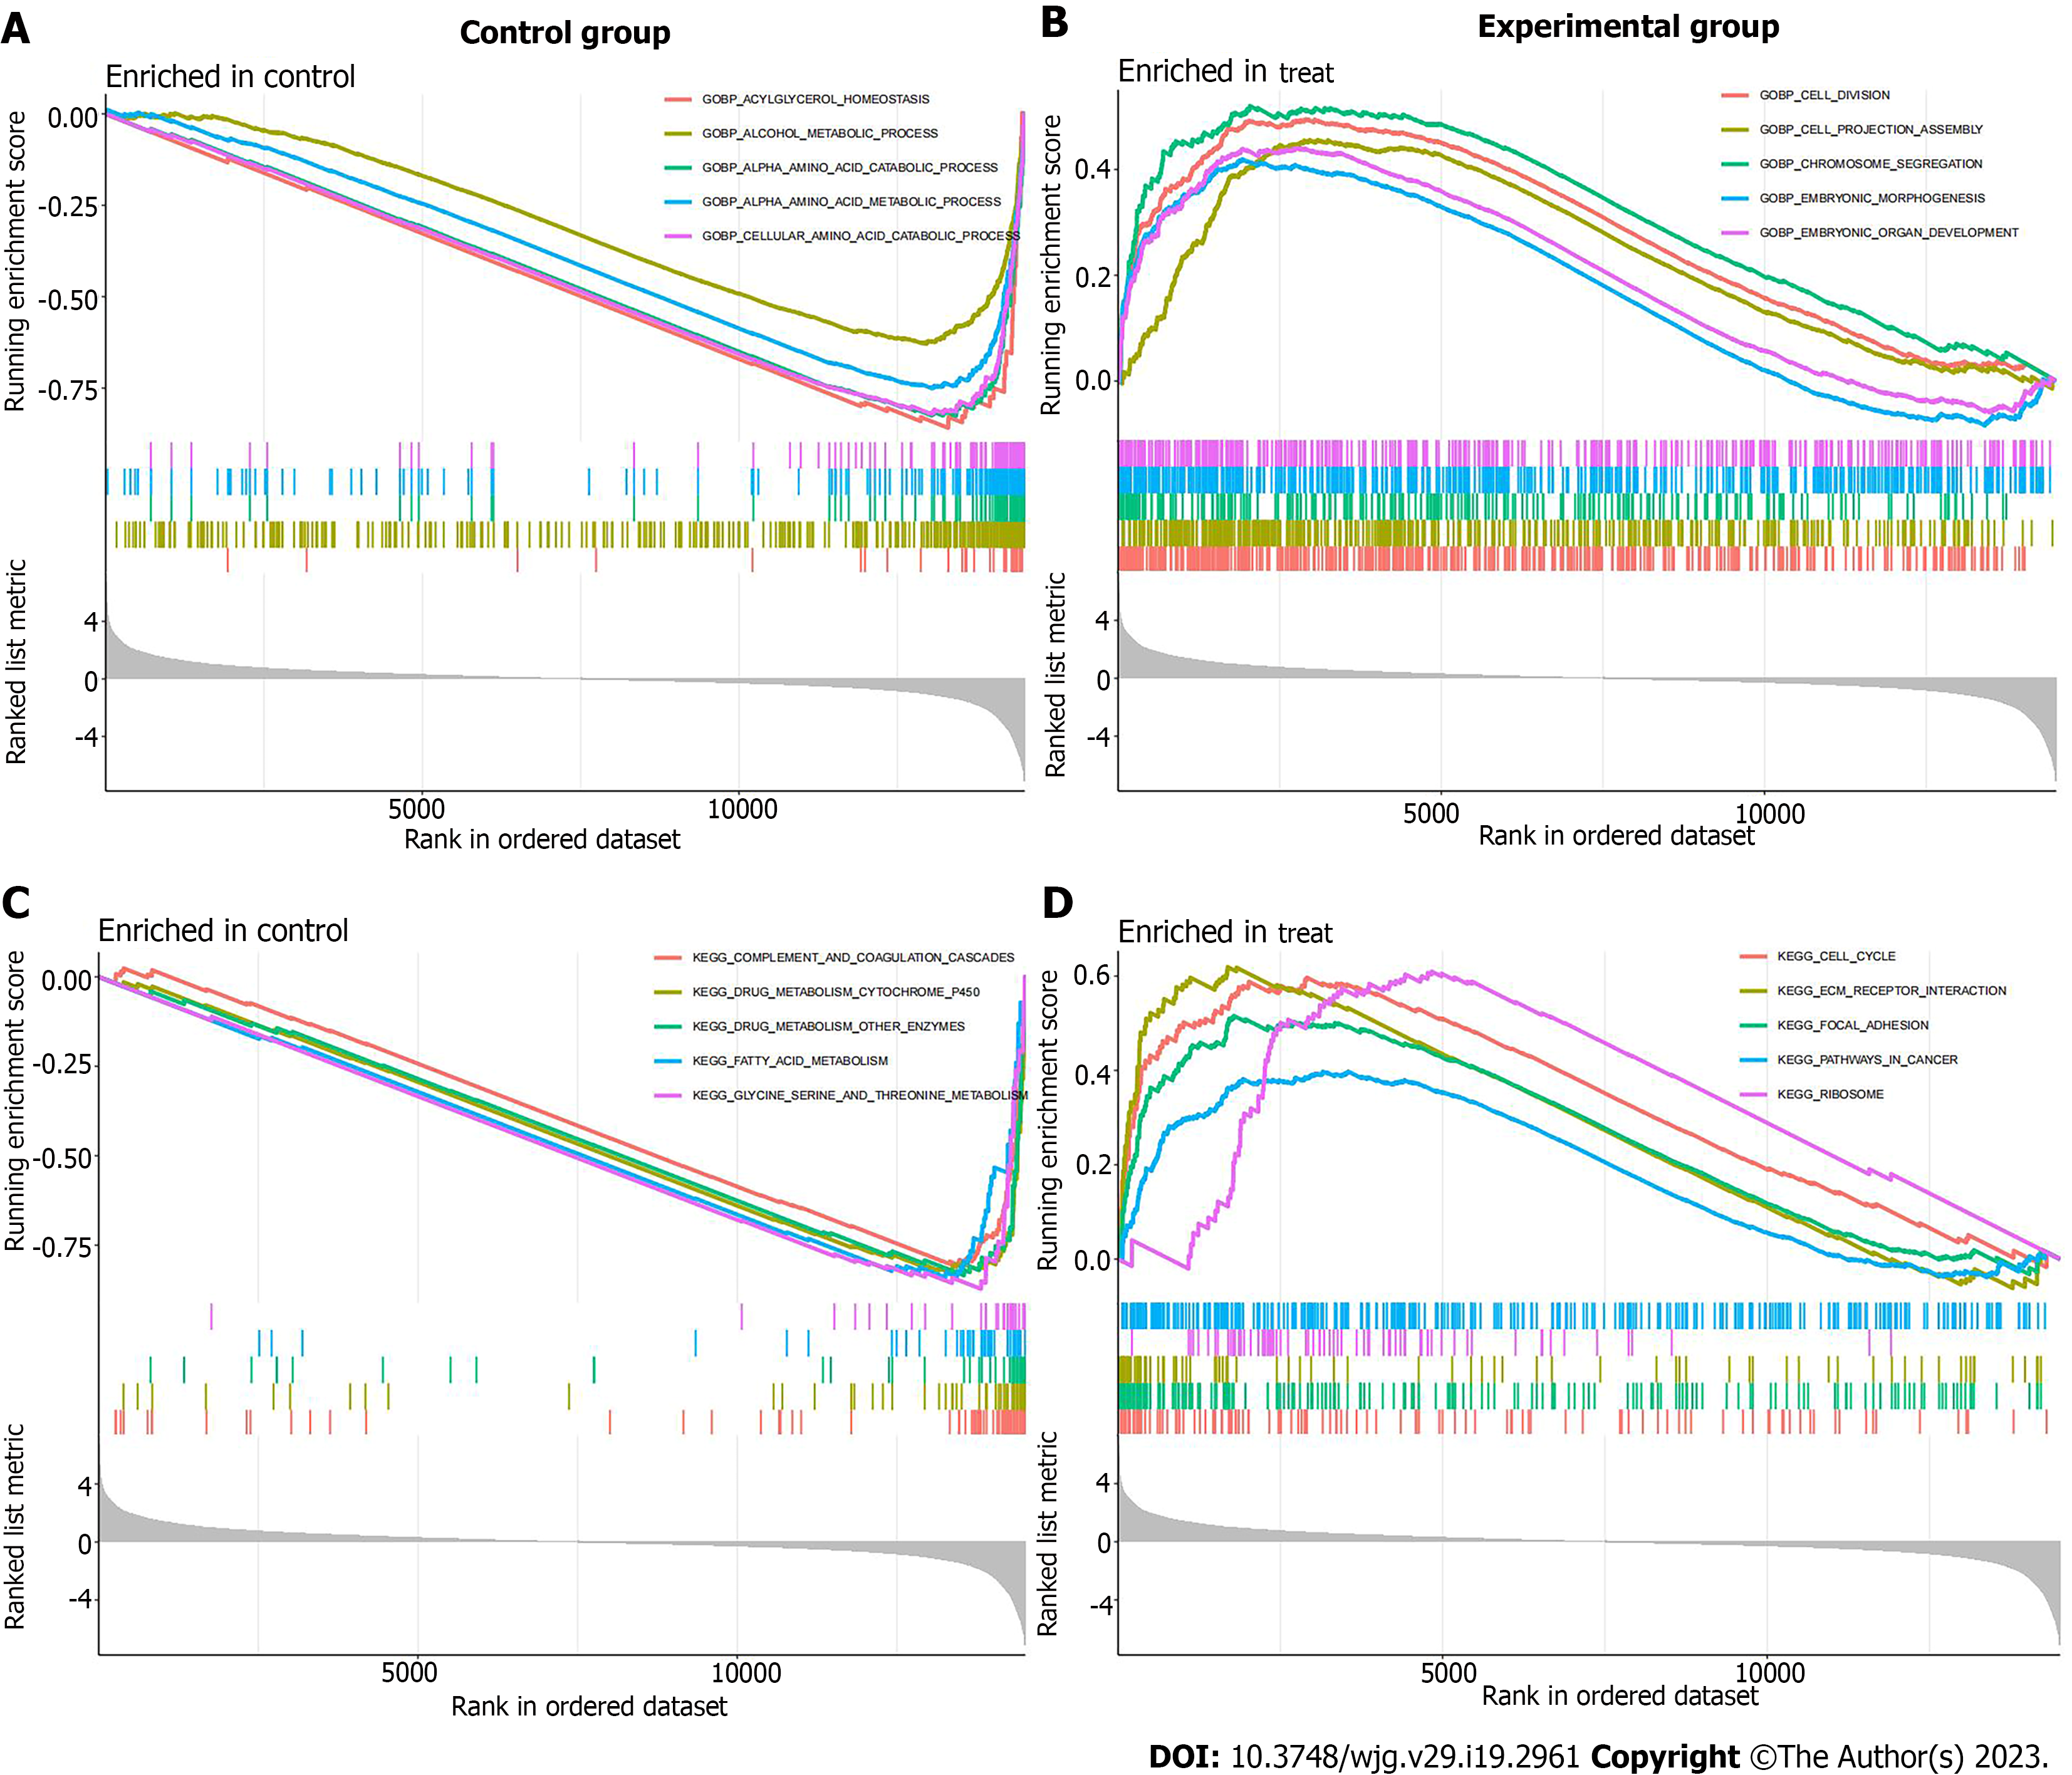
Figure 3 GSEA enrichment analysis of differential genes.
A: GO enrichment analysis in the control group; B: GO enrichment analysis in the experimental group; C: KEGG enrichment analysis in the control group; D: KEGG enrichment analysis in the experimental group.
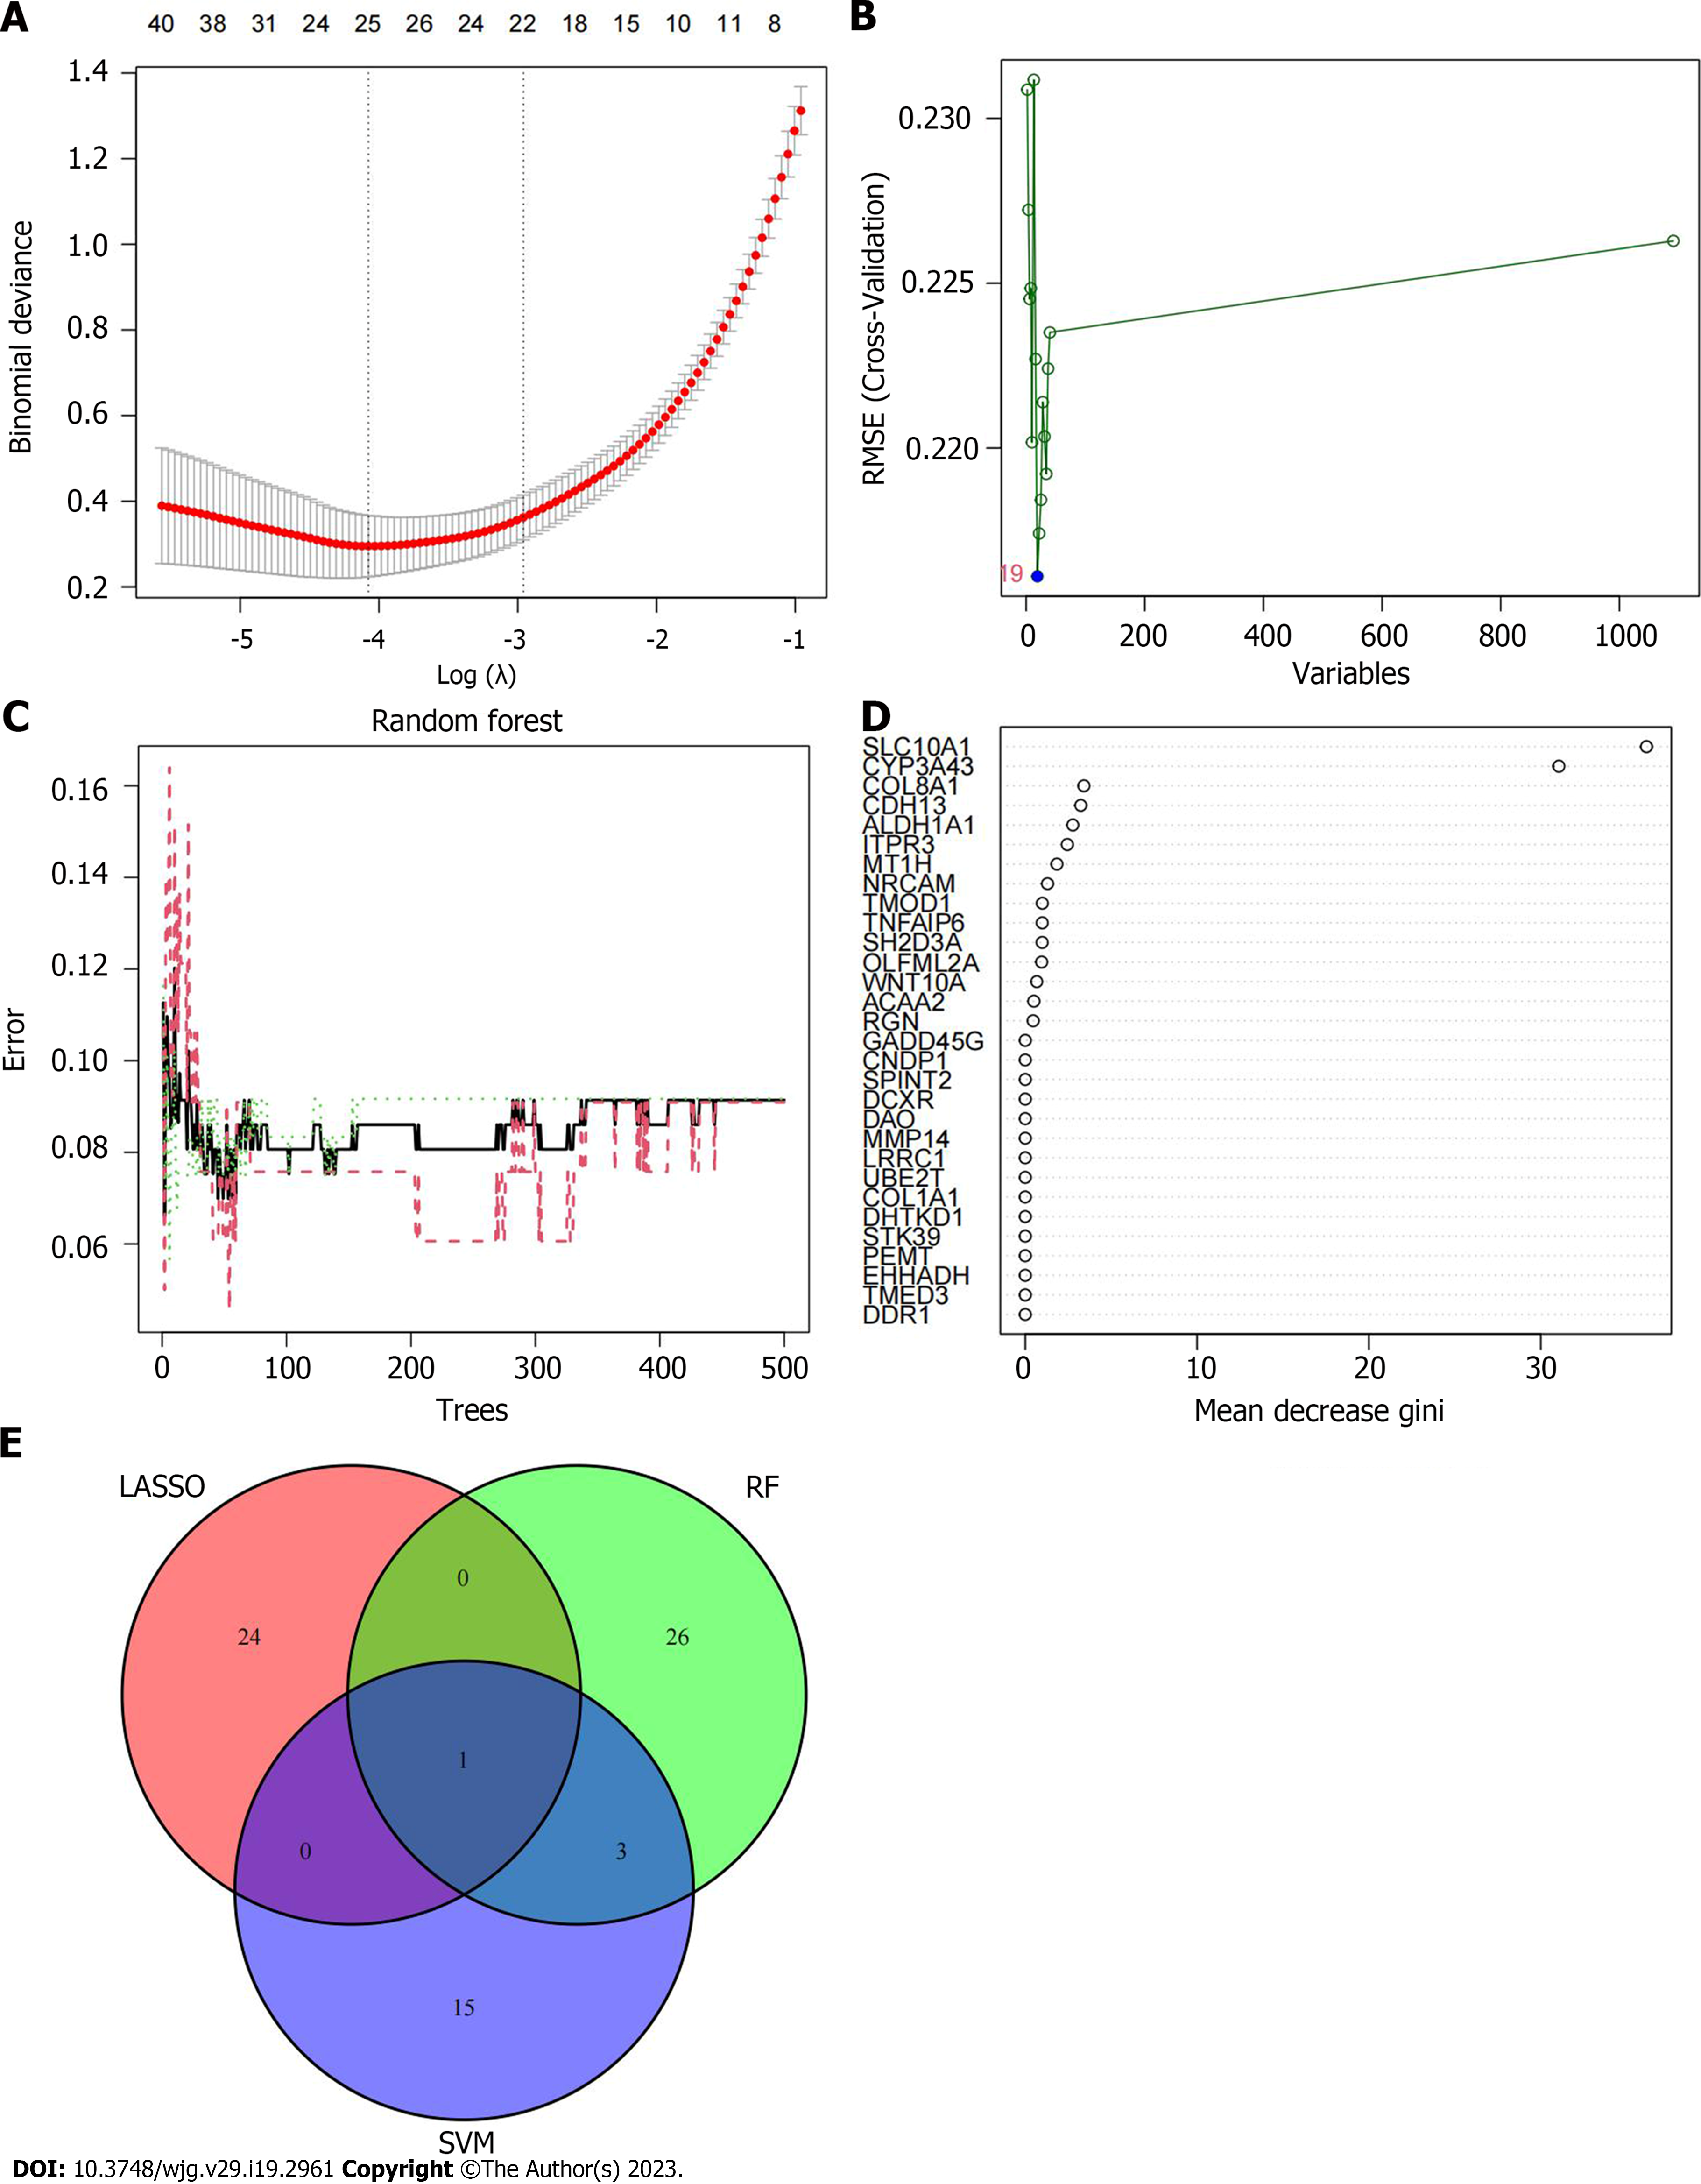
Figure 4 Screening of disease signature genes.
A: The process of least absolute shrinkage and selection operator regression screening of characteristic genes; B: The relationship between the error and the number of variables in support vector machine-recursive feature elimination; C: The impact of the amount of decision trees on the error rate; D: The name of the characteristic gene and the score of gene importance obtained by RF screening; E: The Venn diagrams of the intersection eigengenes obtained by the three algorithms. SVM: Support vector machine; LASSO: The least absolute shrinkage and selection operator; RF: Random forest.
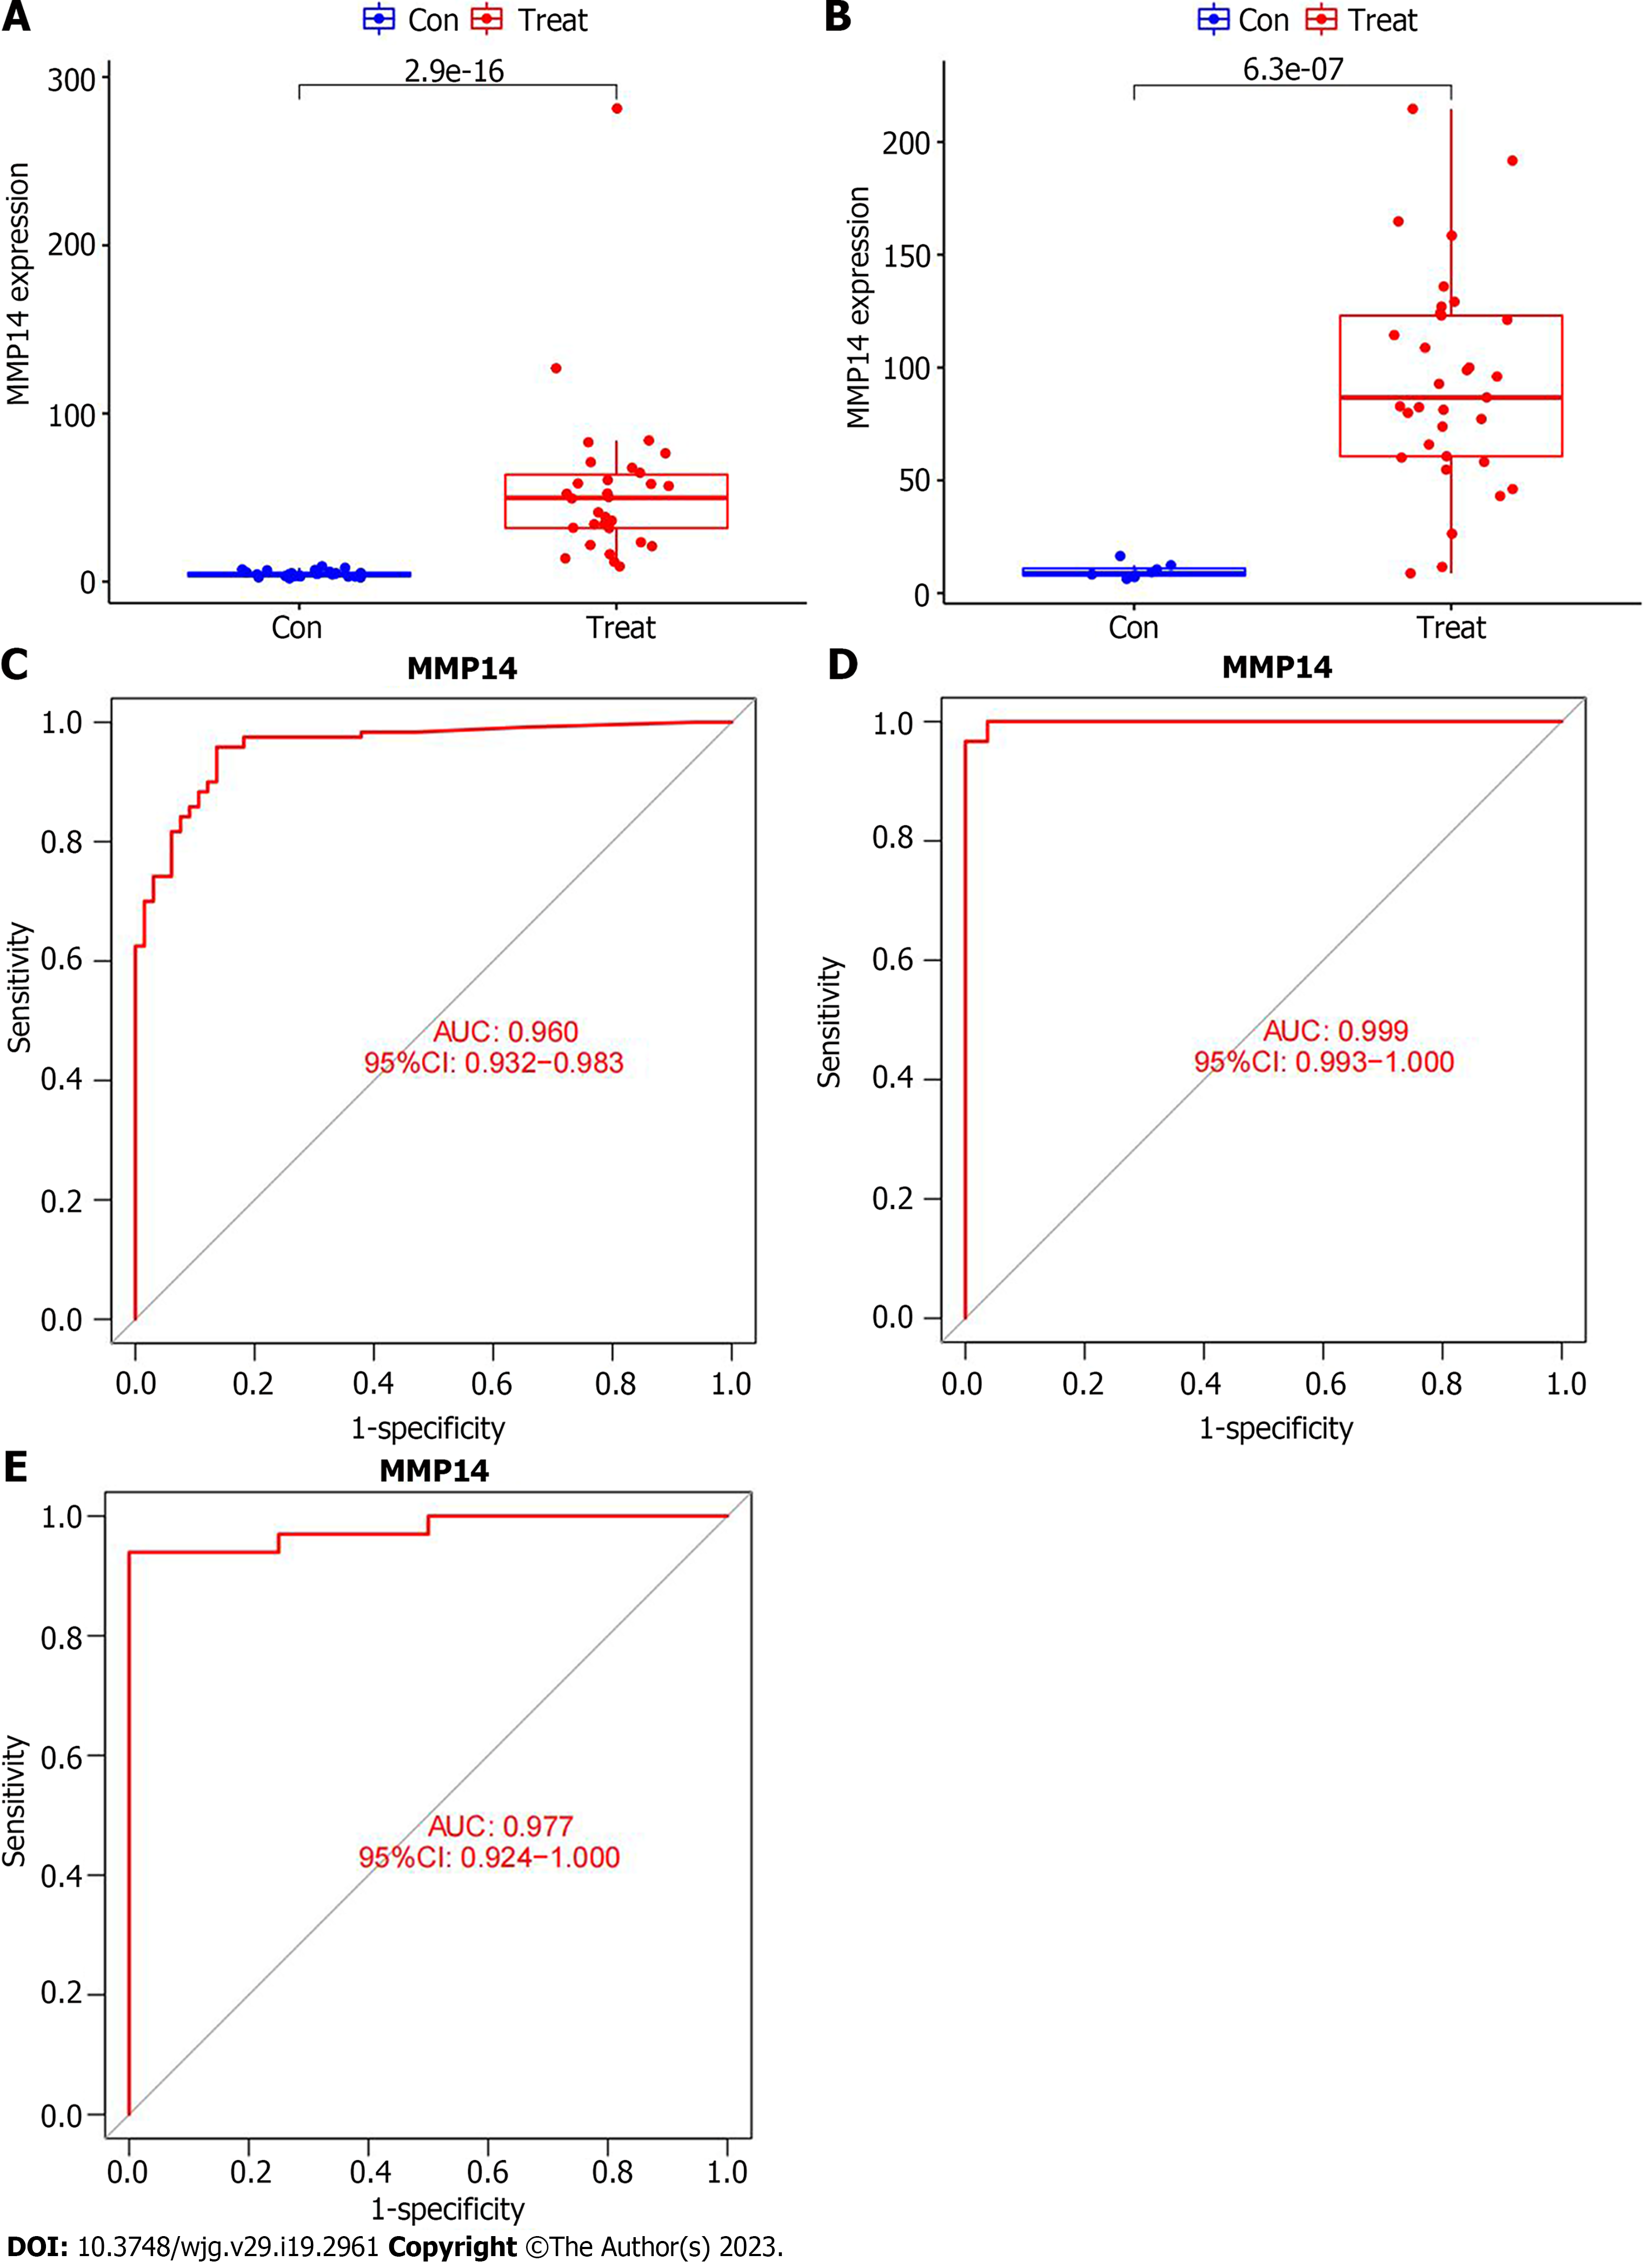
Figure 5 Analysis of the diagnostic value of intrahepatic cholangiocarcinoma characteristic genes.
A: The boxplot of the differential expression of MMP14 in the GSE107943 dataset; B: The boxplot of the differential expression of MMP14 in the The Cancer Genome Atlas (TCGA) database; C: In the training group, the receiver operating characteristic (ROC) curve of MMP14 to evaluate the diagnostic efficacy of intrahepatic cholangiocarcinoma (ICC); D: In the GSE107943 dataset of the verification group, the ROC curve of MMP14 to evaluate the diagnostic efficacy of ICC; E: In the TCGA dataset of the verification group, the ROC curve of MMP14 to evaluate the diagnostic efficacy of ICC. AUC: Area under the curve; 95%CI: 95% confidence interval.
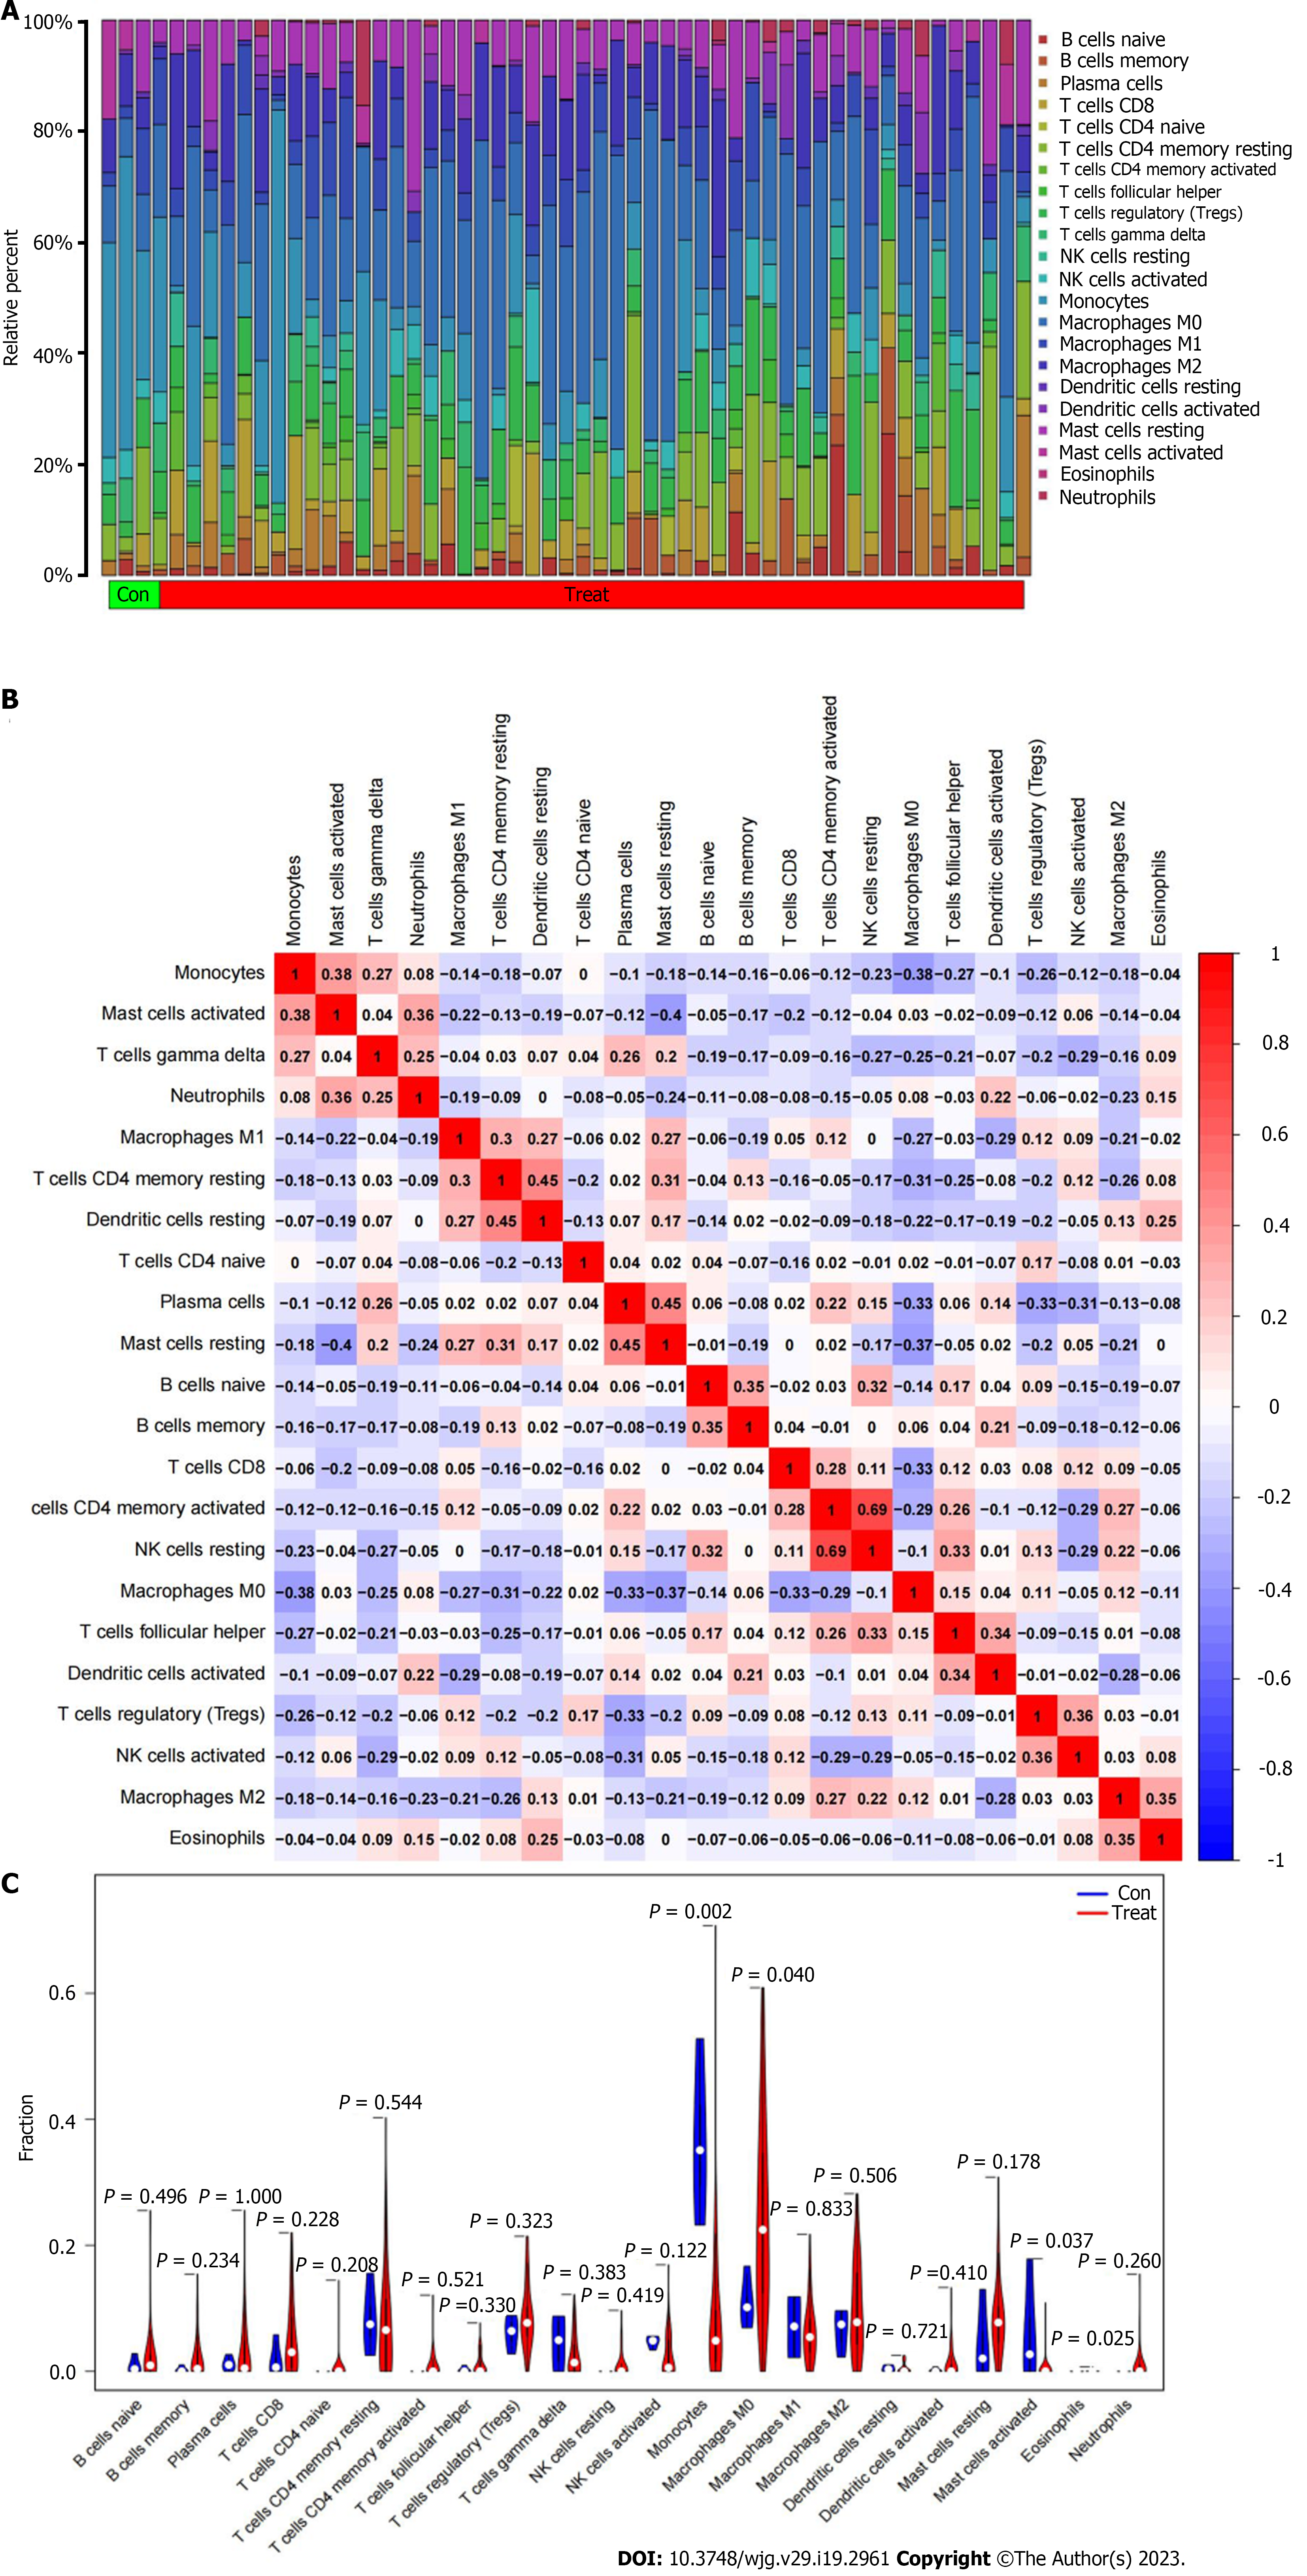
Figure 6 The distribution of immune infiltrating cells in intrahepatic cholangiocarcinoma.
A: The relative content of immune infiltrating cells in each sample; B: The correlation heatmap composed of cells in all samples; C: The violin plot of the difference in immune cell infiltration between intrahepatic cholangiocarcinoma cancer and paracancerous tissues.
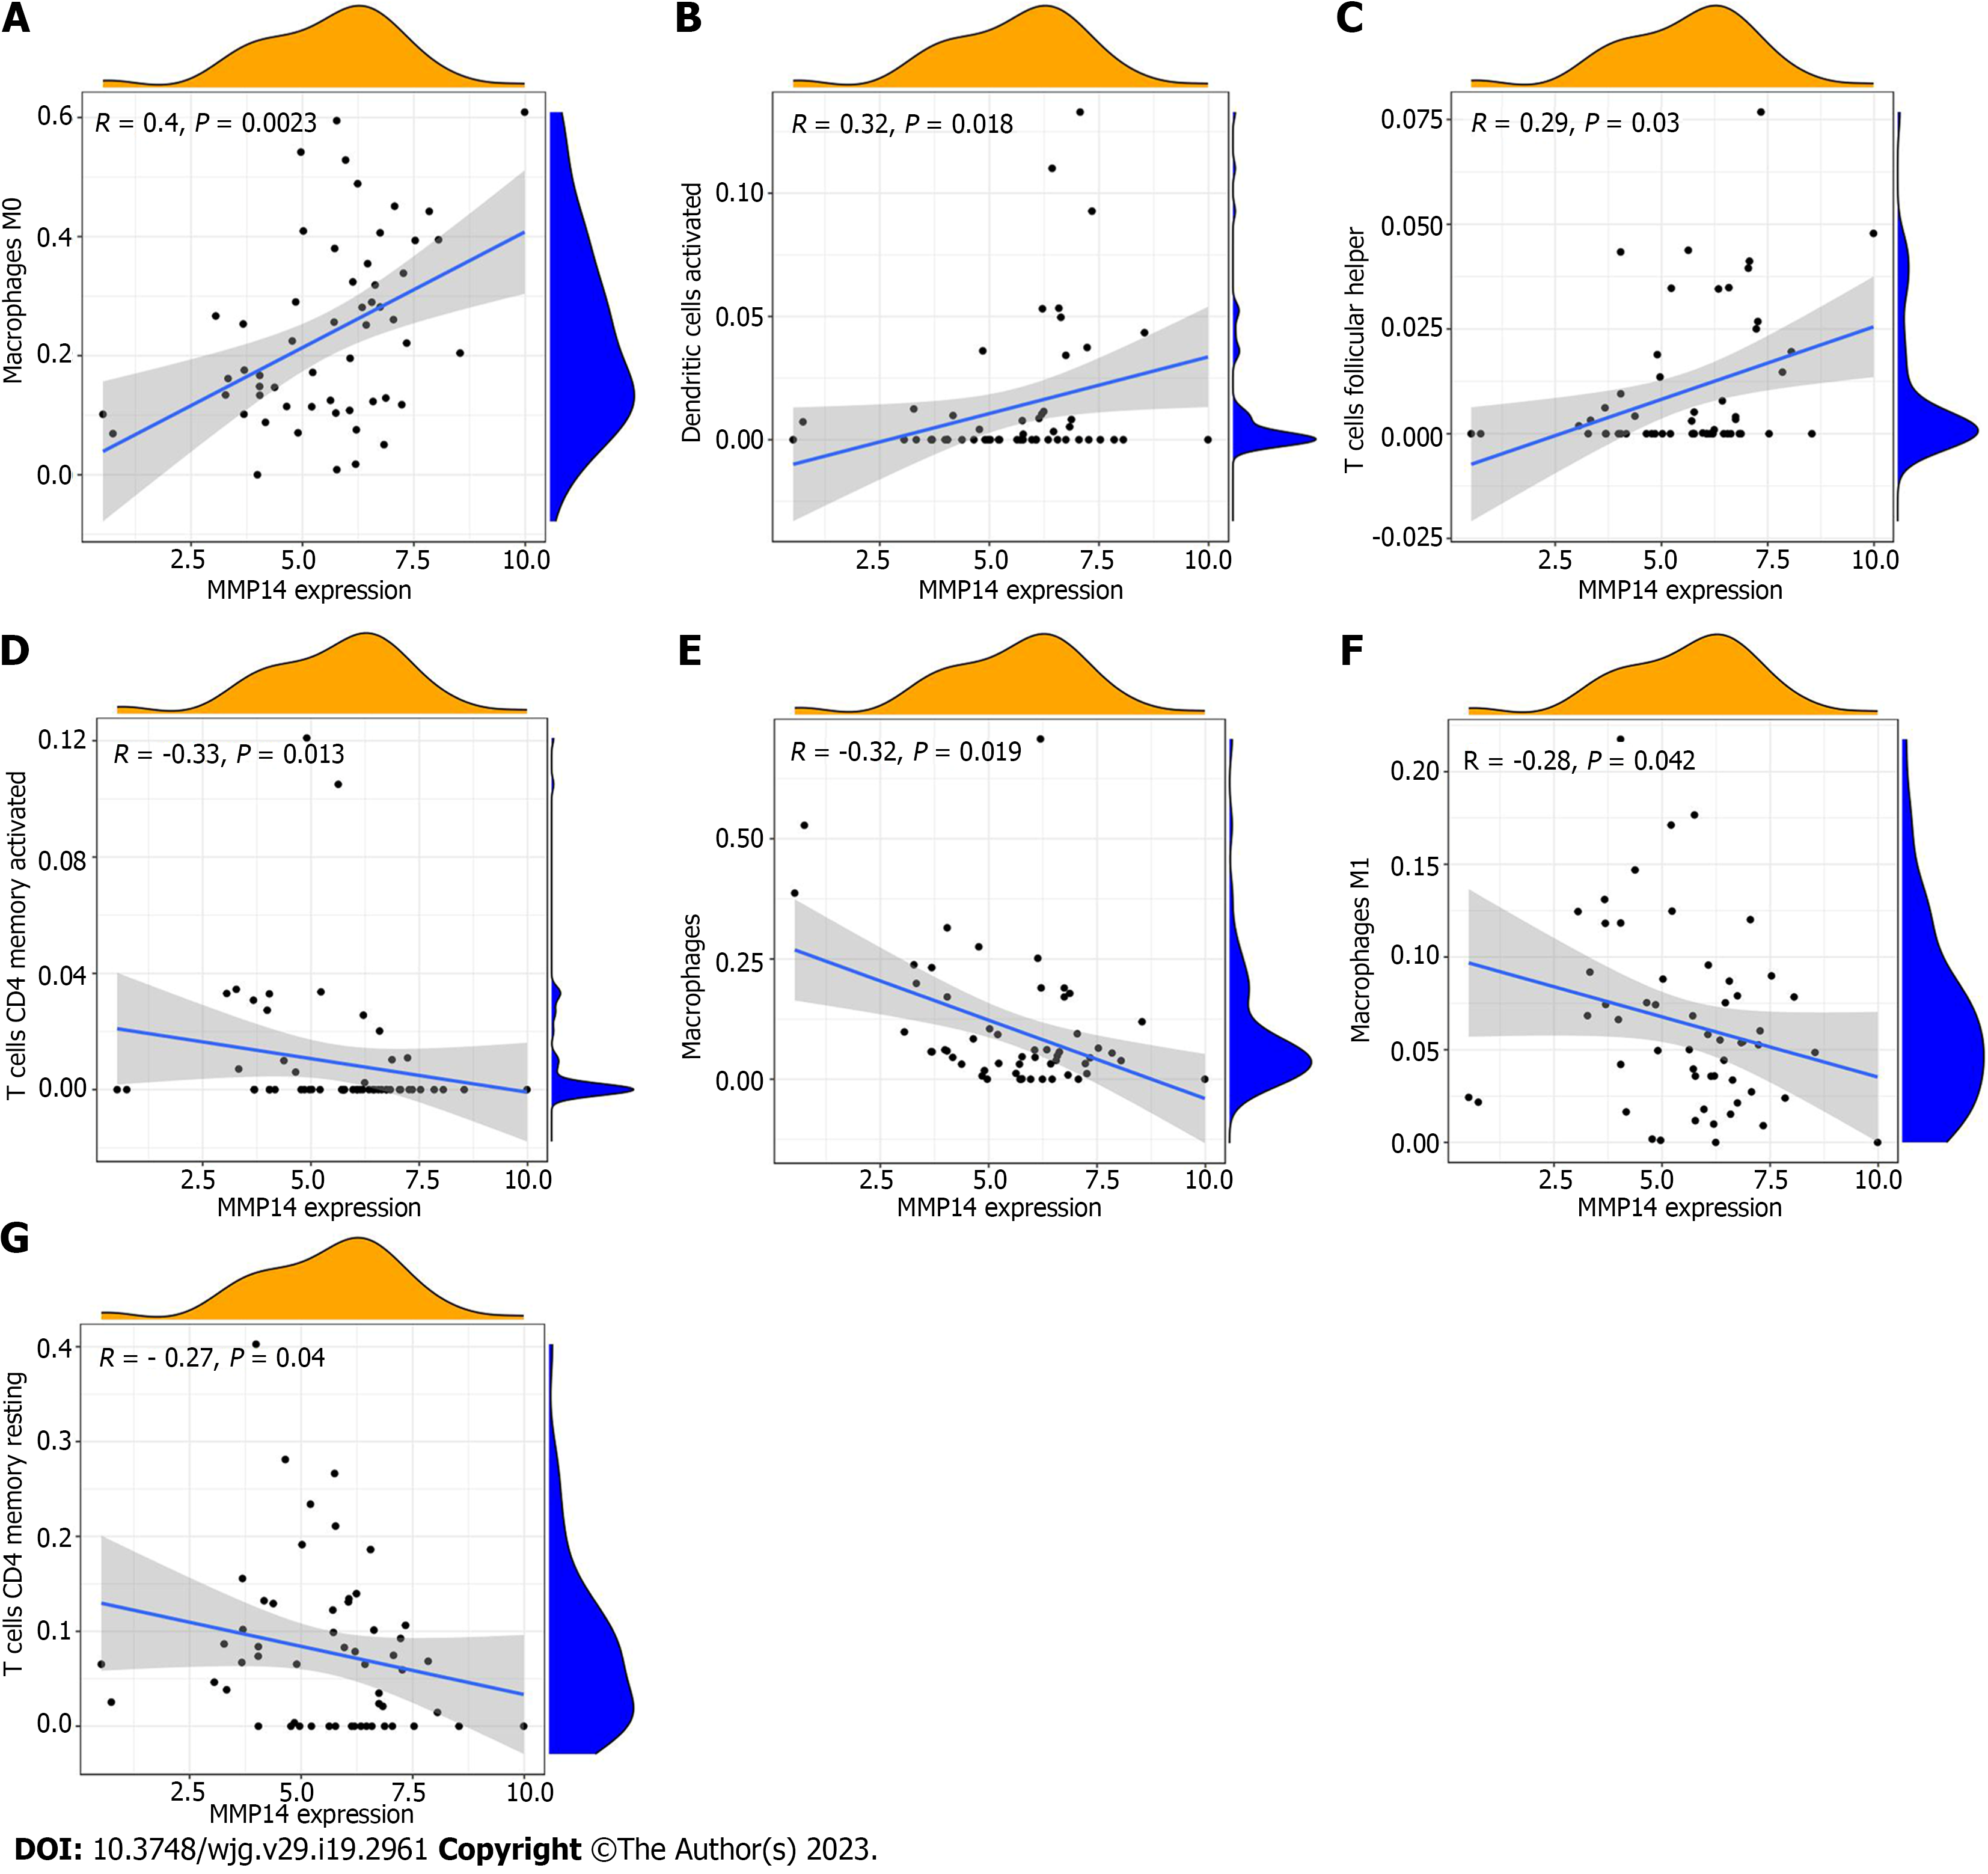
Figure 7 The scatter plot of the correlation between MMP14 expression and immune cells.
A: Macrophage M0; B: Dendritic cell activation; C: T cell follicular assisted cell activation; D: T cell CD4 memory activation; E: monocyte; F: Macrophage M1; G: T cell CD4 memory resting.
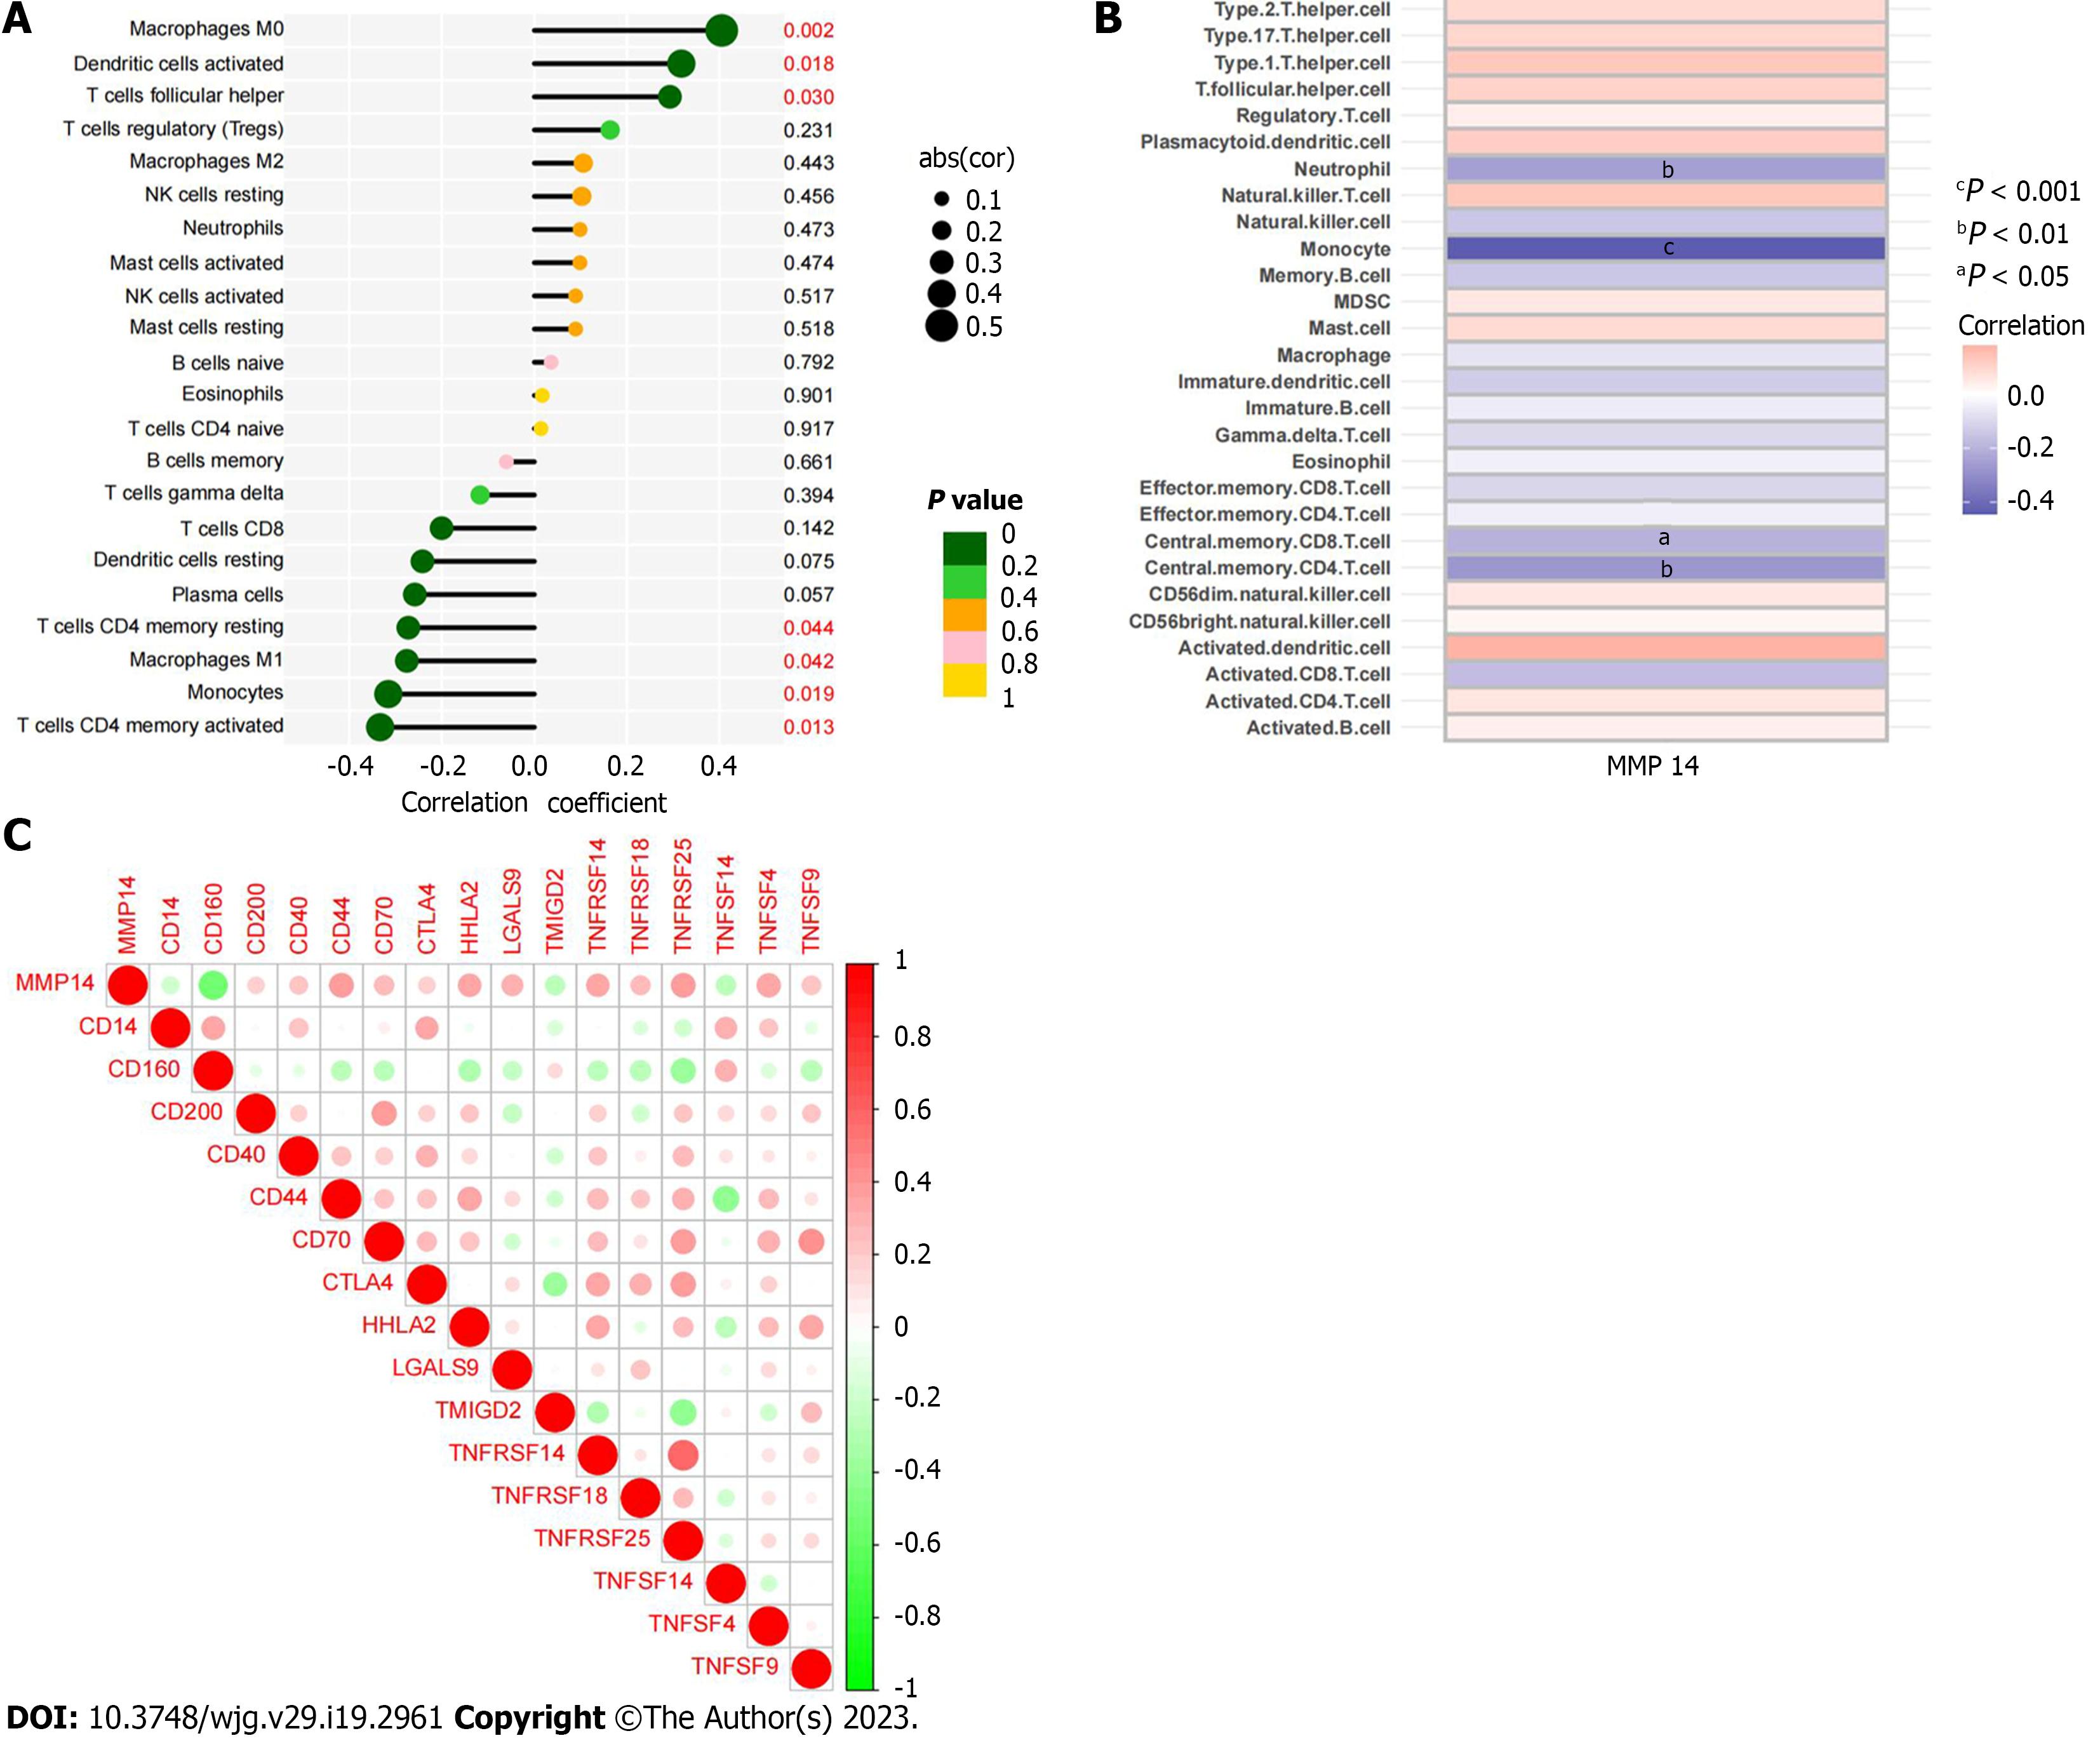
Figure 8 Correlation of MMP14 with immune cell content and immune checkpoint expression.
A: Correlation between MMP14 and immune cell infiltration based on CIBERSORT algorithm; B: Correlation between MMP14 and immune cell infiltration based on ssGSEA algorithm; C: The heat map of the correlation between MMP14 and immune checkpoint expression.
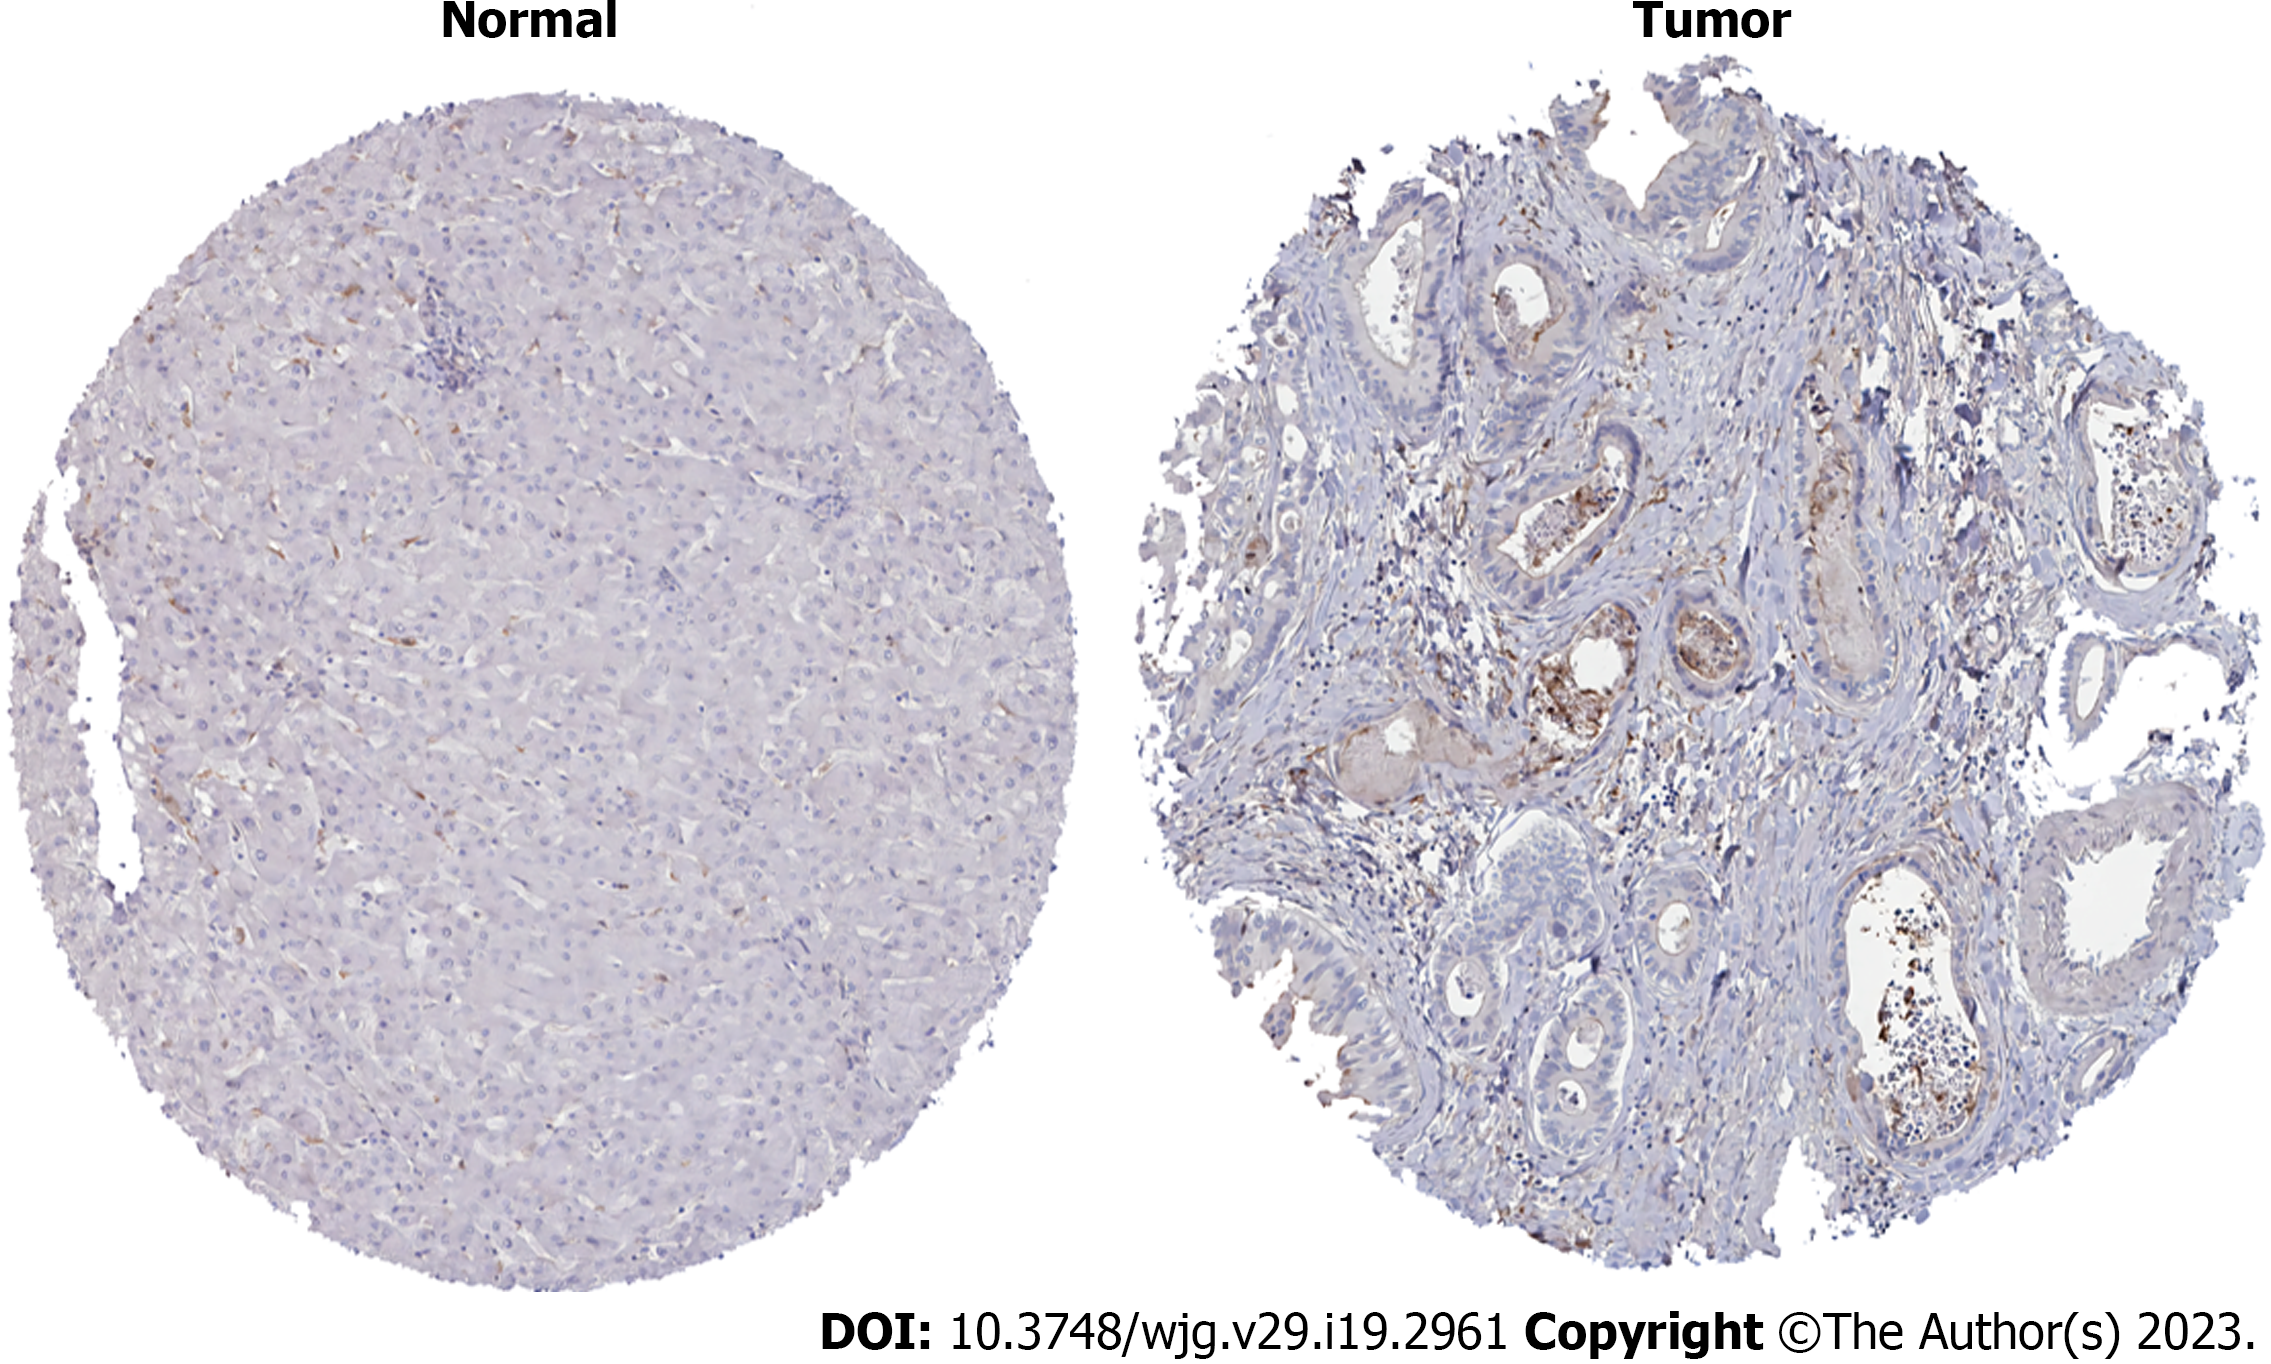
Figure 9
Human Protein Atlas analysis of MMP14 protein expression levels in intrahepatic cholangiocarcinoma cancer and paracancerous tissues.
- Citation: Wu J, Guo Y, Zuo ZF, Zhu ZW, Han L. MMP14 is a diagnostic gene of intrahepatic cholangiocarcinoma associated with immune cell infiltration. World J Gastroenterol 2023; 29(19): 2961-2978
- URL: https://www.wjgnet.com/1007-9327/full/v29/i19/2961.htm
- DOI: https://dx.doi.org/10.3748/wjg.v29.i19.2961


