Copyright
©The Author(s) 2023.
World J Gastroenterol. Mar 28, 2023; 29(12): 1875-1898
Published online Mar 28, 2023. doi: 10.3748/wjg.v29.i12.1875
Published online Mar 28, 2023. doi: 10.3748/wjg.v29.i12.1875
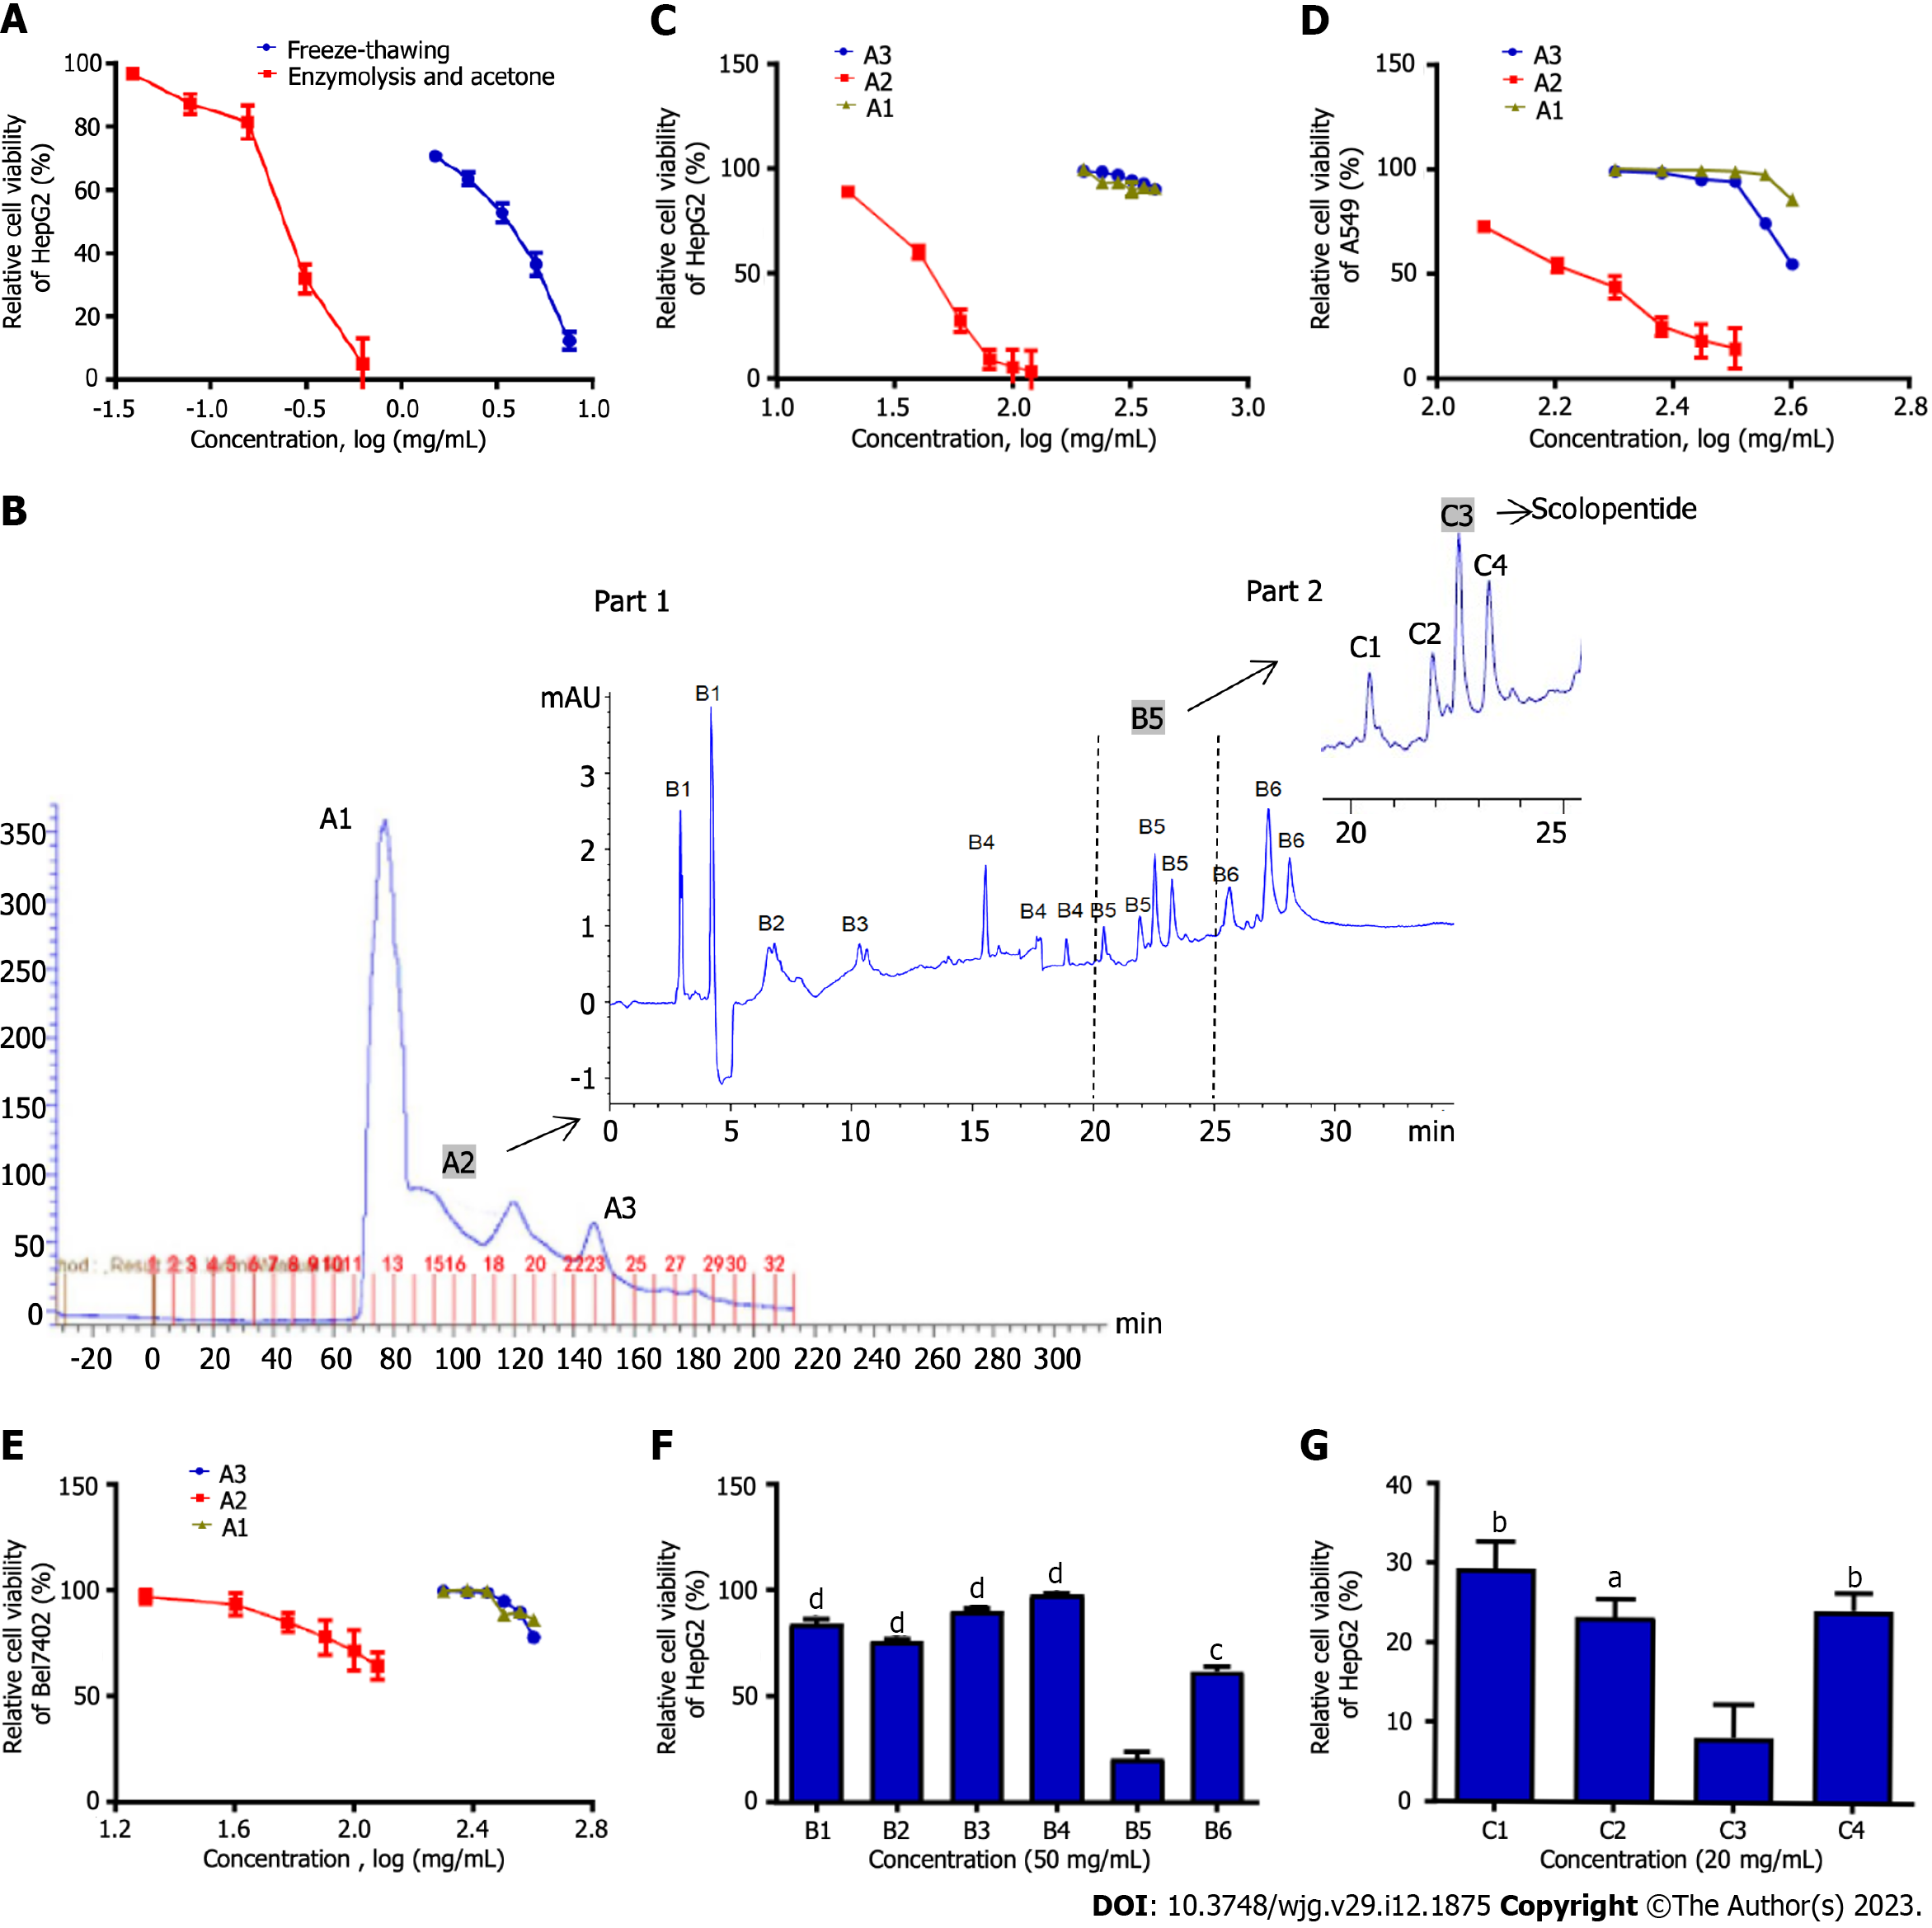
Figure 1 Purification of scolopentide from crude centipede peptides.
A: The CCK8 assay showed the cytotoxicity of extracts from two methods, and optimal enzymatic hydrolysis was superior to freeze-thawing with liquid nitrogen; B: After the first purification, the Sephadex G-25 chromatogram showed 3 peaks, and A2 was chosen for further isolation; after the second purification, the high-performance liquid chromatography (HPLC) chromatogram showed 6 parts, and B5 was chosen for further purification (part 1); after the third purification, the HPLC chromatogram showed 4 parts, and C3 was chosen for further purification (part 2); C-E: Relative cell viability of HepG2 (C), A549 (D), and Bel7402 (E) cells treated with A1-3 at different concentrations (mg/mL). A2 showed stronger suppression than A1 and A3; F: The CCK8 assay showed that B5 (50 μg/mL) had the strongest suppression of HepG2 cells among B1-6; G: The CCK8 assay showed that C3 (20 μg/mL) had the strongest suppression of HepG2 cells among C1-4. aP < 0.05, bP < 0.01, cP < 0.001, and dP < 0.0001.
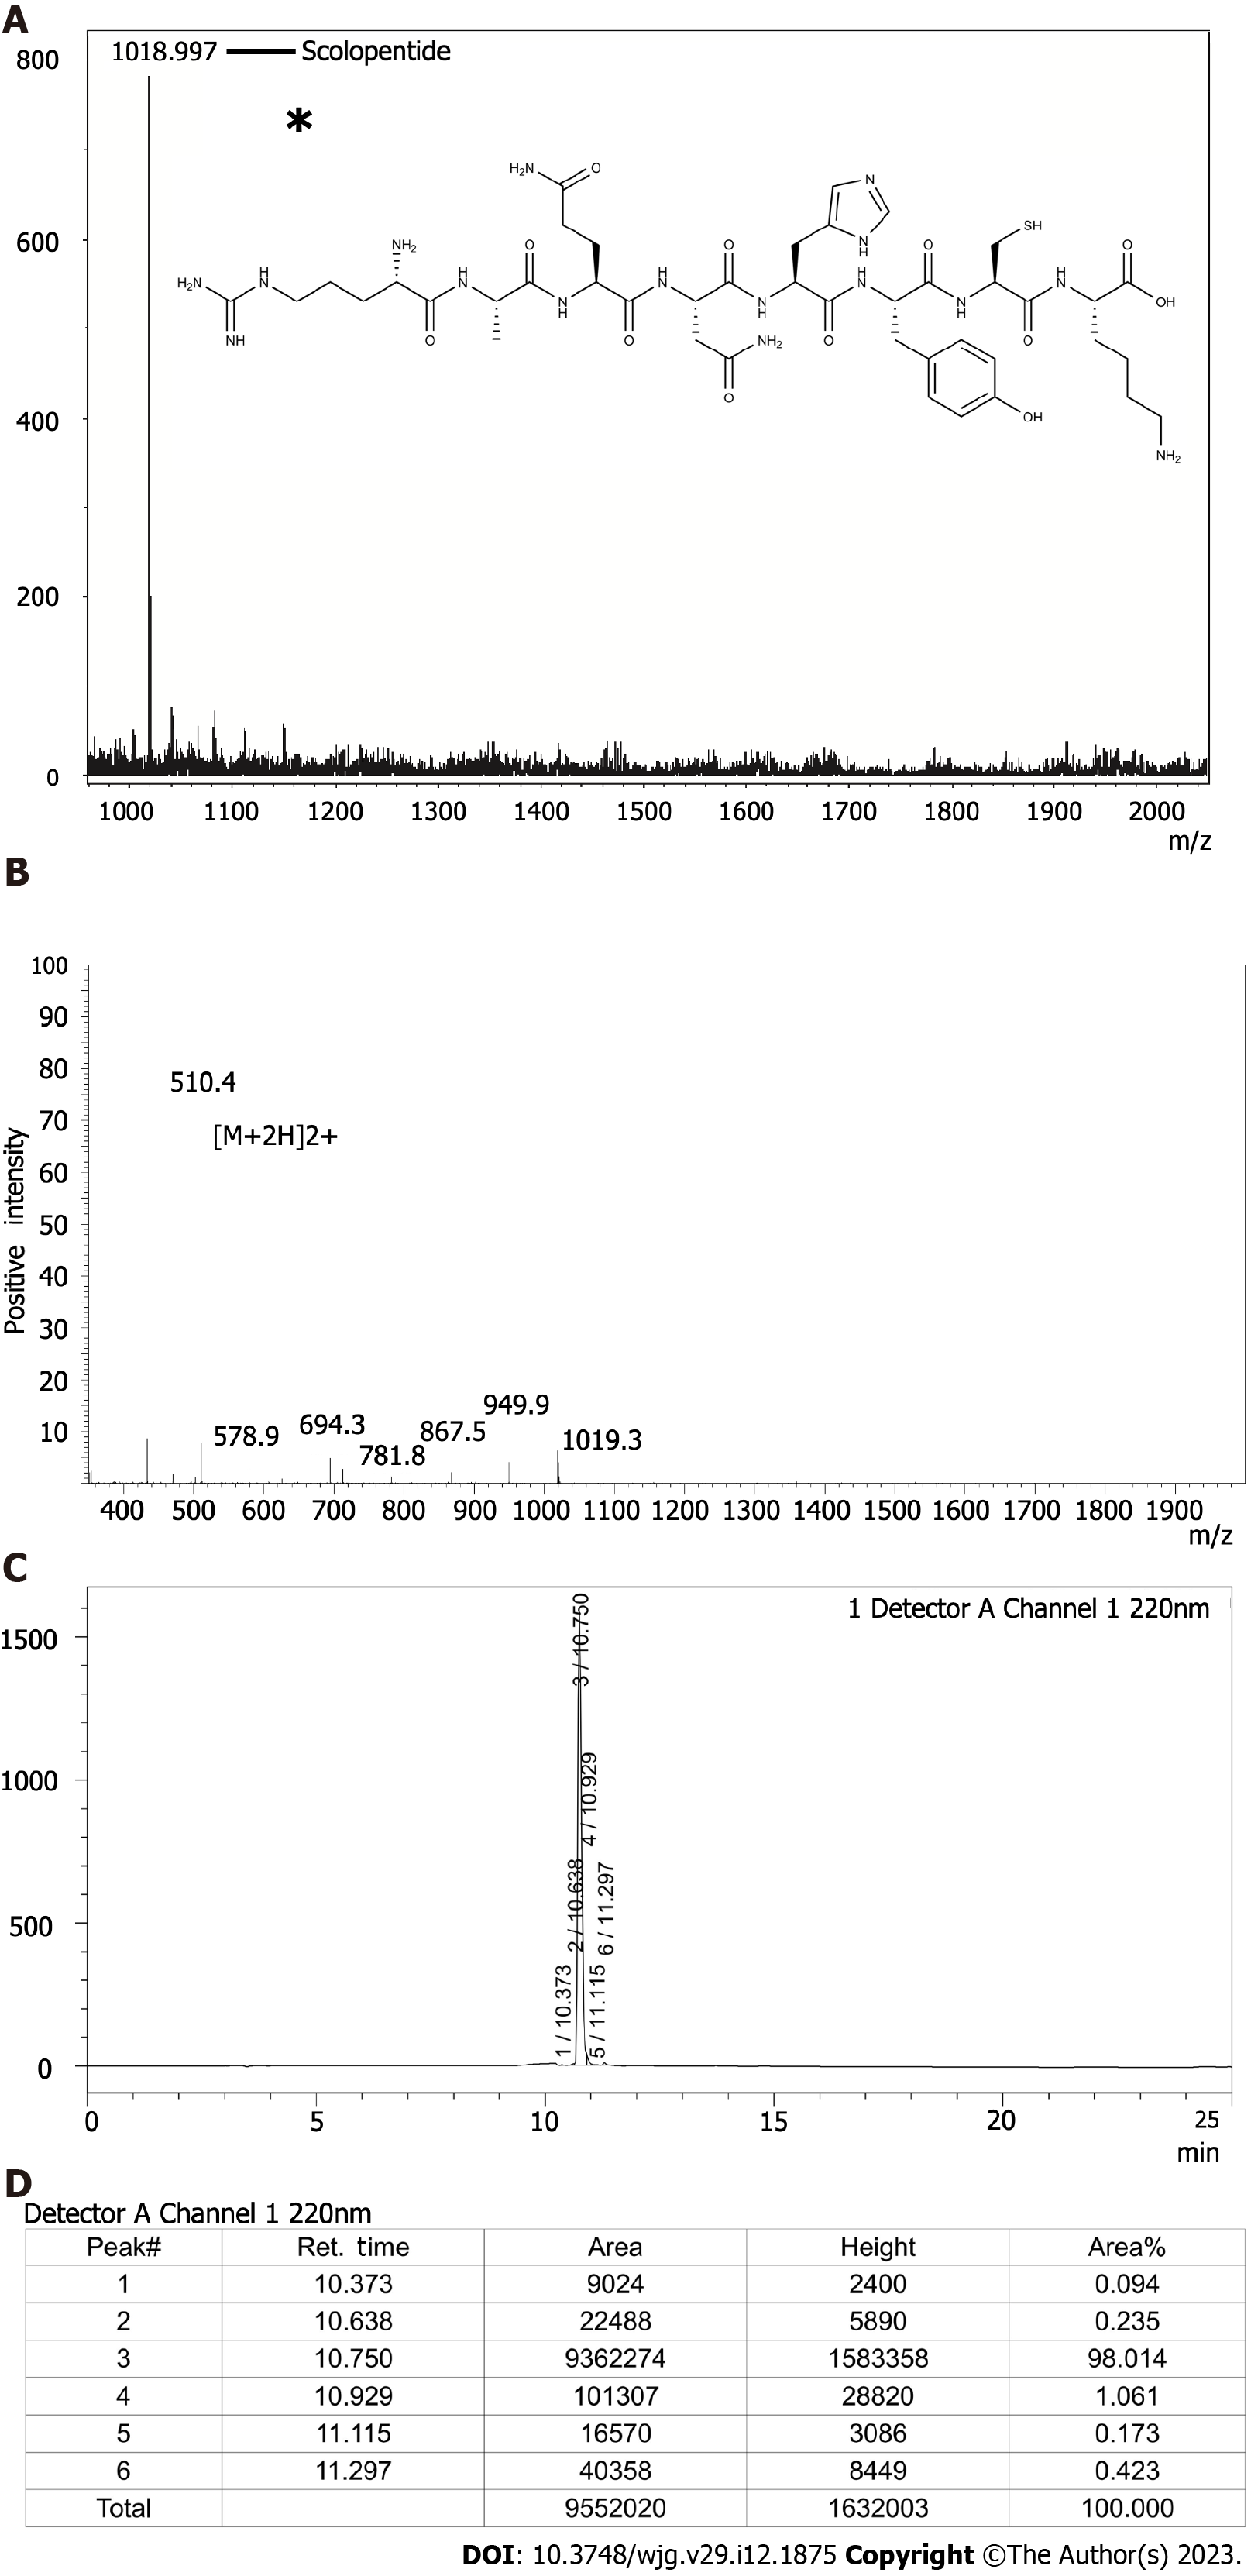
Figure 2 Characterization of extracted scolopentide and detection of synthetic scolopentide.
A: Mass spectrum of extracted scolopentide; the highest peak indicates the active peptide (scolopentide). The observed molecular weight was 1018.997 Da; the asterisk “*” means molecular structure of scolopentide; B: Mass spectrum of synthetic scolopentide. The observed molecular weight was 1018.8 Da; C and D: HPLC chromatogram of synthetic scolopentide (C); the highest peak (peak 3) indicates the active peptide, and the area % of peak 3 indicates the purity of synthetic scolopentide (98.014%) (D).
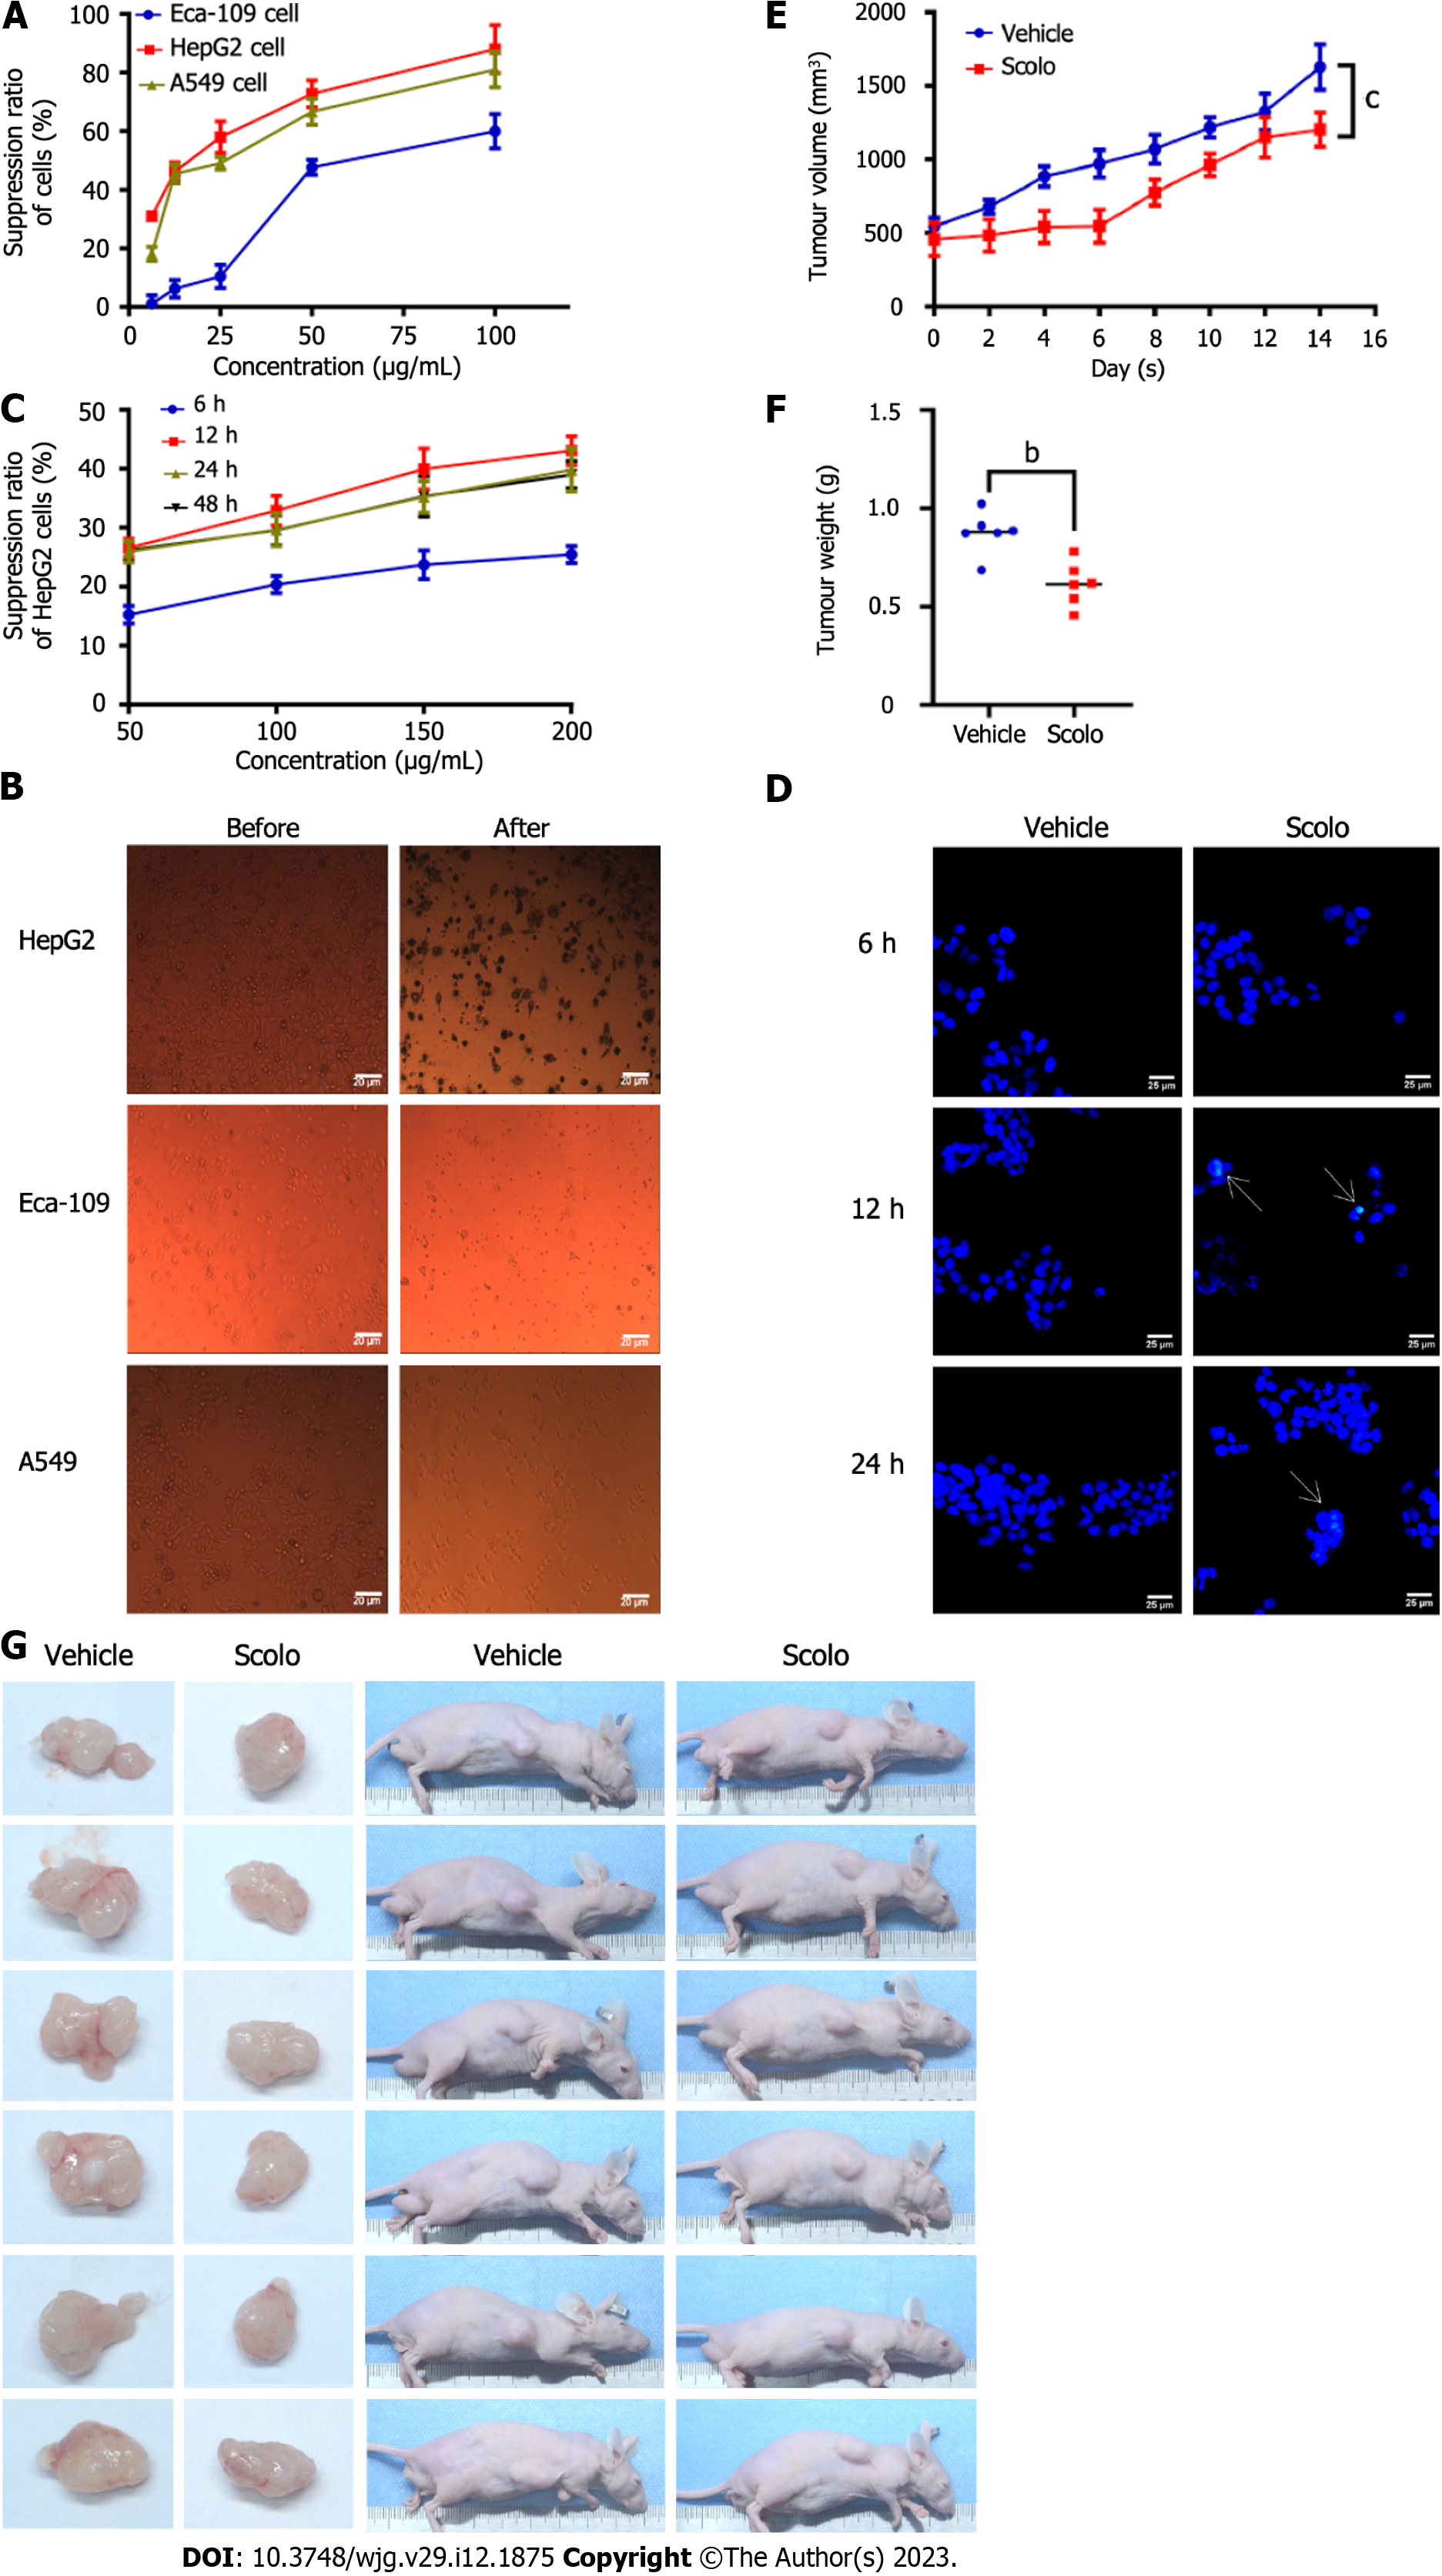
Figure 3 Antihepatoma effect of scolopentide.
A: The CCK8 assay showed the suppression ratio of Eca-109, HepG2, and A549 cells treated with extracted scolopentide at different concentrations; B: Morphological changes in Eca-109, HepG2, and A549 cells under a light microscope (× 40); after treatment with extracted scolopentide, three cells were morphologically changed, especially HepG2 cells; C: The CCK8 assay showed the suppression ratio of HepG2 cells treated with synthetic scolopentide at different times (6 h, 12 h, 24 h, and 48 h) and different concentrations (50 μg/mL, 100 μg/mL, 150 μg/mL, and 200 μg/mL); D: Hoechst 33342 staining (× 400) of HepG2 cells. After treatment with synthetic scolopentide for 12 h and 24 h, cytoplasmic highlight staining and nuclear pyknosis occurred; E-G: Tumor volume and weight of the scolopentide group (synthetic scolopentide 500 mg/kg/d) and vehicle group (constant volume of normal saline). n = 6, bP < 0.01, cP < 0.001.
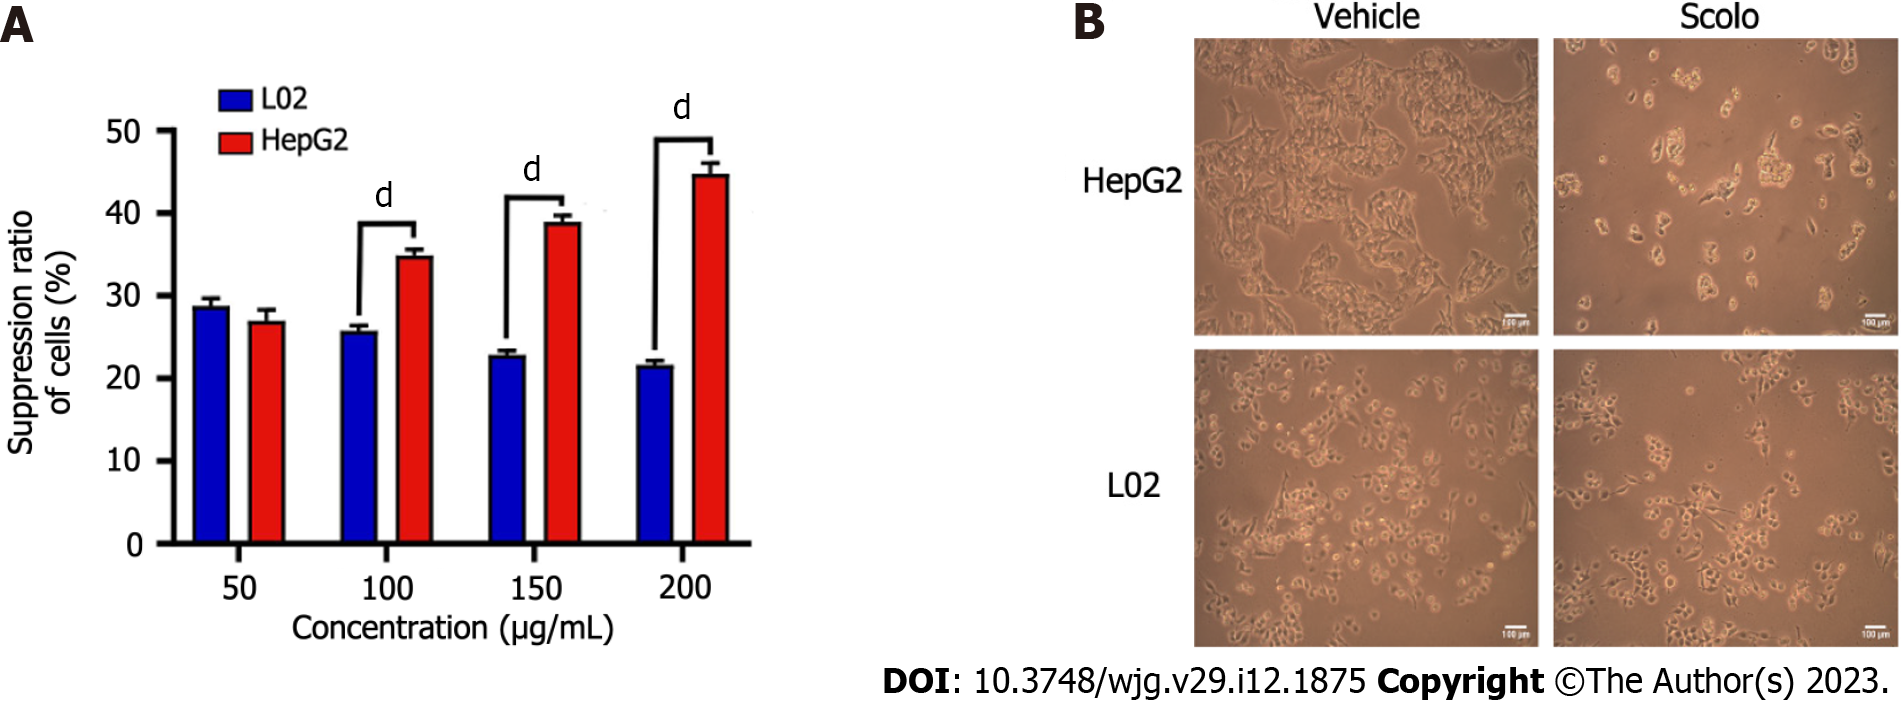
Figure 4 Cytotoxicity of synthetic scolopentide to L02 cells and HepG2 cells.
A: The CCK8 assay showed that cytotoxicity to L02 cells was significantly lower than that to HepG2 cells after treatment with synthetic scolopentide for 12 h (100 μg/mL, 150 μg/mL, and 200 μg/mL); B: Morphological changes in HepG2 and L02 cells under a light microscope after treatment with synthetic scolopentide for 12 h (× 100). Compared to cells in the vehicle group (0 μg/mL), most HepG2 cells in the scolopentide group (100 μg/mL) died, while some L02 cells survived. dP < 0.0001.
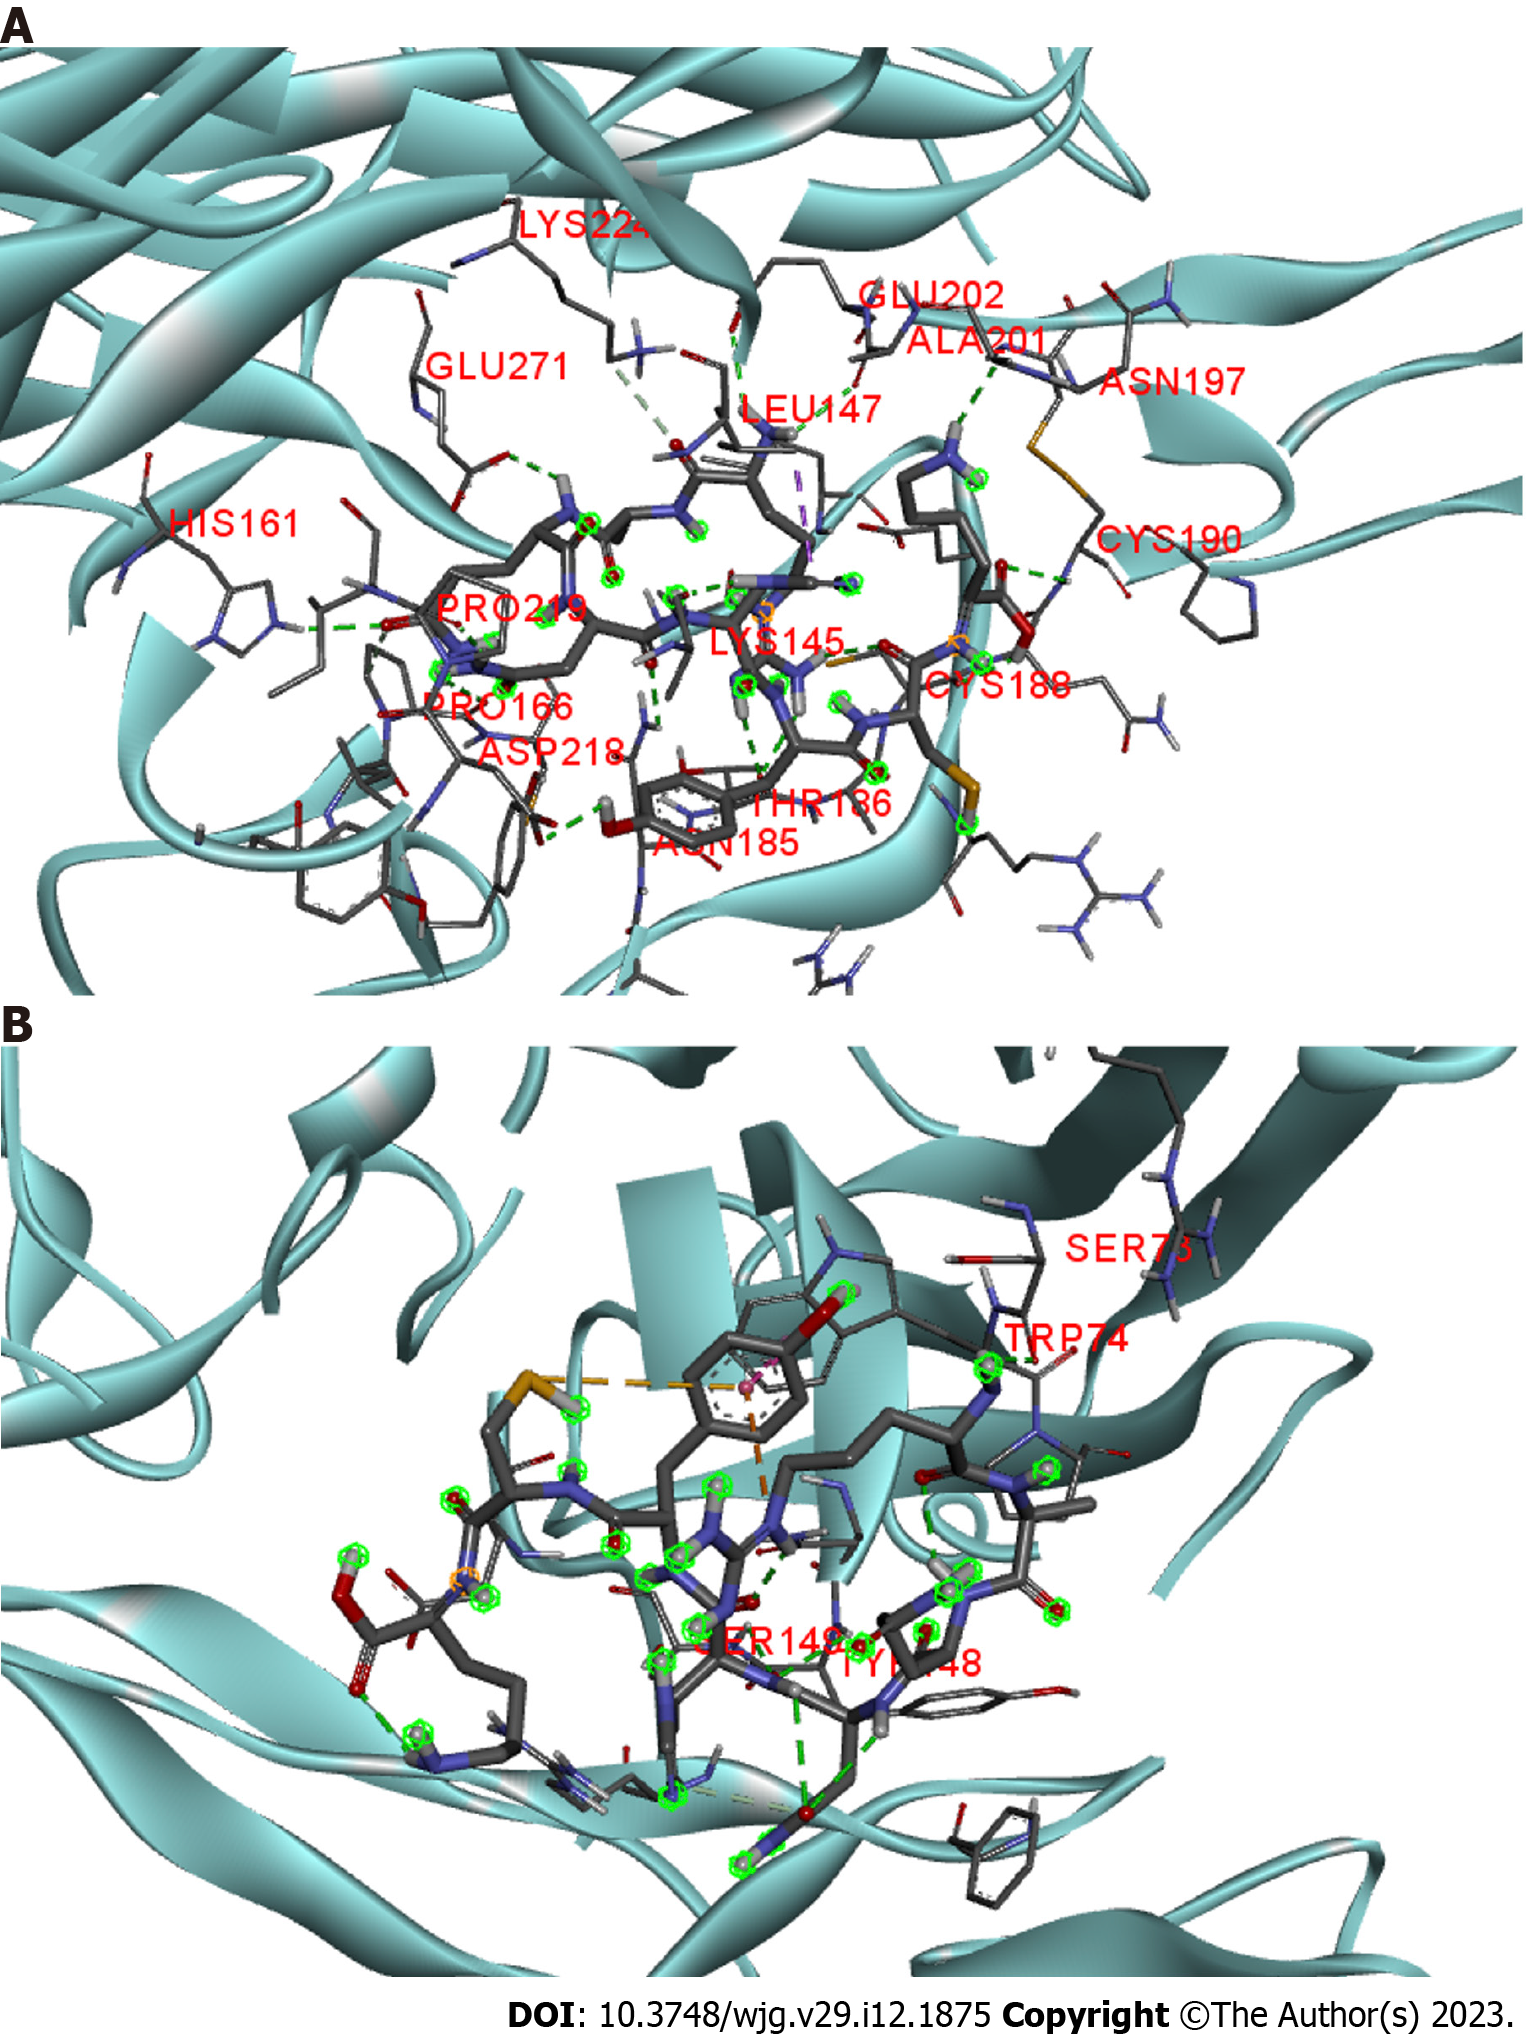
Figure 5 Molecular docking of scolopentide and death receptor 4 and death receptor 5.
A: Stereograms of the molecular docking of scolopentide and death receptor 4. Hydrogen bonds formed with amino acid residues of the receptor include LYS145, ALA201, PRO219, and CYS190; B: Stereograms of molecular docking of scolopentide and death receptor 5. Hydrogen bonds formed with amino acid residues of the receptor are TRP74, SER73, ER149, and TYR148.
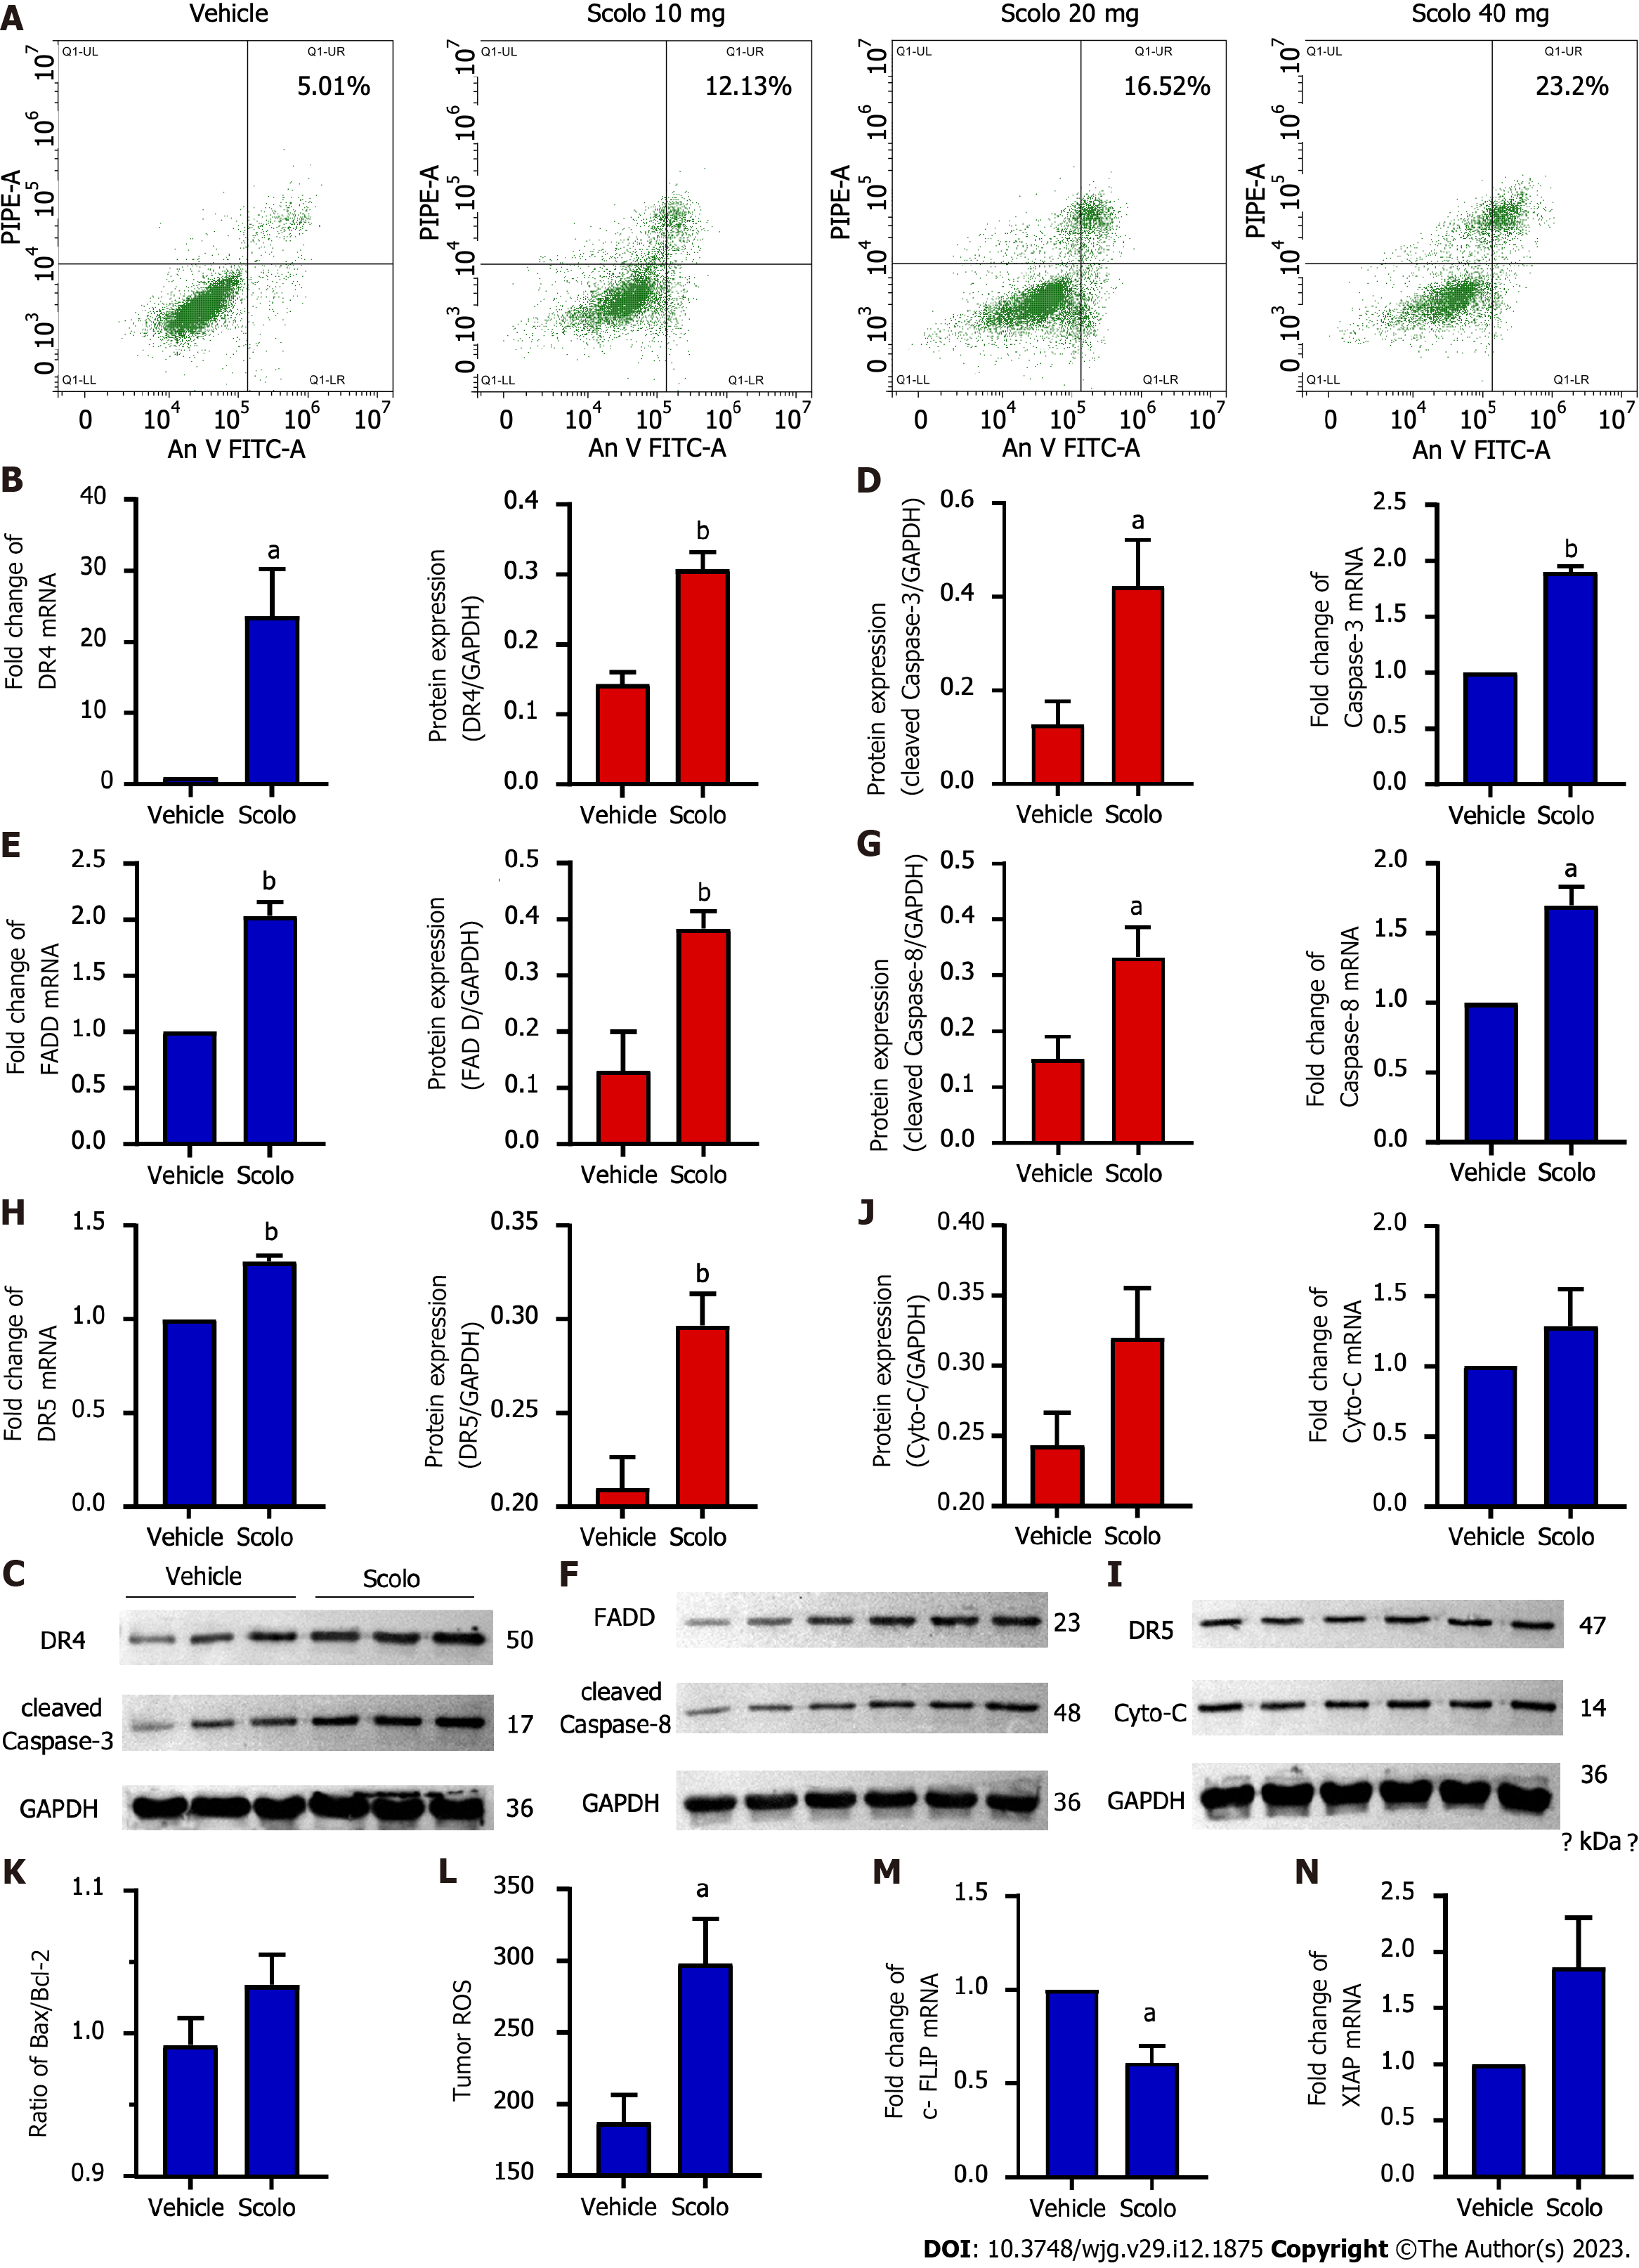
Figure 6 Antihepatoma mechanism of scolopentide.
A: Flow cytometry suggested that apoptosis occurred in HepG2 cells after treatment with extracted scolopentide in vitro. B-I: Quantitative real-time polymerase chain reaction (qRT-PCR) and western blotting showed that the expression of DR4 (B and C), DR5 (H and I), FADD (E and F), caspase-8 (F and G), and caspase-3 (C and D) was significantly upregulated in the scolopentide group. DR4 was the most considerably upregulated; I-K: qRT-PCR and western blotting showed that the expression of Cyto-C (I and J) and Bax/Bcl-2 (K) was not upregulated, which are key indicators of mitochondria dependence; L: Tumor ROS levels in the scolopentide group were higher than those in the vehicle group; M: c-FLIP, an inhibitory protein of caspase-8, was significantly downregulated in qRT-PCR; N: XIAP, an inhibitory protein of caspase-3, was insignificantly upregulated in qRT-PCR. DR4: Death receptor 4; DR5: Death receptor 5; FADD: Fas-associated death domain protein. n = 4 per group in qRT-PCR, n = 3 per group in Western blotting, n = 4 per group in ROS; aP < 0.05, bP < 0.01.
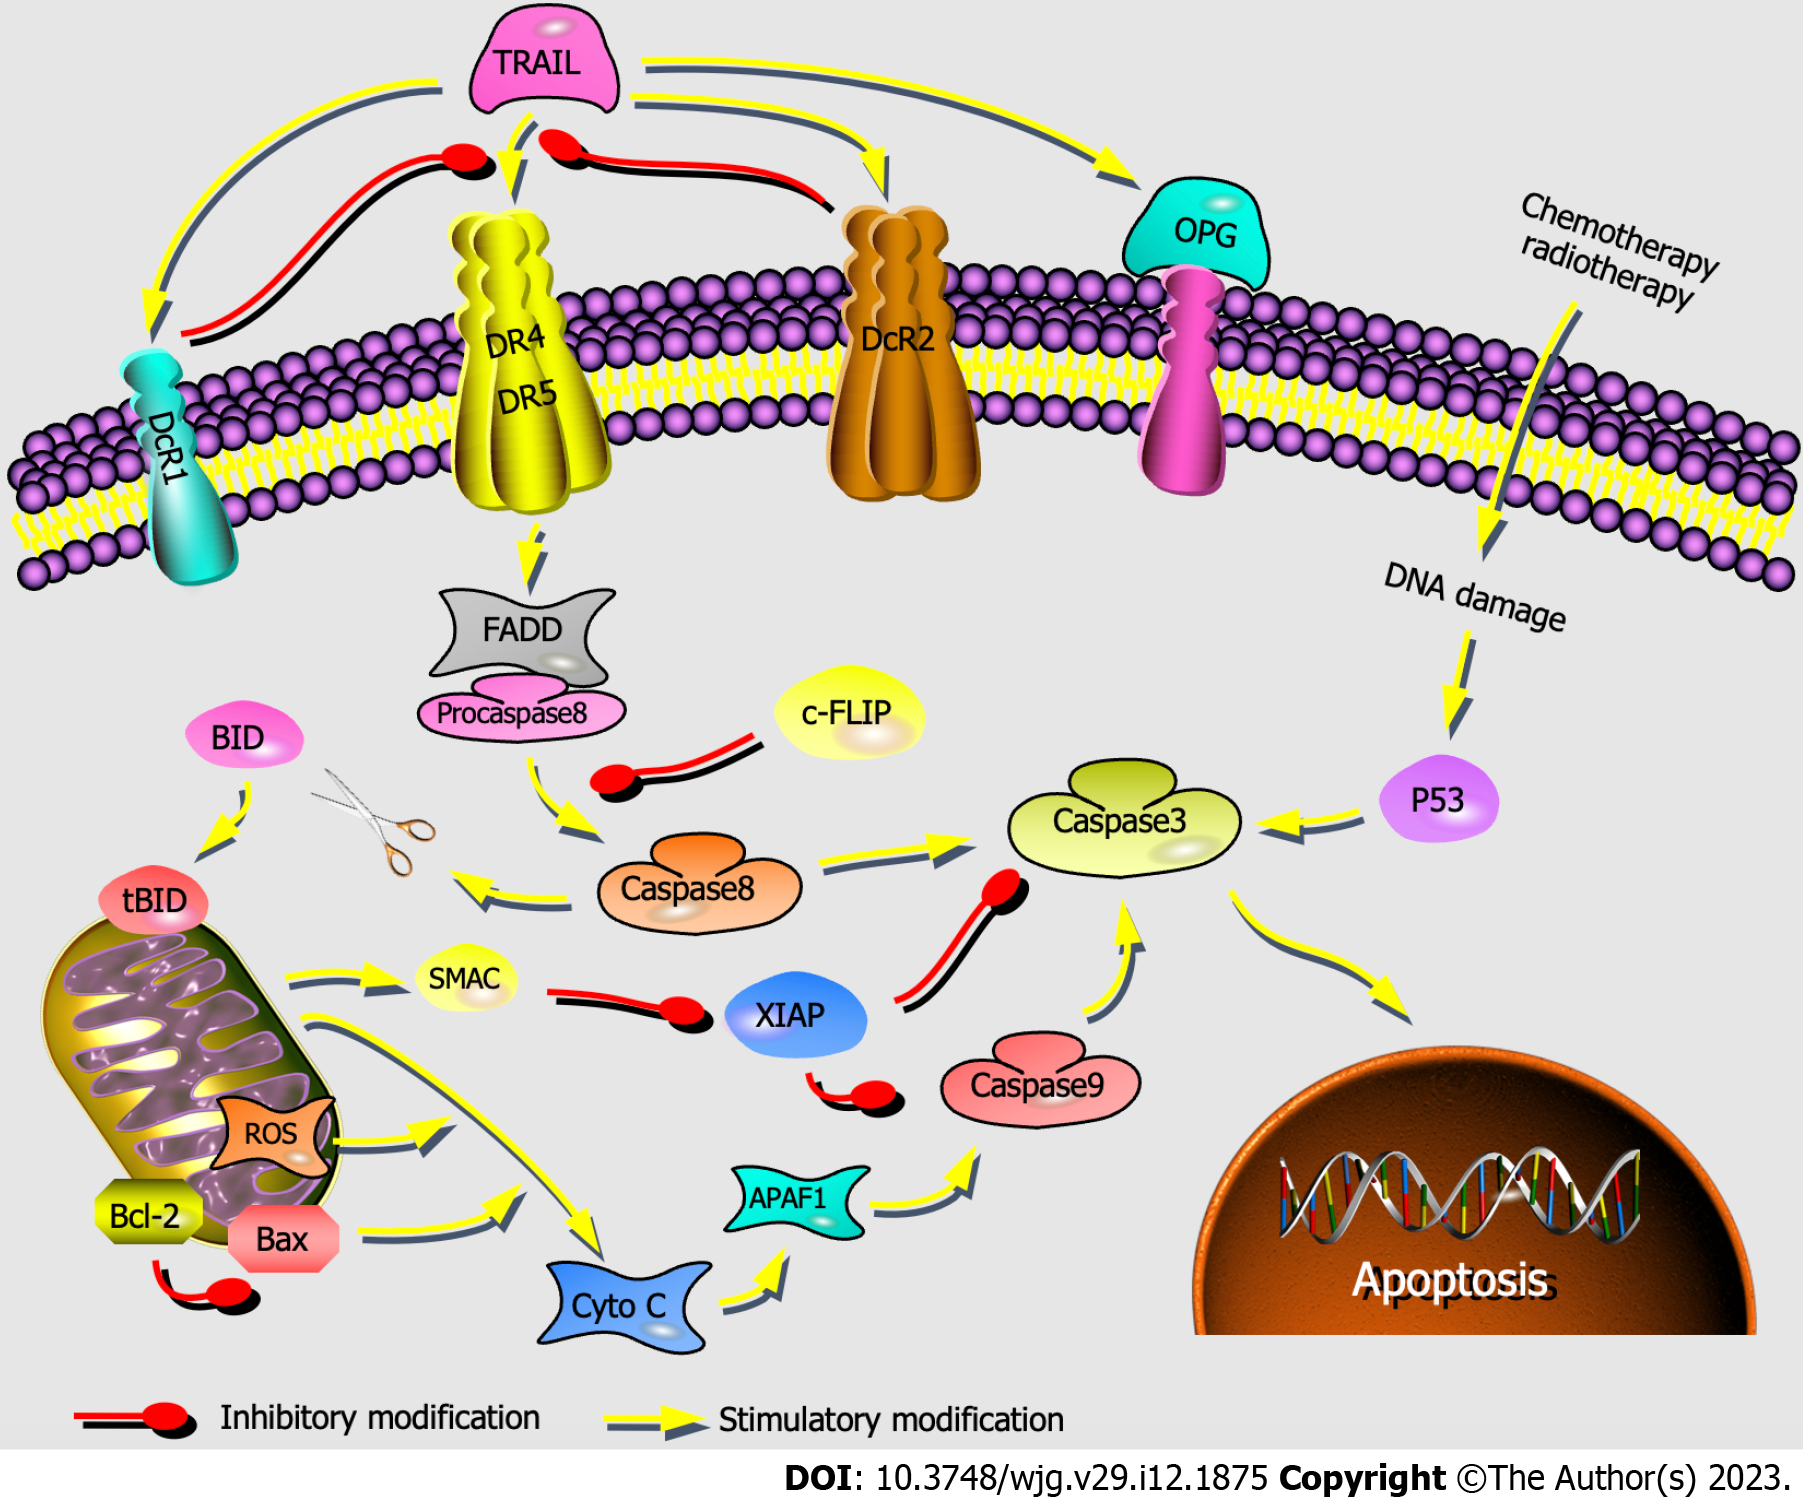
Figure 7 Activation of the mitochondria-independent and mitochondria-dependent apoptosis pathways by tumor necrosis factor-related apoptosis-inducing ligand.
The mitochondria-independent pathway (engaged through death receptors, activated caspase family directly) and mitochondria-dependent pathway (triggered through the Bcl-2 gene superfamily) are represented. TRAIL: Tumor necrosis factor-related apoptosis-inducing ligand; DR4: Death receptor 4; DR5: Death receptor 5; FADD: Fas-associated death domain protein; Cyto-C: Cytochrome c; Bax: Bcl-2-associated X protein; Bcl-2: B-cell lymphoma-2; ROS: Reactive oxygen species; c-FLIP: Cellular Fas associated death domain-like interleukin-1β converting enzyme inhibitory protein; XIAP: X-chromosome linked inhibitor-of-apoptosis protein.
- Citation: Hu YX, Liu Z, Zhang Z, Deng Z, Huang Z, Feng T, Zhou QH, Mei S, Yi C, Zhou Q, Zeng PH, Pei G, Tian S, Tian XF. Antihepatoma peptide, scolopentide, derived from the centipede scolopendra subspinipes mutilans. World J Gastroenterol 2023; 29(12): 1875-1898
- URL: https://www.wjgnet.com/1007-9327/full/v29/i12/1875.htm
- DOI: https://dx.doi.org/10.3748/wjg.v29.i12.1875


