Copyright
©The Author(s) 2023.
World J Gastroenterol. Mar 14, 2023; 29(10): 1602-1613
Published online Mar 14, 2023. doi: 10.3748/wjg.v29.i10.1602
Published online Mar 14, 2023. doi: 10.3748/wjg.v29.i10.1602
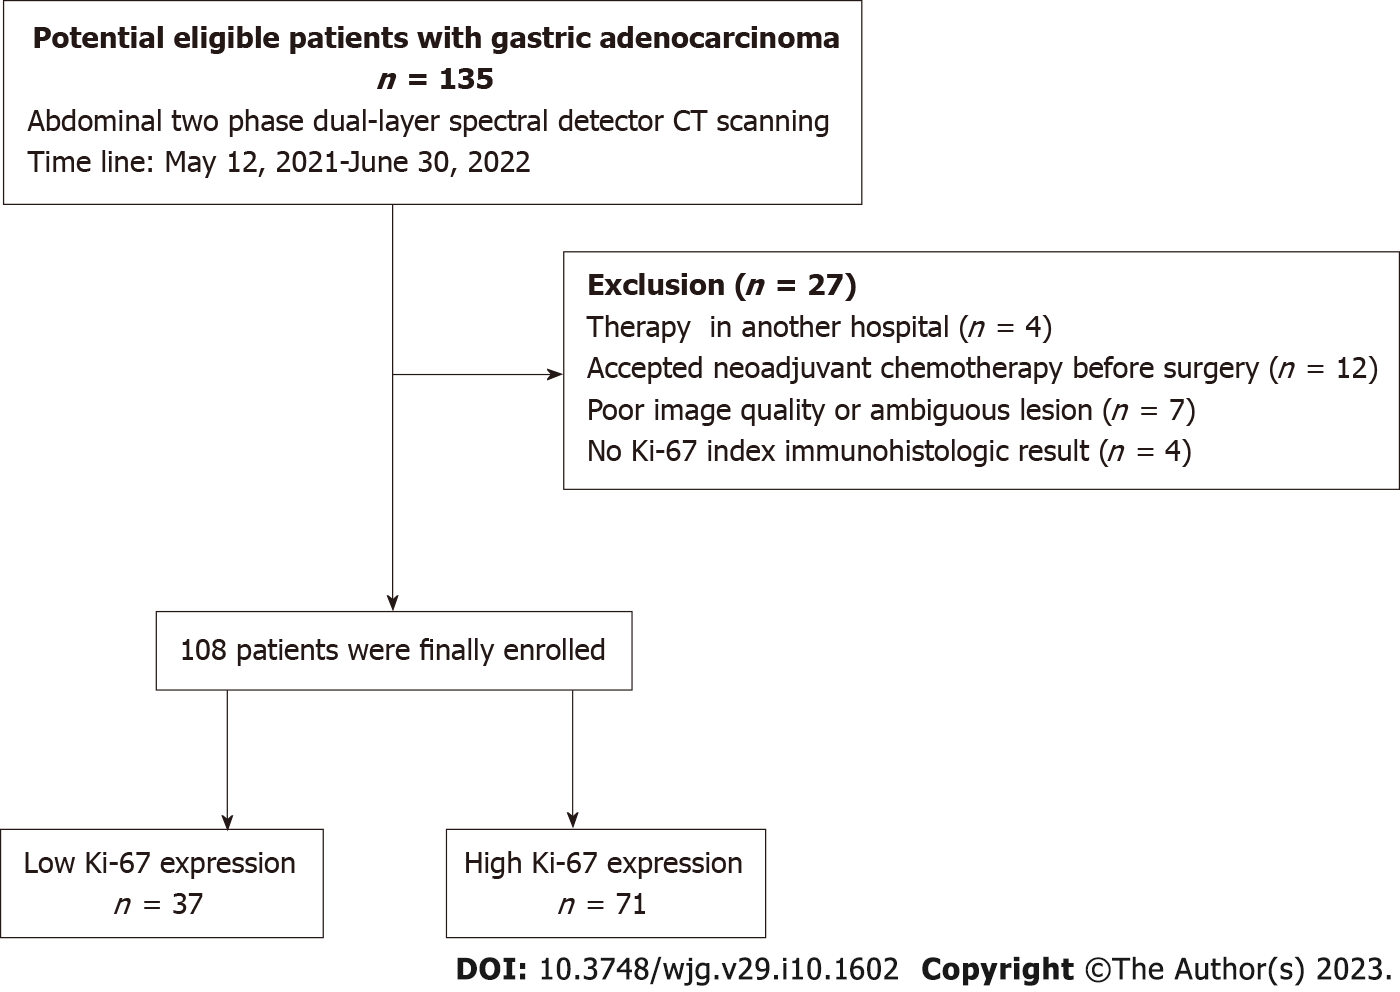
Figure 1 The flow chart of the process of patient selection.
CT: Computed tomography.
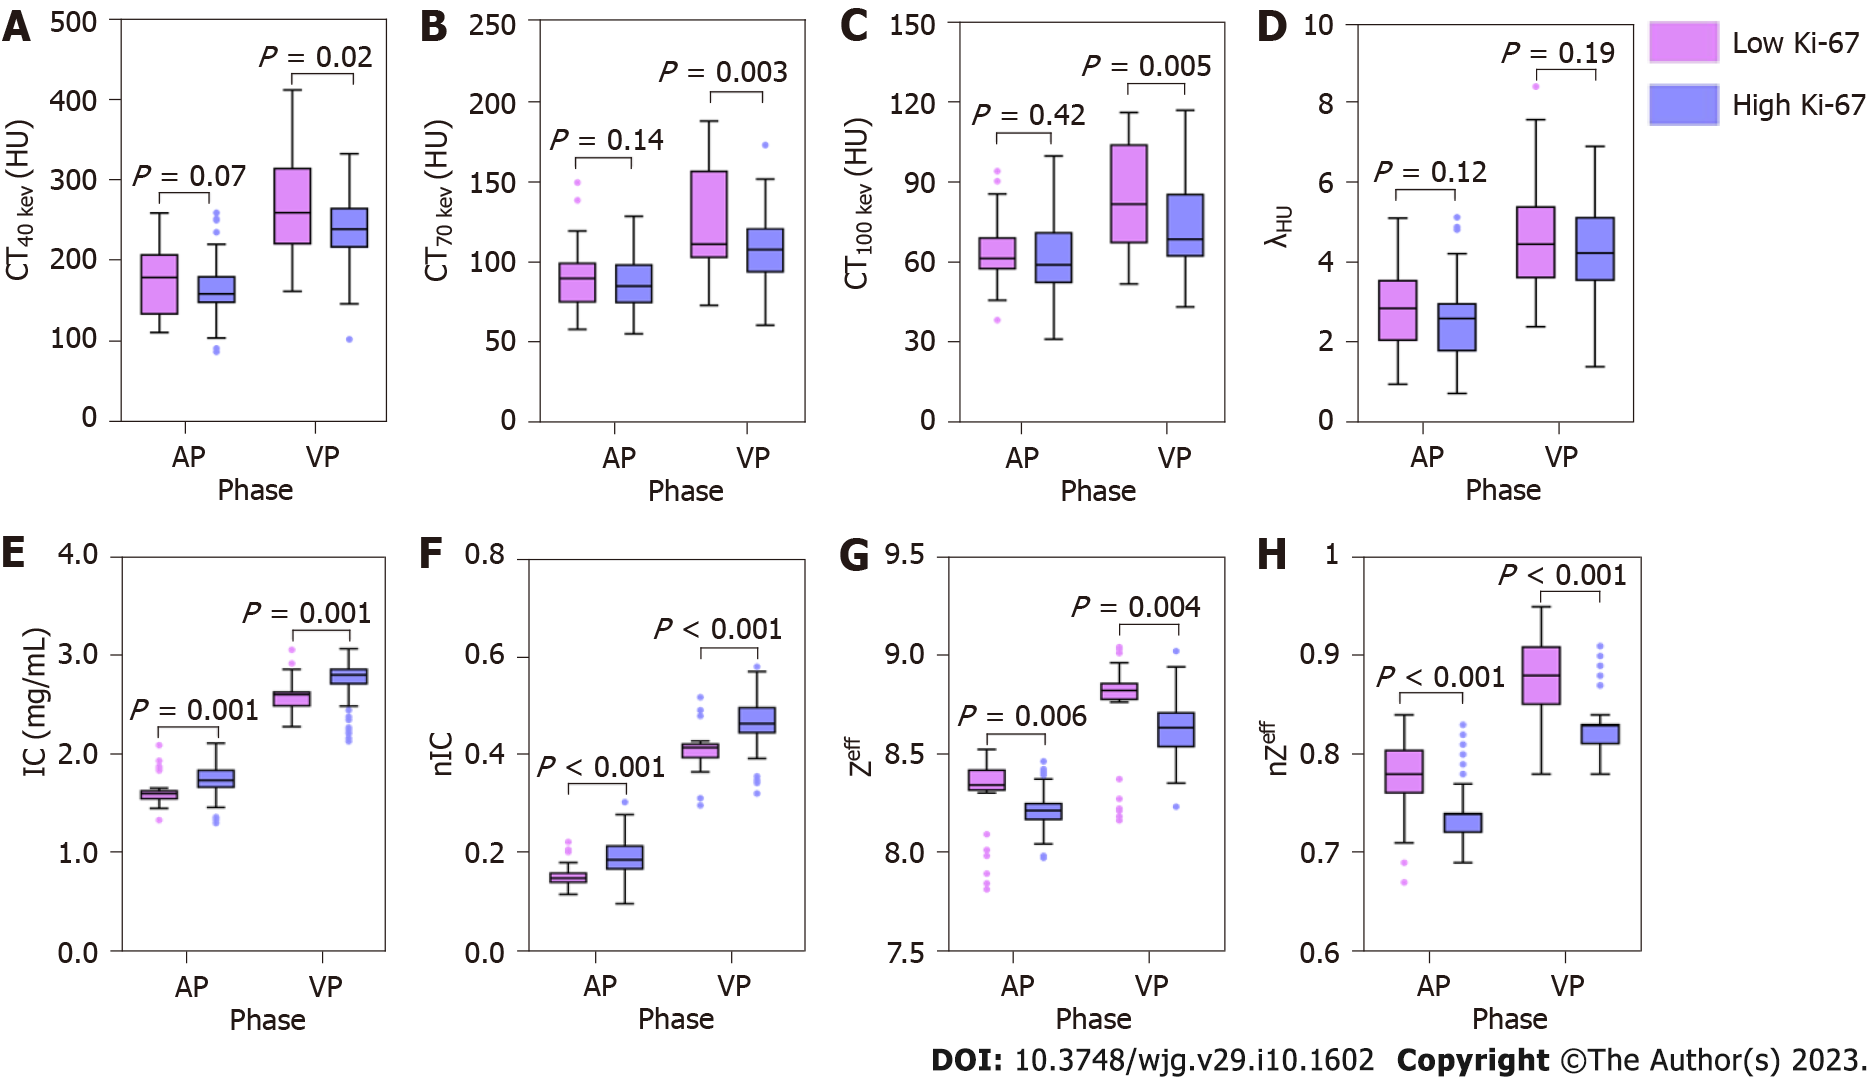
Figure 2 Boxplots showing a comparison between low and high Ki-67 expression status demonstrated by computed tomography attenuation value of 40 kilo electron volt, 70 kilo electron volt, 100 kilo electron volt, slope of the spectral curve, iodine concentration, the normalized iodine concentration, effective atomic number, and normalized effective atomic number in both arterial phase and venous phase.
A: Computed tomography attenuation value of 40 kev; B: Computed tomography attenuation value of 70; C: Computed tomography attenuation value of 100; D: The slope of the spectral curve; E: Iodine concentration; F: The normalized iodine concentration; G: Effective atomic number; H: Normalized effective atomic number. HU: Hounsfield unit; AP: Arterial phase; VP: Venous phase; IC: Iodine concentration; nIC: The normalized iodine concentration; CT40 kev, CT70 kev and CT100 kev: The computed tomography attenuation value of 40 kev, 70 kev and 100 kev monochromatic images; Zeff: Effective atomic number; nZeff: The normalized effective atomic number.
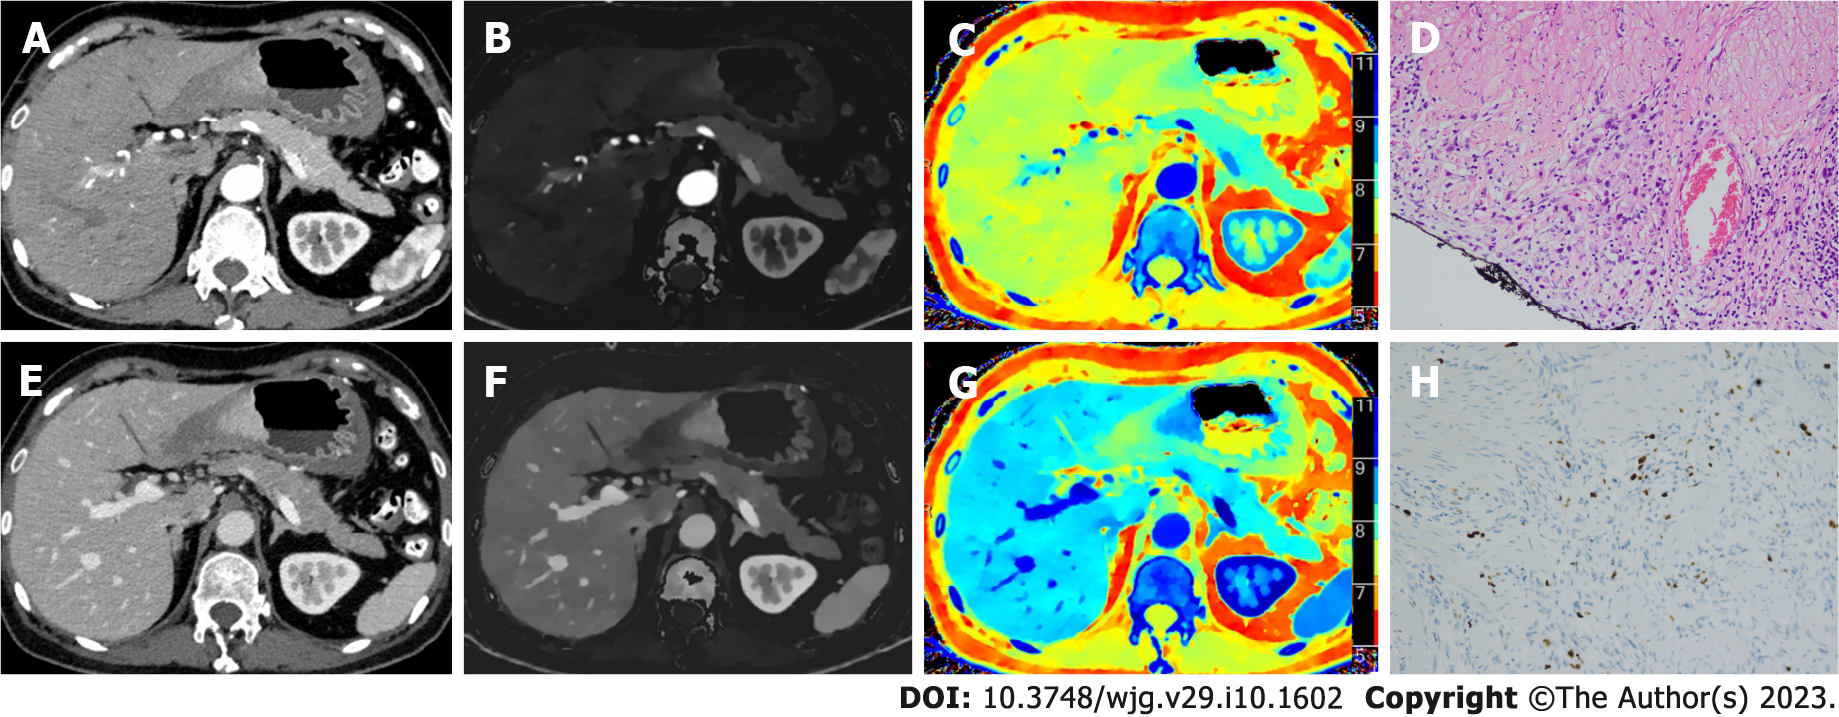
Figure 3 A 57-year-old man with gastric adenocarcinoma in the antrum.
A: The 70 kilo electron volt (kev) image in arterial phase (AP) show that the computed tomography attenuation value of 70 kev (CT70 kev) value of solid mass is 128.8 HU; B: The iodine map in AP show that the iodine concentration (IC) value of solid mass is 3.44 mg/mL; C: The effective atomic map in AP show that the effective atomic number (Zeff) value of solid mass is 8.25; D: Histologic specimen shows a gastric adenocarcinoma of T4 staging in solid with HE staining (magnification, × 200); E: A 70 kev image in venous phase (VP) show that the CT70kev value of solid mass is 146.9 HU; F: An iodine map in VP show that the IC value of solid mass is 3.32 mg/mL; G: An effective atomic map in VP show that the Zeff value of solid mass is 8.65; H: Ki-67 immunohistochemical staining demonstrated that approximately 80% of cells were positive for nuclear staining (magnification, × 400).
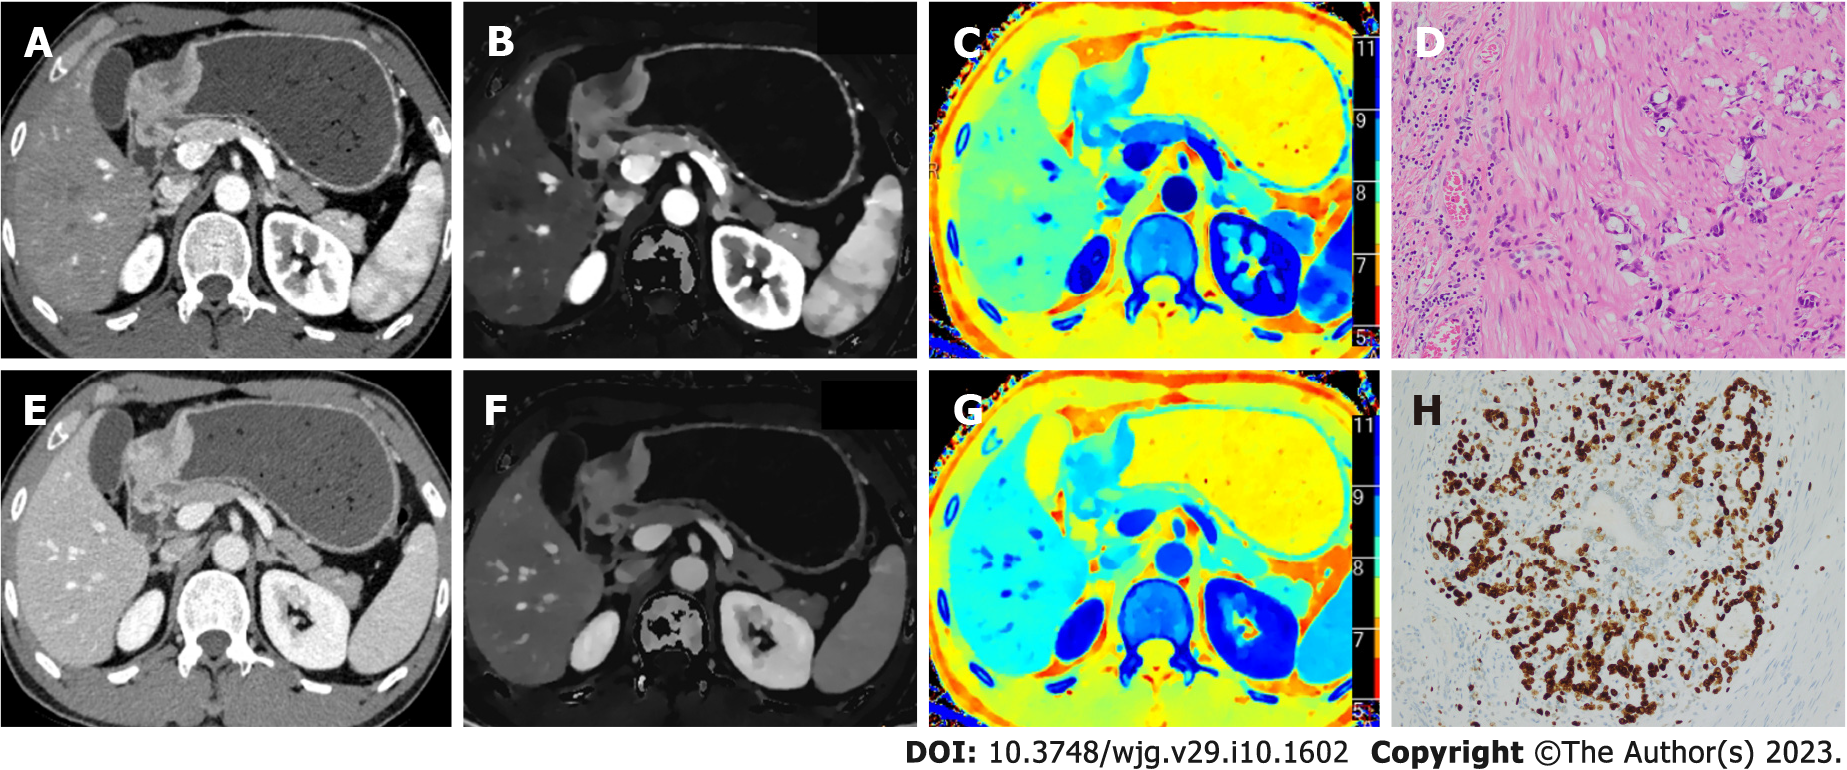
Figure 4 A 65-year-old woman with gastric adenocarcinoma in the gastric angle.
A: The 70 kilo electron volt (kev) image in arterial phase (AP) show that the computed tomography attenuation value of 70 kev (CT70 kev) value of solid mass is 79.6 HU; B: The iodine map in AP show that the iodine concentration (IC) value of solid mass is 1.38 mg/mL; C: The effective atomic map in AP show that the effective atomic number (Zeff) value of solid mass is 8.36; D: Histologic specimen shows a gastric adenocarcinoma of T4 staging in solid with HE staining (magnification, × 200); E: A 70 kev image in venous phase (VP) show that the CT70 kev value of solid mass is 158.3 HU; F: An iodine map in VP show that the IC value of solid mass is 2.52 mg/mL; G: An effective atomic map in VP show that the Zeff value of solid mass is 9.07; H: Ki-67 immunohistochemical staining demonstrated that approximately 40% of cells were positive for nuclear staining (magnification, × 400).
- Citation: Mao LT, Chen WC, Lu JY, Zhang HL, Ye YS, Zhang Y, Liu B, Deng WW, Liu X. Quantitative parameters in novel spectral computed tomography: Assessment of Ki-67 expression in patients with gastric adenocarcinoma. World J Gastroenterol 2023; 29(10): 1602-1613
- URL: https://www.wjgnet.com/1007-9327/full/v29/i10/1602.htm
- DOI: https://dx.doi.org/10.3748/wjg.v29.i10.1602


