Copyright
©The Author(s) 2023.
World J Gastroenterol. Jan 7, 2023; 29(1): 171-189
Published online Jan 7, 2023. doi: 10.3748/wjg.v29.i1.171
Published online Jan 7, 2023. doi: 10.3748/wjg.v29.i1.171
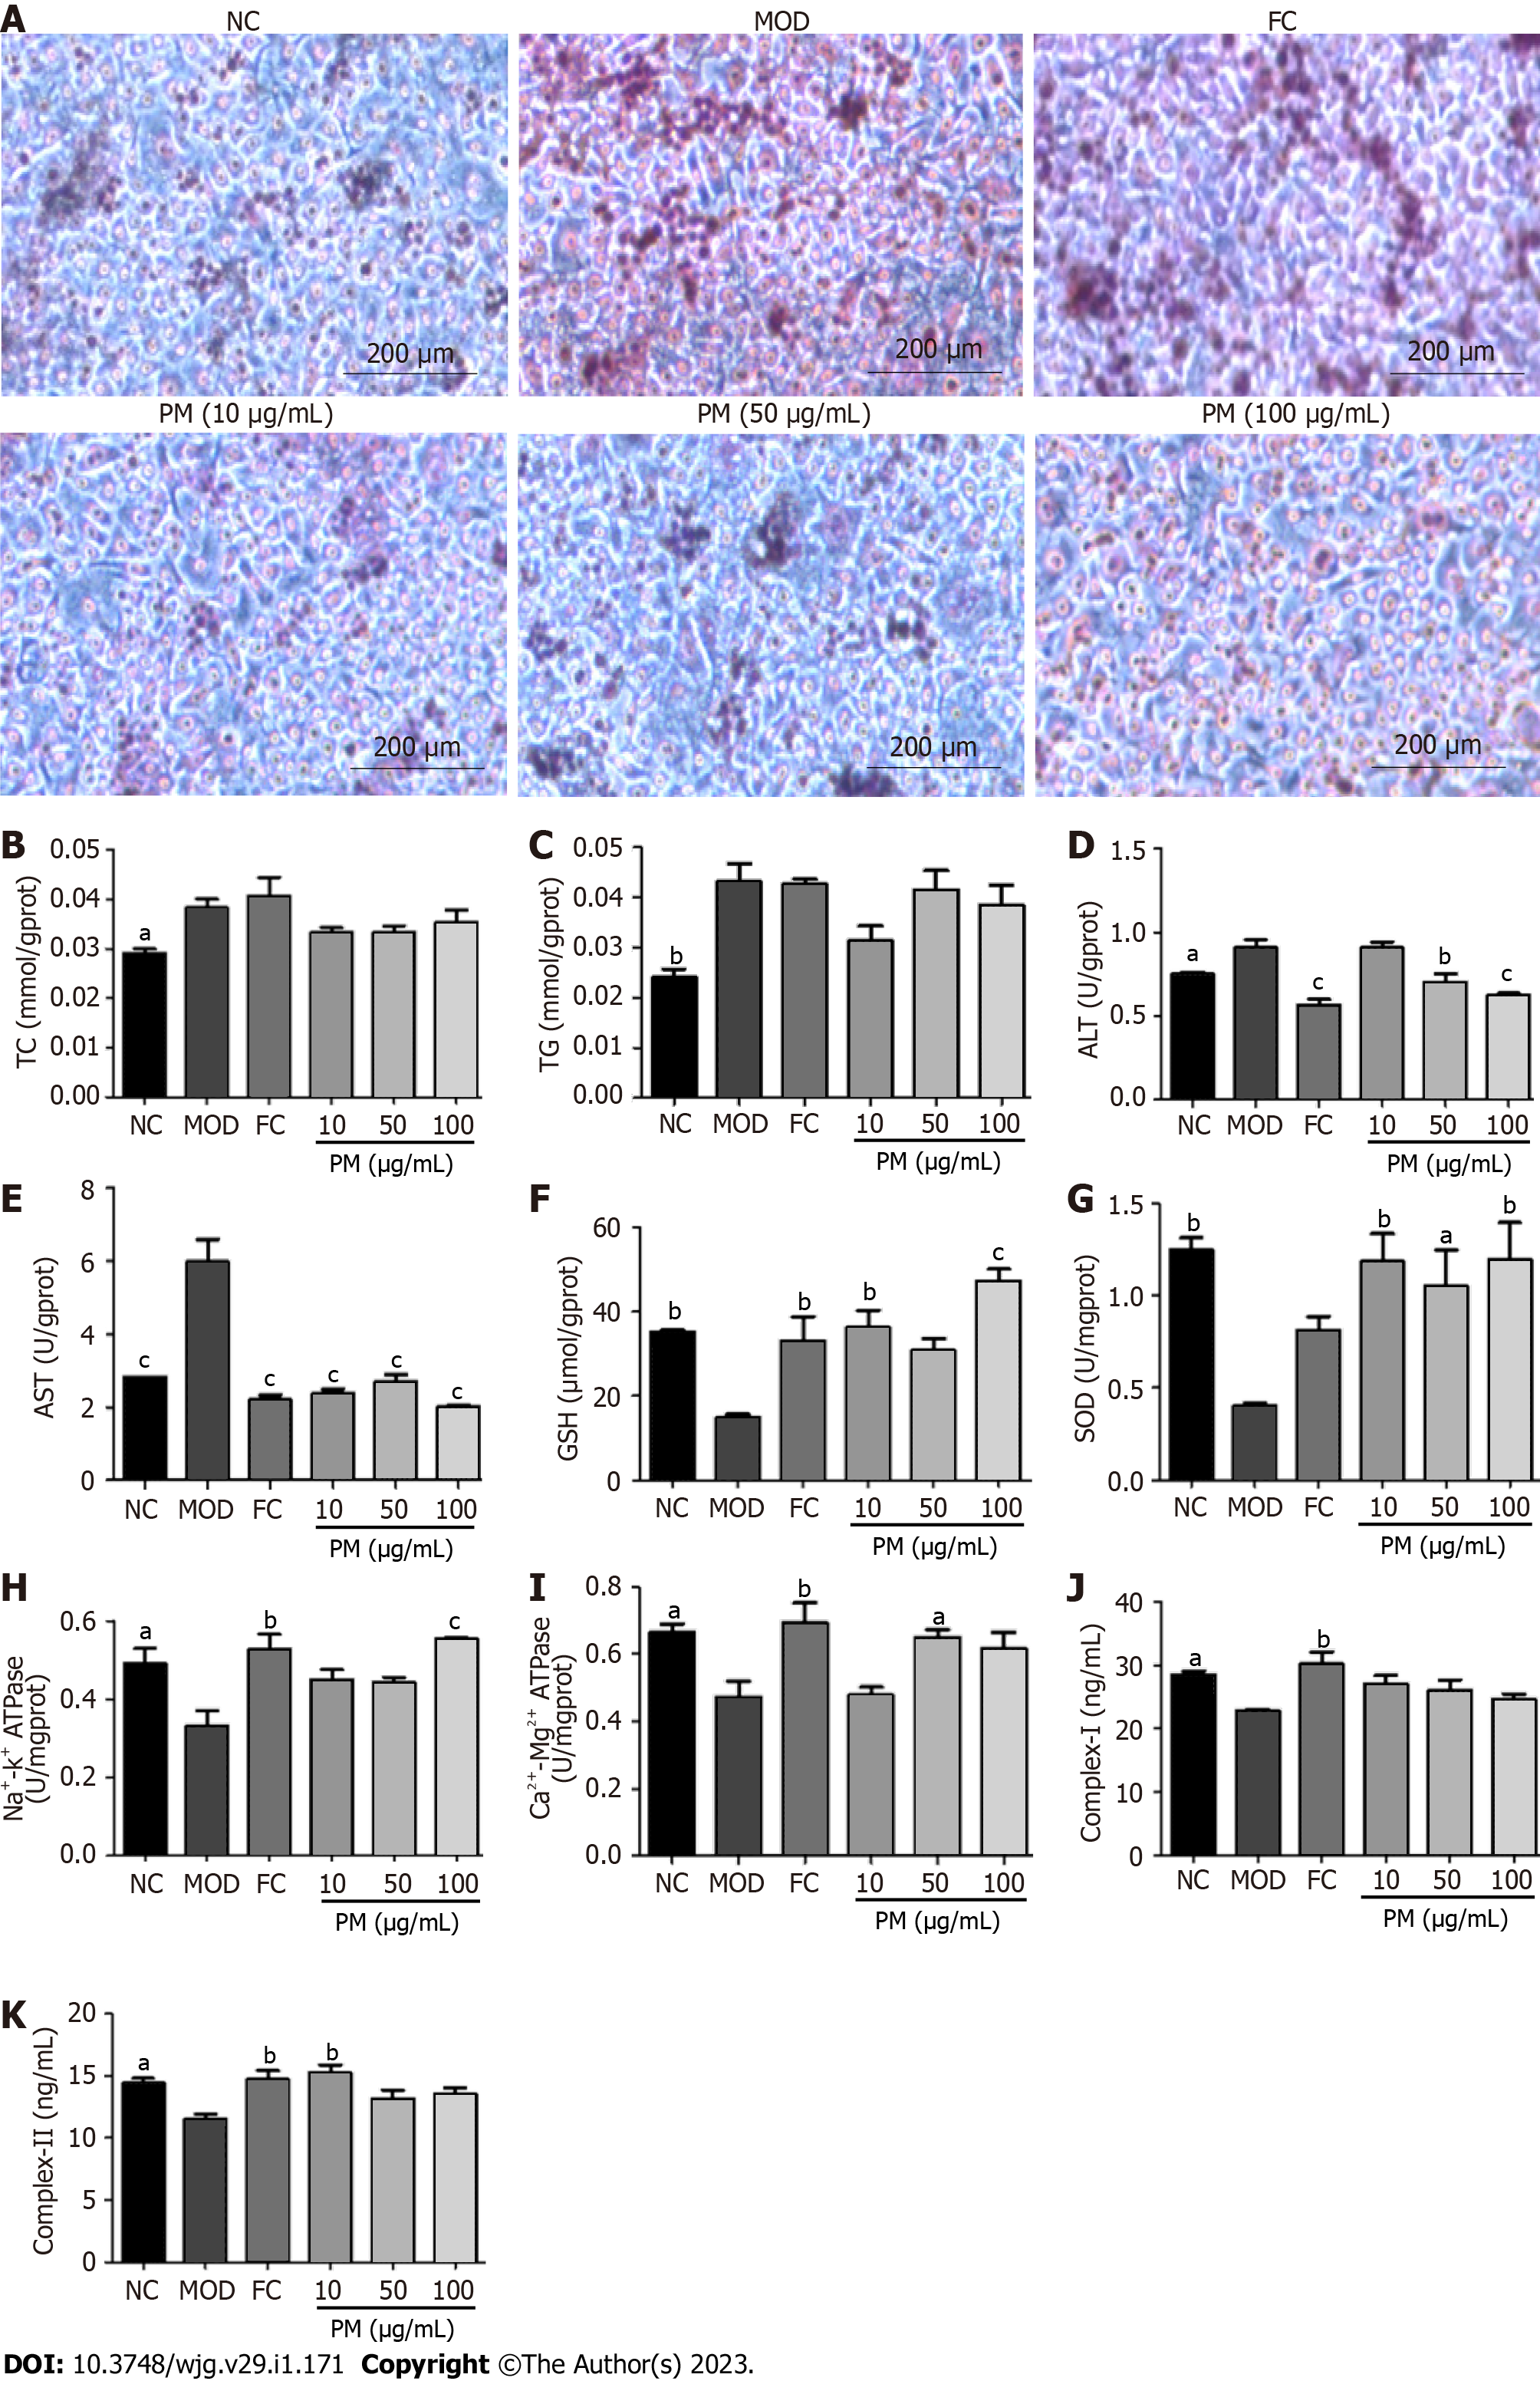
Figure 1 Effects of Polygonum multiflorum extract on L02 adipocytes induced by fat emulsion.
A: L02 cells were treated with 5% fat emulsion for 24 h followed by Polygonum multiflorum extract (10, 50, and 100 μg/mL) or fenofibrate capsules (150 μmol/L) for 24 h. Cells were harvested, and fat accumulation in cells was detected under a light microscope (× 200) after Oil red O staining; B: Levels of total cholesterol was determined using commercial kits; C: Levels of triglyceride was determined using a commercial kit; D: Levels of alanine transaminase were determined using a commercial kit; E: Levels of aspartate transaminase were determined using a commercial kit; F: Levels of glutathione were determined using a commercial kit; G: Levels of superoxide dismutase were determined using a commercial kit; H: Levels of Na+-K+-ATPase were determined using a commercial kit; I: Levels of Ca2+-Mg2+-ATPase were determined using a commercial kit; J: Levels of complex I were determined using a commercial kit; K: Levels of complex II were determined using a commercial kit. Data were obtained from 3 independent measurements and are expressed as the mean ± SD. aP < 0.05, bP < 0.01, cP < 0.001 vs model group. ALT: Alanine transaminase; AST: Aspartate transaminase; ATPase: ATP synthase; Complex I/II: human mitochondrial respiratory chain complex I/II, FC: Fenofibrate capsules; GSH: Glutathione; MOD: Model; NC: Normal control; PM: Polygonum multiflorum; SOD: Superoxide dismutase; TC: Total cholesterol; TG: Triglyceride.
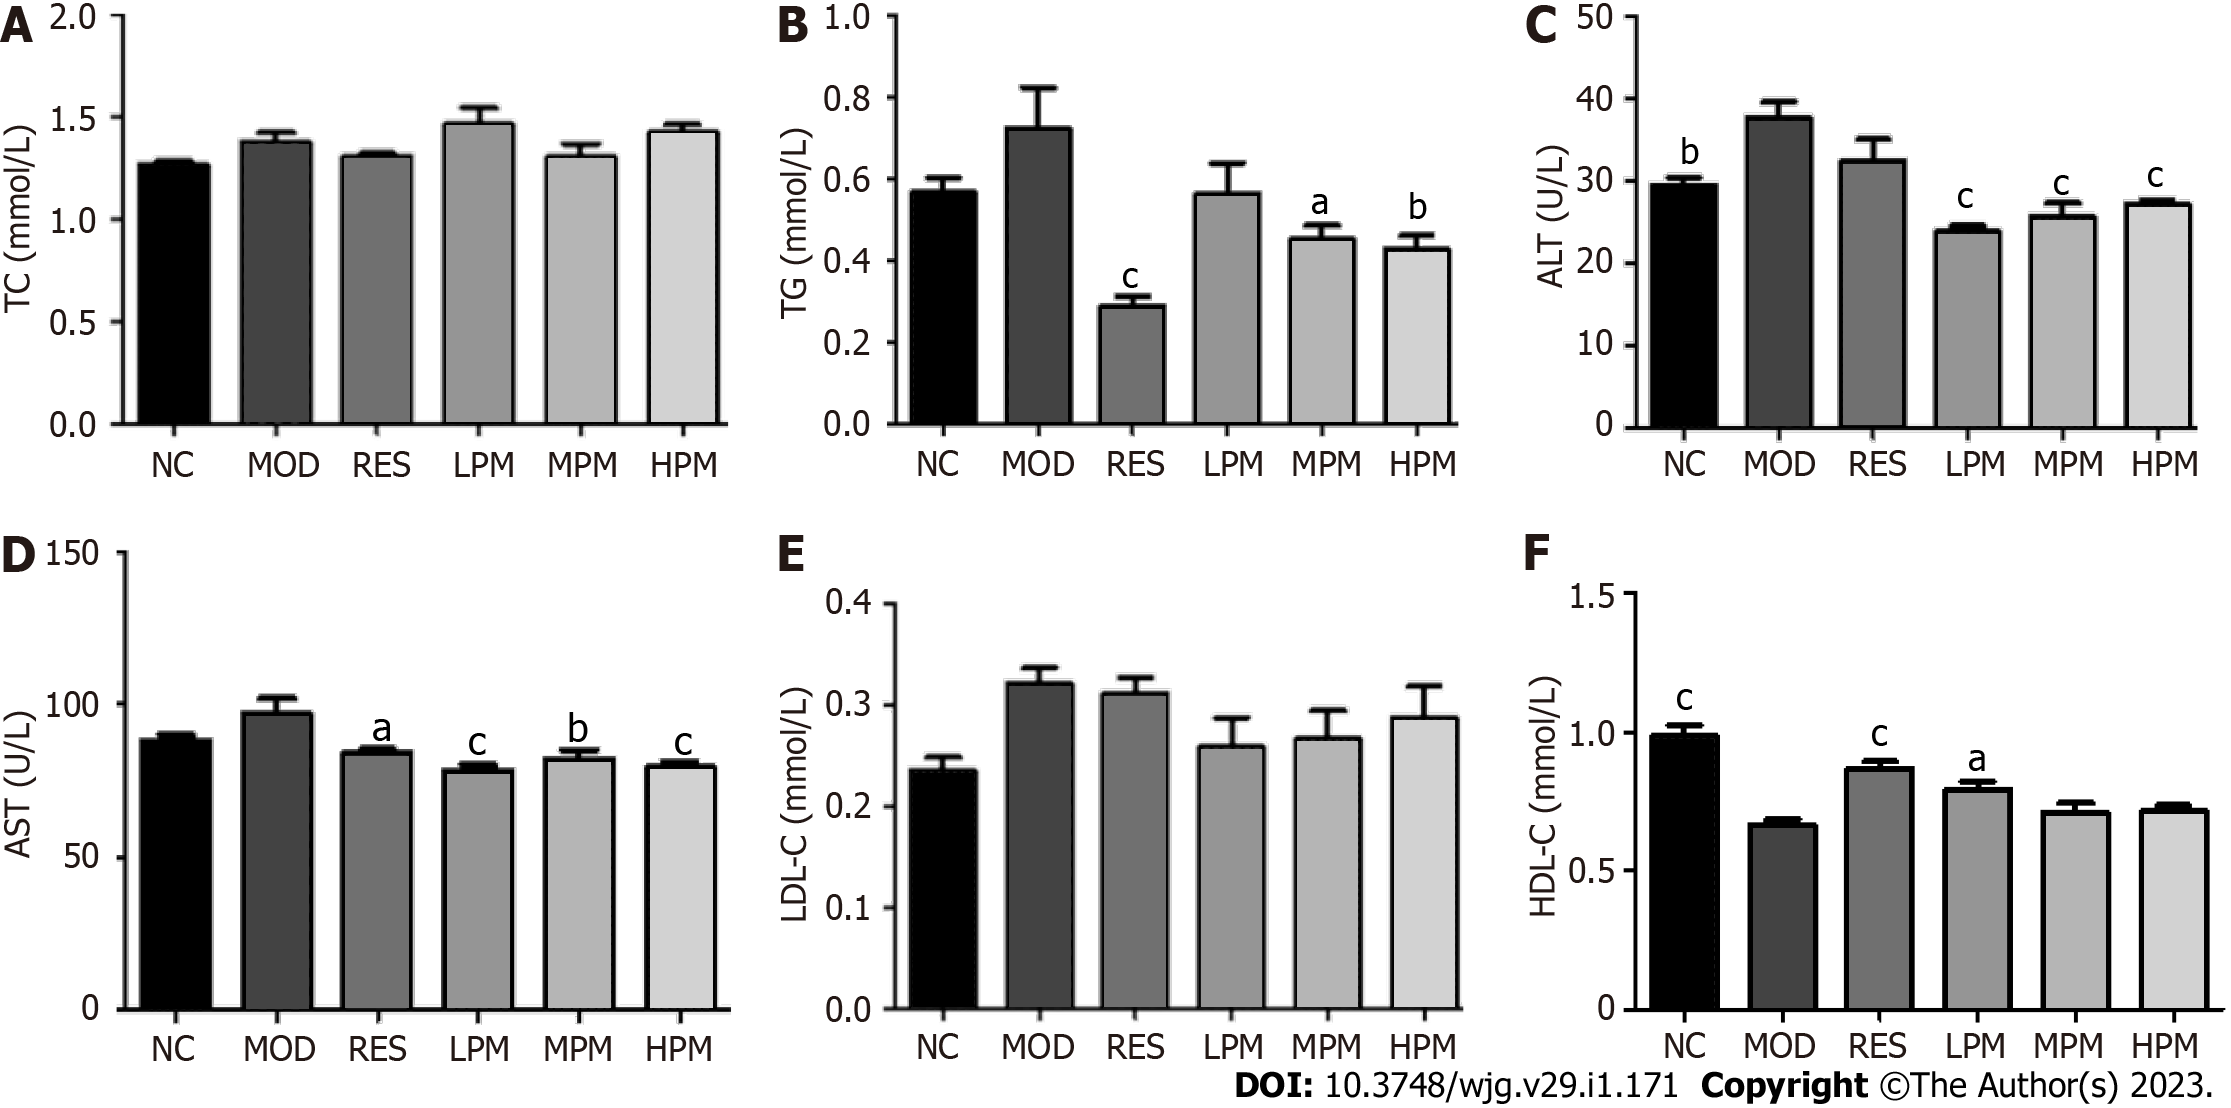
Figure 2 Effects of Polygonum multiflorum extract on serum biochemical parameters of high-fat diet-fed rats.
Sprague Dawley rats were administered saline, resveratrol, or Polygonum multiflorum extract (2, 4 or 8 g/kg/d). After 3 mo of high-fat diet feeding, rats were sacrificed, and serum was collected. A: Serum levels of total cholesterol were determined using a commercial kit; B: Serum levels of triglyceride were determined using a commercial kit; C: Serum levels of alanine transaminase were determined using a commercial kit; D: Serum levels of aspartate transaminase were determined using a commercial kit; E: Serum levels of low-density lipoprotein cholesterol were determined using a commercial kit; F: Serum levels of high-density lipoprotein cholesterol were determined using a commercial kit. Values represent the mean ± SD from six animals. aP < 0.05, bP < 0.01, cP < 0.001 vs model group. ALT: Alanine transaminase; AST: Aspartate transaminase; HDL-C: High-density lipoprotein cholesterol; HPM: High-dose Polygonum multiflorum extract; LDL-C: Low-density lipoprotein cholesterol; LPM: Low dose Polygonum multiflorum extract; MOD: Model; MPM: Middle-dose Polygonum multiflorum extract; NC: Normal control; RES: Resveratrol; TC: Total cholesterol; TG: Triglyceride.
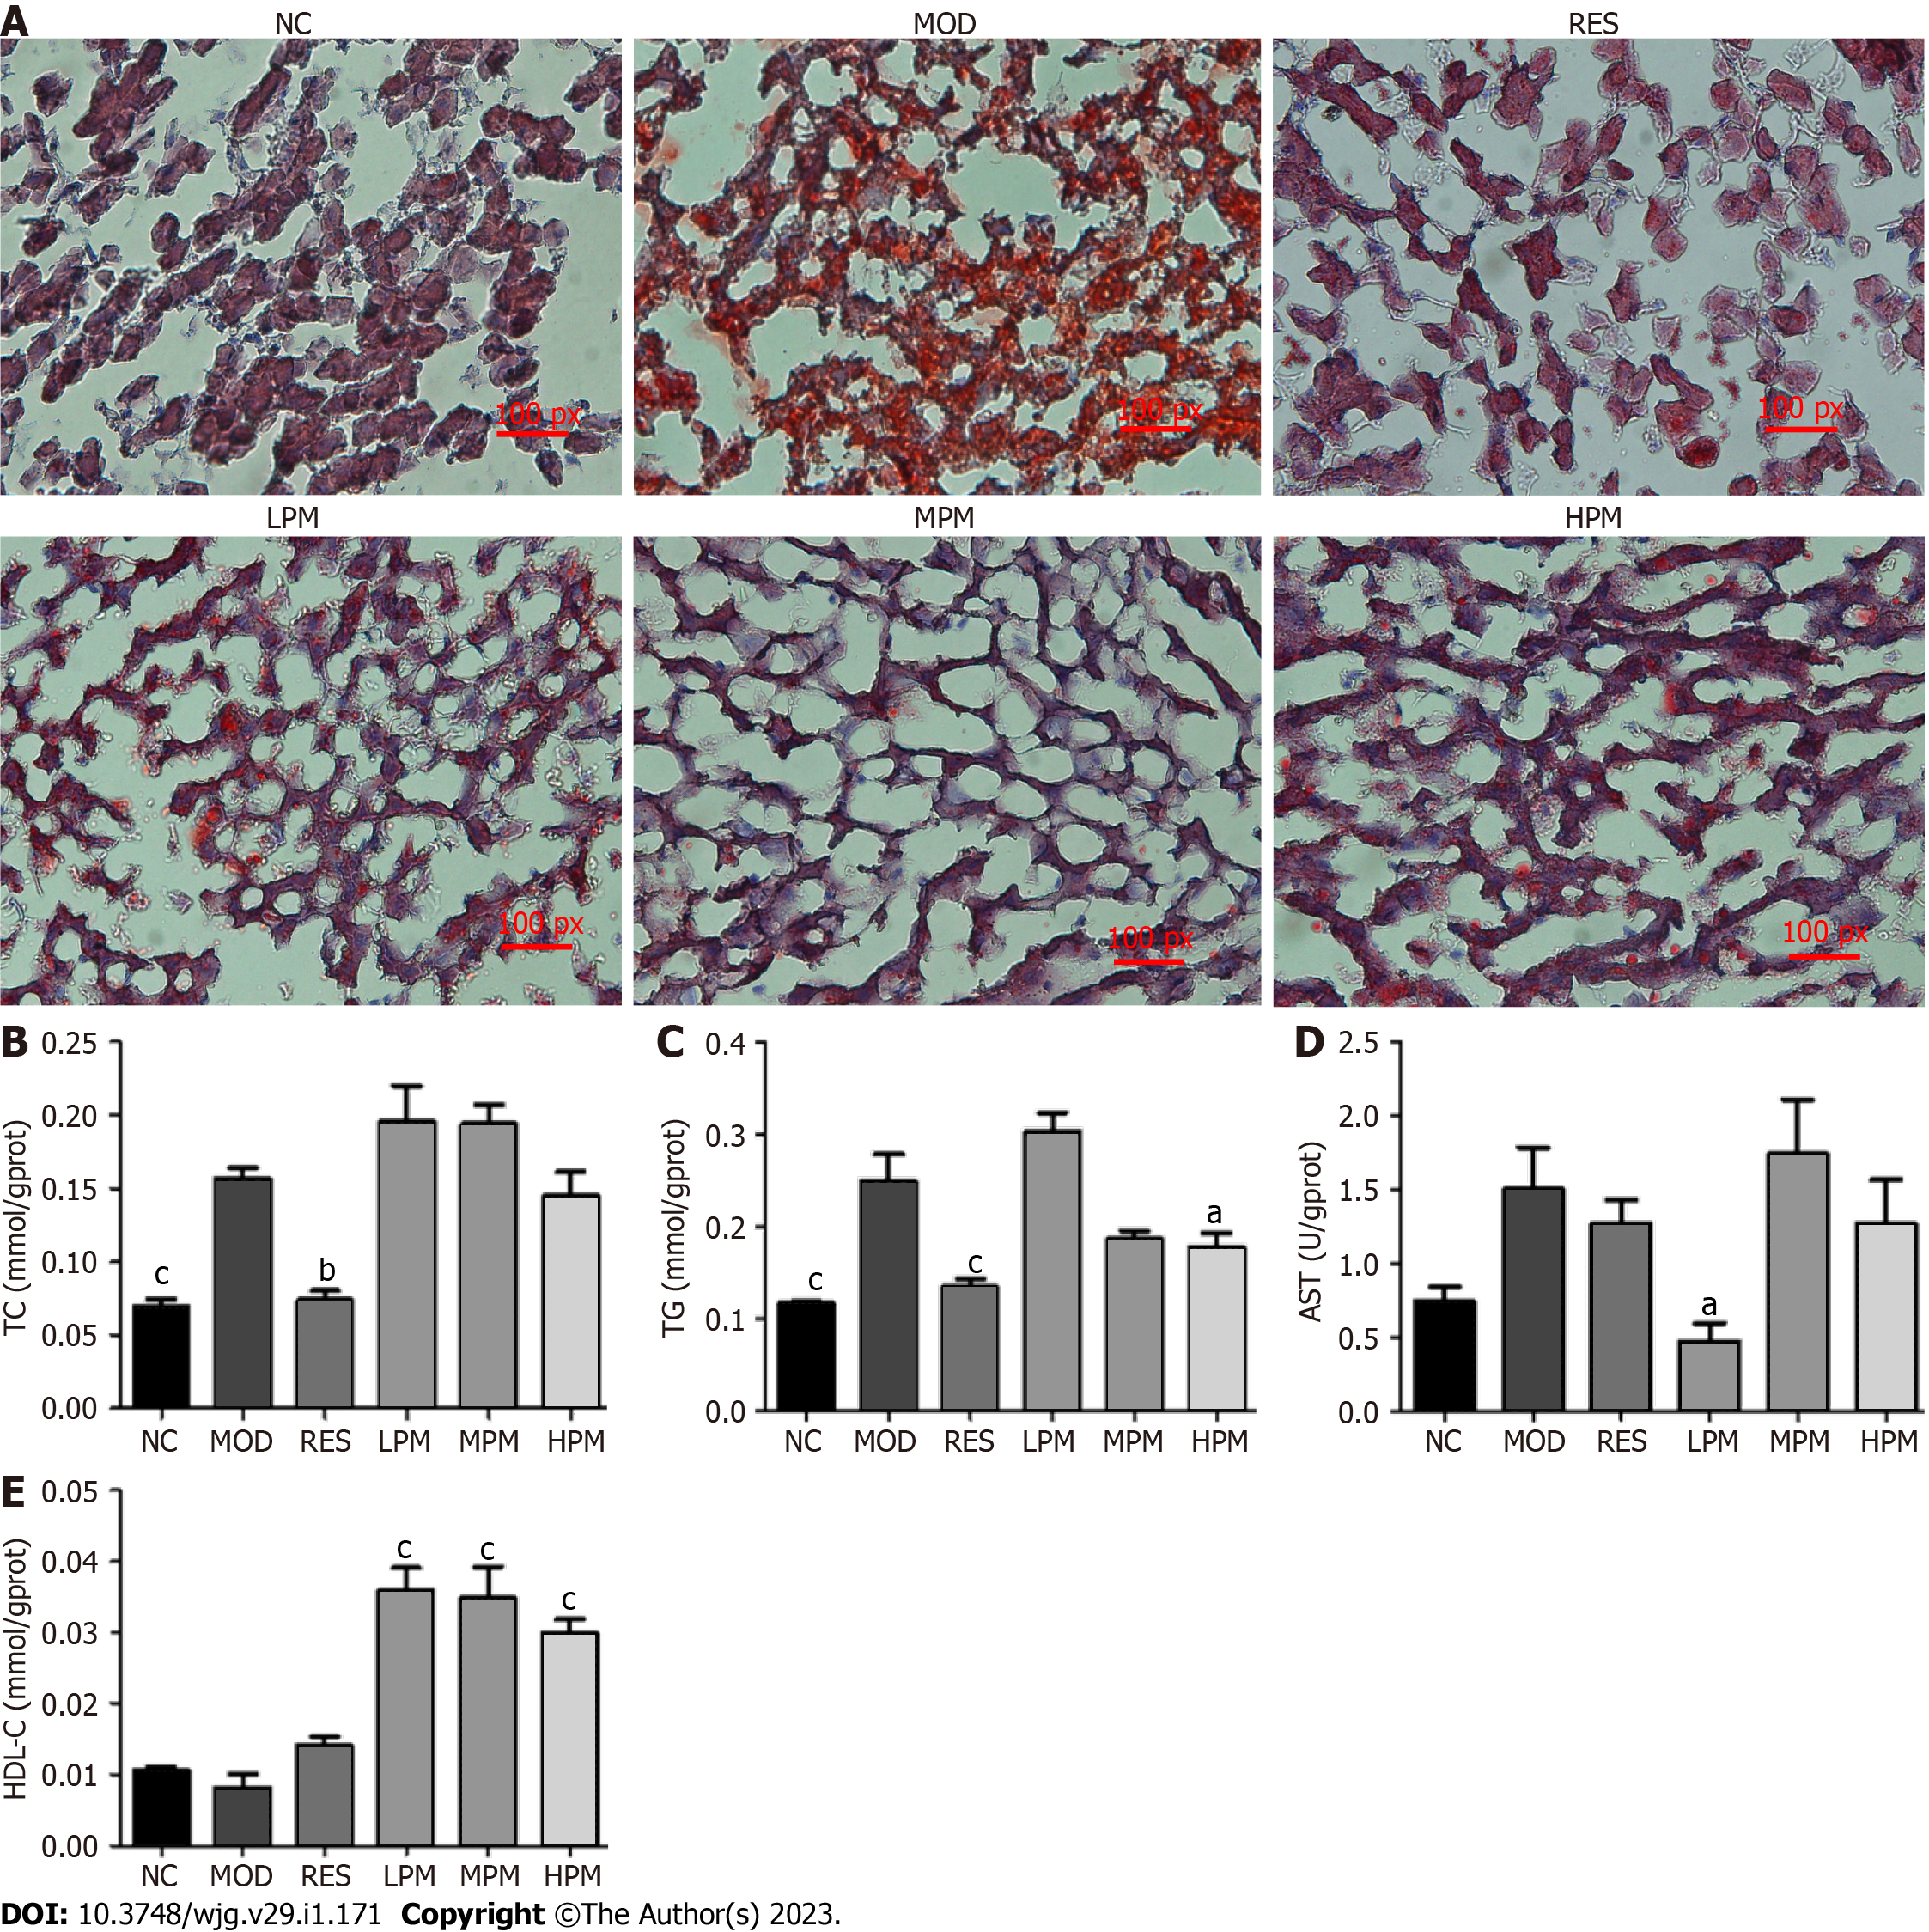
Figure 3 Effects of Polygonum multiflorum extract on the liver lipid content of high-fat diet-fed rats.
Sprague Dawley rats were administered saline, resveratrol, or Polygonum multiflorum extract (2, 4, or 8 g/kg/d). After 3 mo of high-fat diet feeding, rats were sacrificed, and livers were harvested. A: Liver histology after Oil Red O staining was observed under a light microscope (× 200); B: Liver levels of total cholesterol were determined using a commercial kit; C: Liver levels of triglyceride were determined using a commercial kit; D: Liver levels of aspartate transaminase were determined using a commercial kit; E: Liver levels of high-density lipoprotein cholesterol were determined using a commercial kit. Values represent the mean ± SD from six animals. aP < 0.05, bP < 0.01, cP < 0.001 vs the relevant model group. AST: Aspartate transaminase; HDL-C: High-density lipoprotein cholesterol; HPM: High-dose Polygonum multiflorum extract; LPM: Low dose Polygonum multiflorum extract; MOD: Model; MPM: Middle-dose Polygonum multiflorum extract; NC: Normal control; RES: Resveratrol; TC: Total cholesterol; TG: Triglyceride.
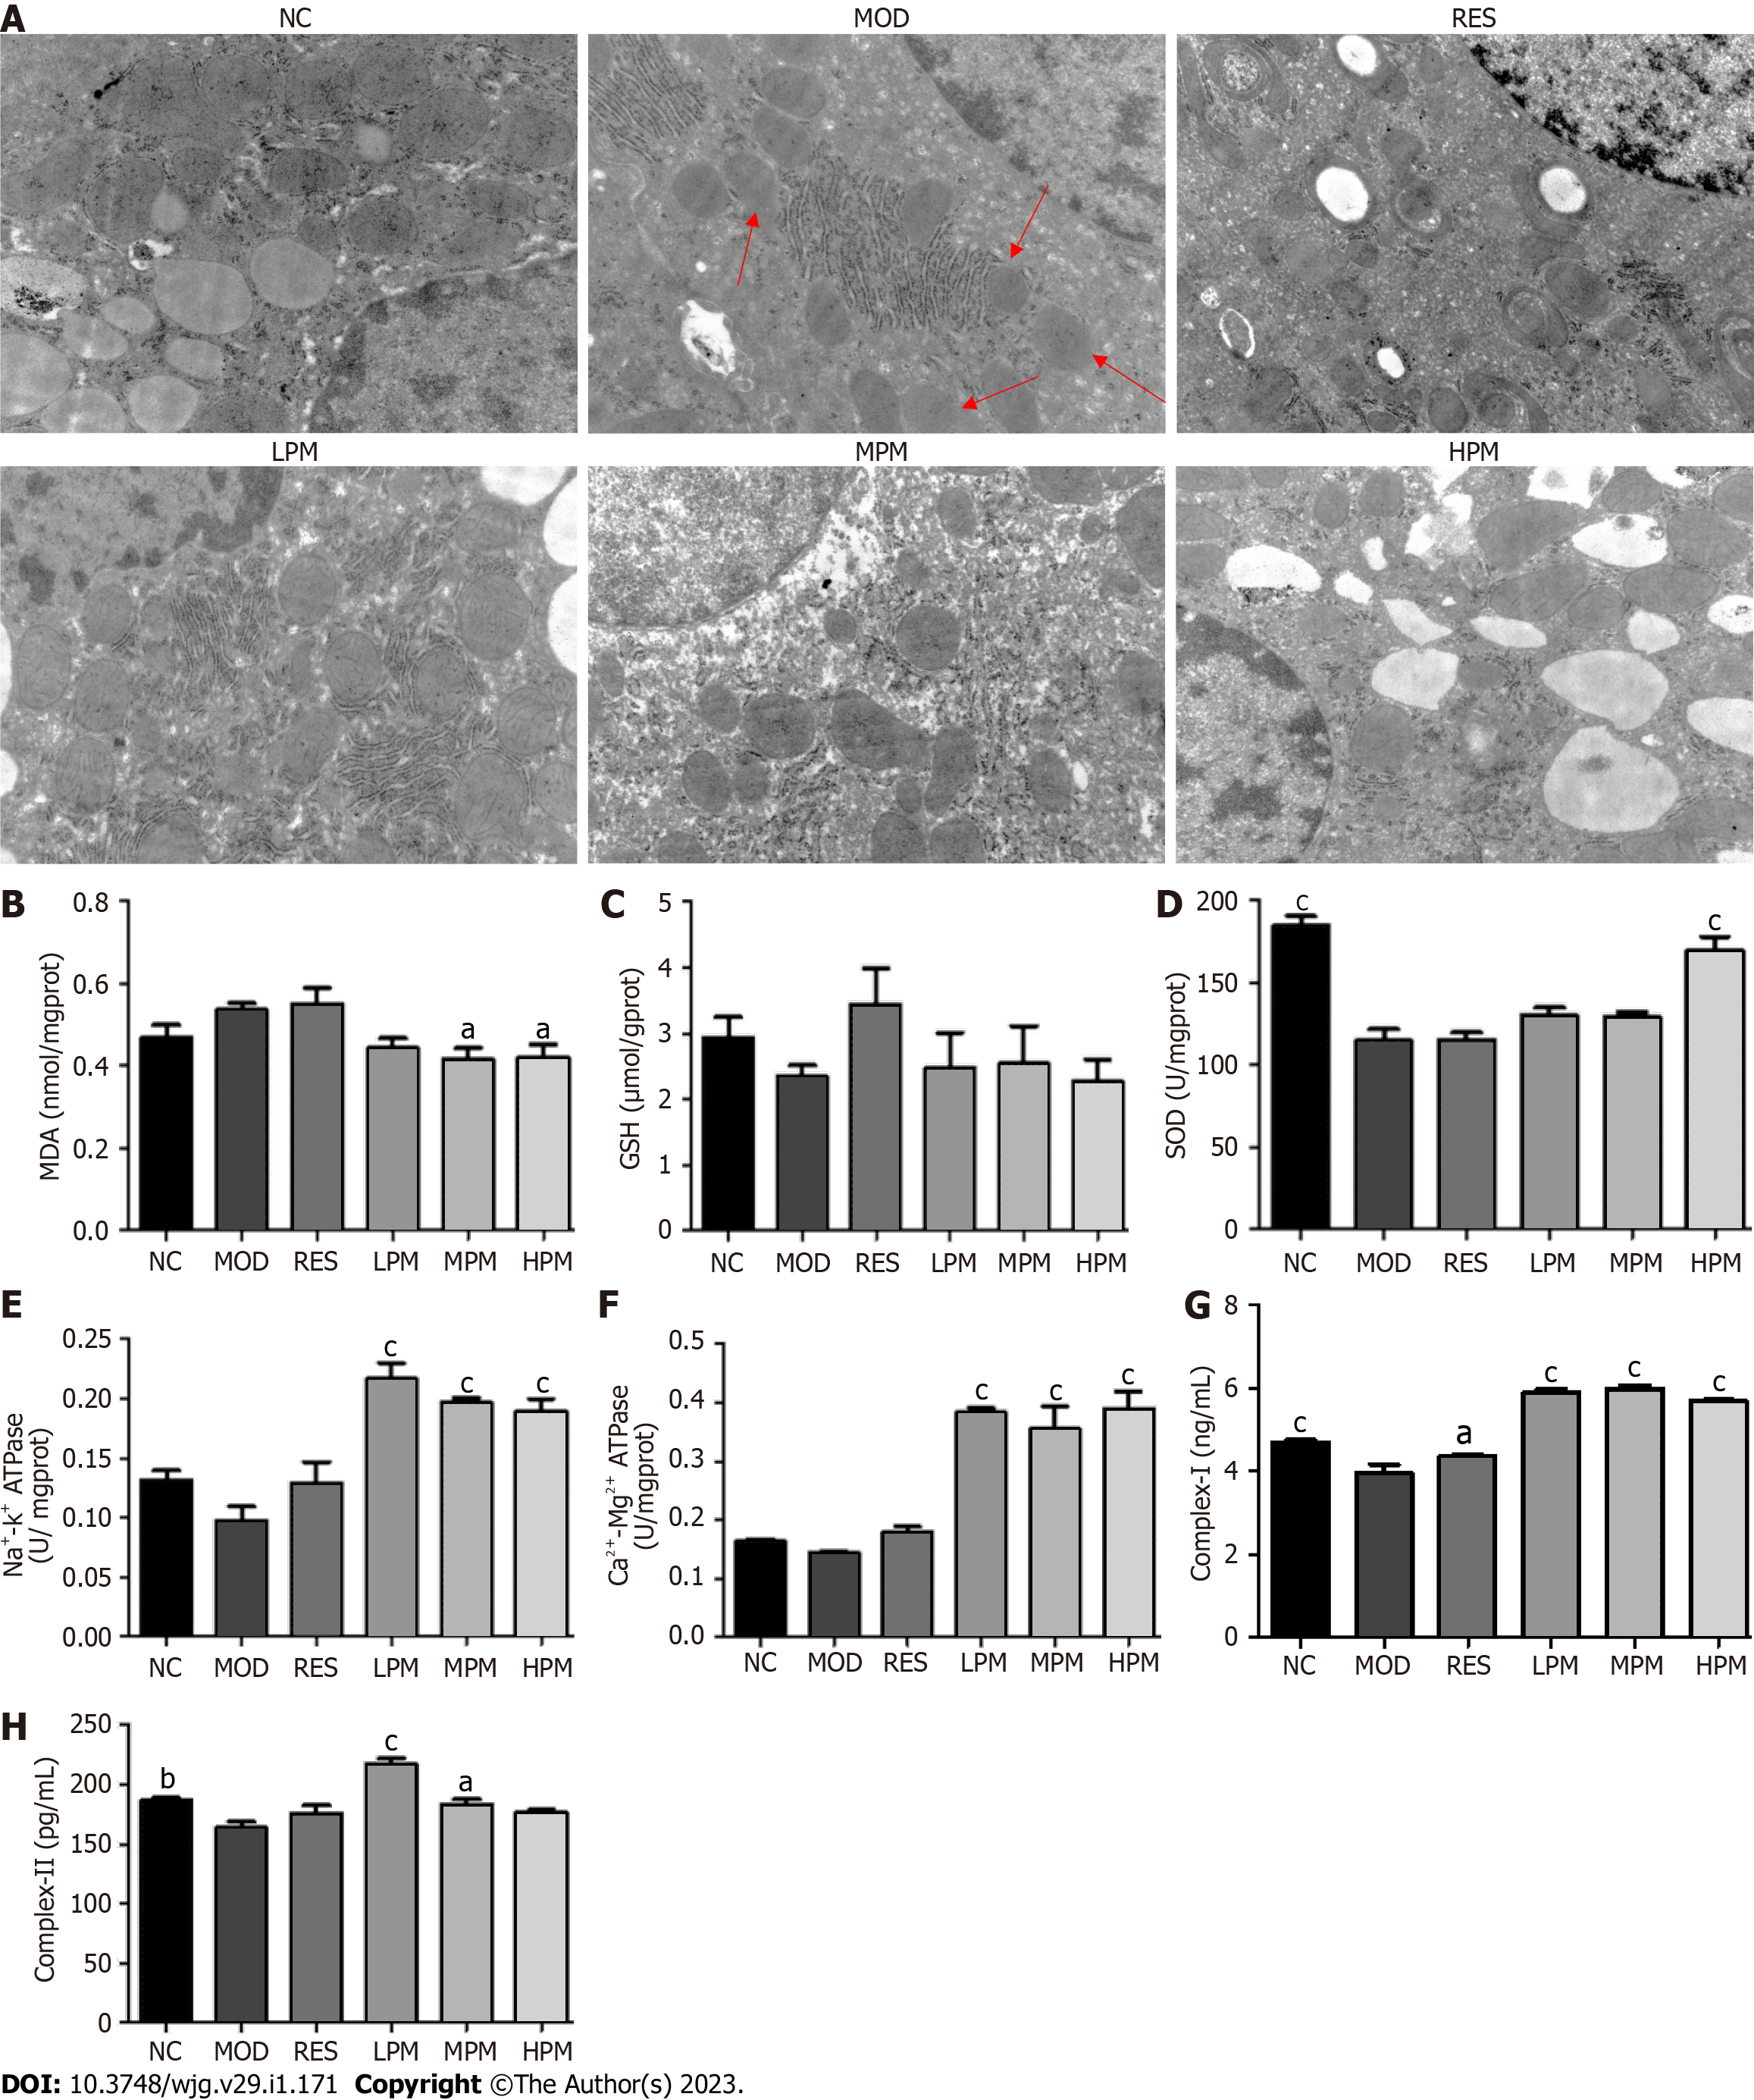
Figure 4 Effects of Polygonum multiflorum extract on the mitochondrial status of the liver from high-fat diet-fed rats.
Sprague Dawley rats were administered saline, resveratrol, or Polygonum multiflorum extract (2, 4, or 8 g/kg/d). After 3 mo of high-fat diet feeding, rats were sacrificed, and livers were harvested for observation of the mitochondrial ultrastructure and mitochondrial isolations. A: Mitochondria were assessed by transmission electron microscope (original magnification × 30000; bar = 500 nm); B: Levels of malondialdehyde were determined using a commercial kit; C: Levels of glutathione were determined using a commercial kit; D: Levels of superoxide dismutase were determined using a commercial kit; E: Levels of Na+-K+-ATPase were determined using a commercial kit; F: Levels of Ca2+-Mg2+-ATPase were determined using a commercial kit; G: Levels of complex I were determined using a commercial kit; H: Levels of complex II in isolated liver mitochondria were determined using a commercial kit. Values represent the mean ± SD from six animals. aP < 0.05, bP < 0.01, cP < 0.001 vs model group. ATPase: ATP synthase; Complex I/II: rat mitochondrial respiratory chain complex I/II, GSH: Glutathione; HPM: High-dose Polygonum multiflorum extract; LPM: Low-dose Polygonum multiflorum extract; MDA: Malondialdehyde; MOD: Model; MPM: Middle-dose Polygonum multiflorum extract; NC: Normal control; RES: Resveratrol; SOD: Superoxide dismutase.
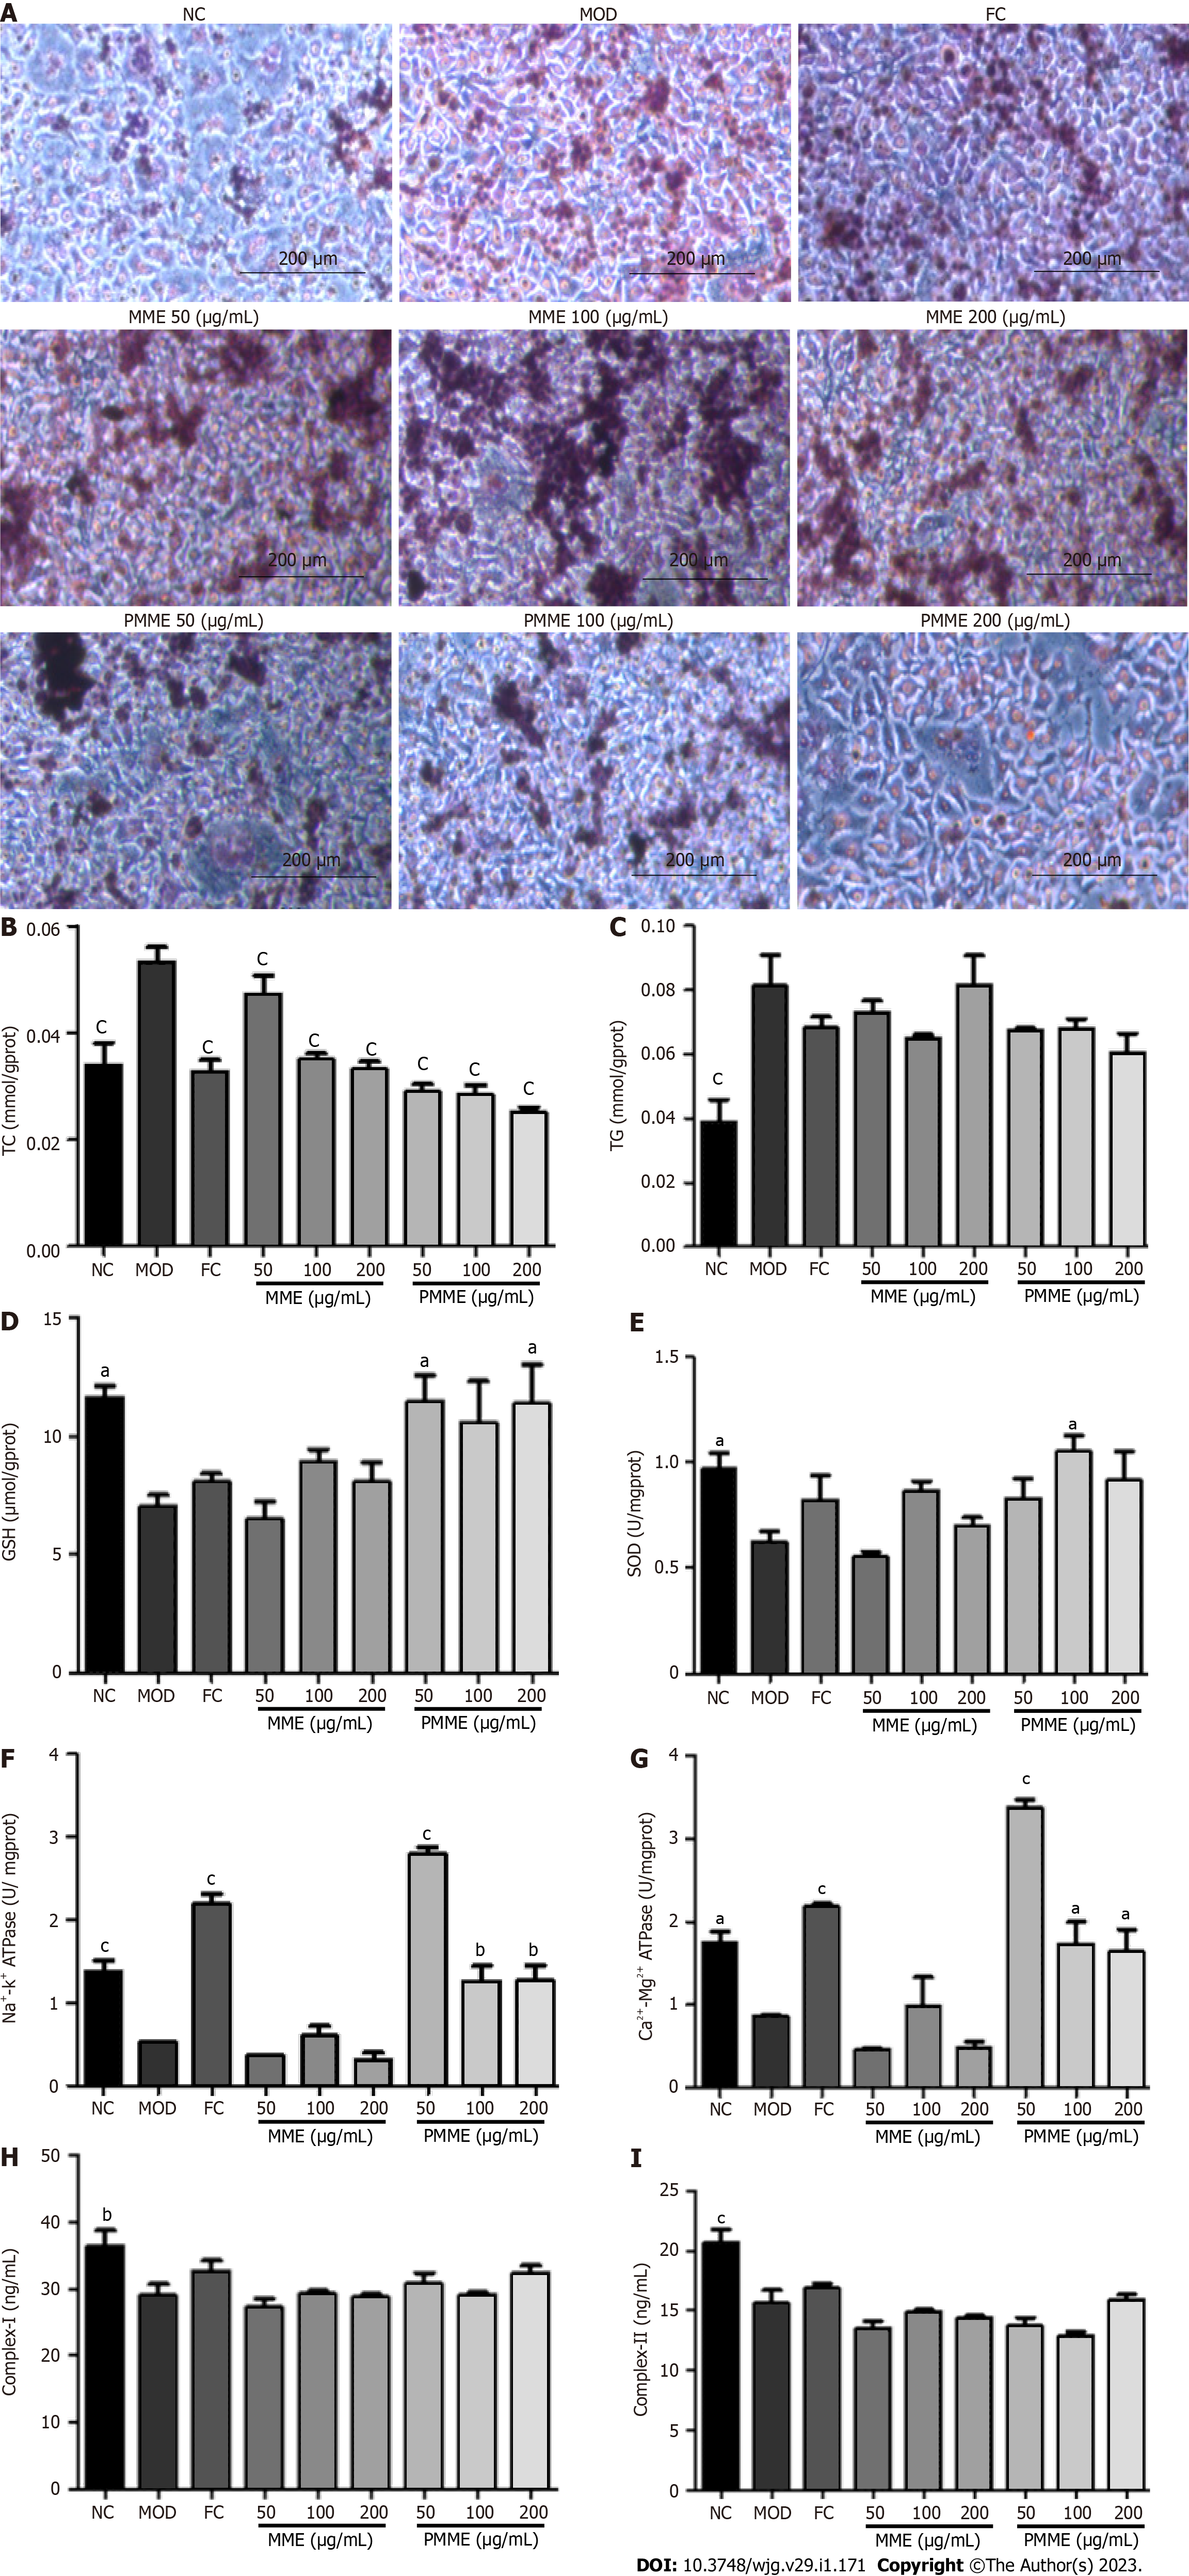
Figure 5 Effects of Polygonum multiflorum-derived constituents in liver mitochondria on L02 adipocytes induced by fat emulsion.
L02 cells were induced by fat emulsion for 24 h, then treated with liver mitochondrial extracts of the model group (50, 100, and 200 μg/mL), liver mitochondrial extract of high-dose of Polygonum multiflorum extract (50, 100, and 200 μg/mL), or fenofibrate capsules (150 μmol/L) for 24 h. Cells were harvested. A: Fat accumulation in cells was evaluated under a light microscope (× 200) after Oil Red O staining; B: Cell levels of total cholesterol were determined using a commercial kit; C: Cell levels of triglyceride were determined using a commercial kit; D: Cell levels of glutathione were determined using a commercial kit; E: Cell levels of superoxide dismutase were determined using a commercial kit; F: Cell levels of Na+-K+-ATPase were determined using a commercial kit; G: Cell levels of Ca2+-Mg2+-ATPase were determined using a commercial kit; H: Cell levels of complex I were determined using a commercial kit; I: Cell levels of complex II were determined using a commercial kit. Data were obtained from 3 independent measurements and are expressed as the mean ± SD. aP < 0.05, bP < 0.01, cP < 0.001 vs model group. ATPase: ATP synthase; Complex I/II: human mitochondrial respiratory chain complex I/II, FC: Fenofibrate capsules; GSH: Glutathione; MOD: Model; MME: Liver mitochondrial extracts from the model group; NC: Normal control; PMME: Liver mitochondrial extracts from the high-dose of Polygonum multiflorum extract group; SOD: Superoxide dismutase; TC: Total cholesterol; TG: Triglyceride.
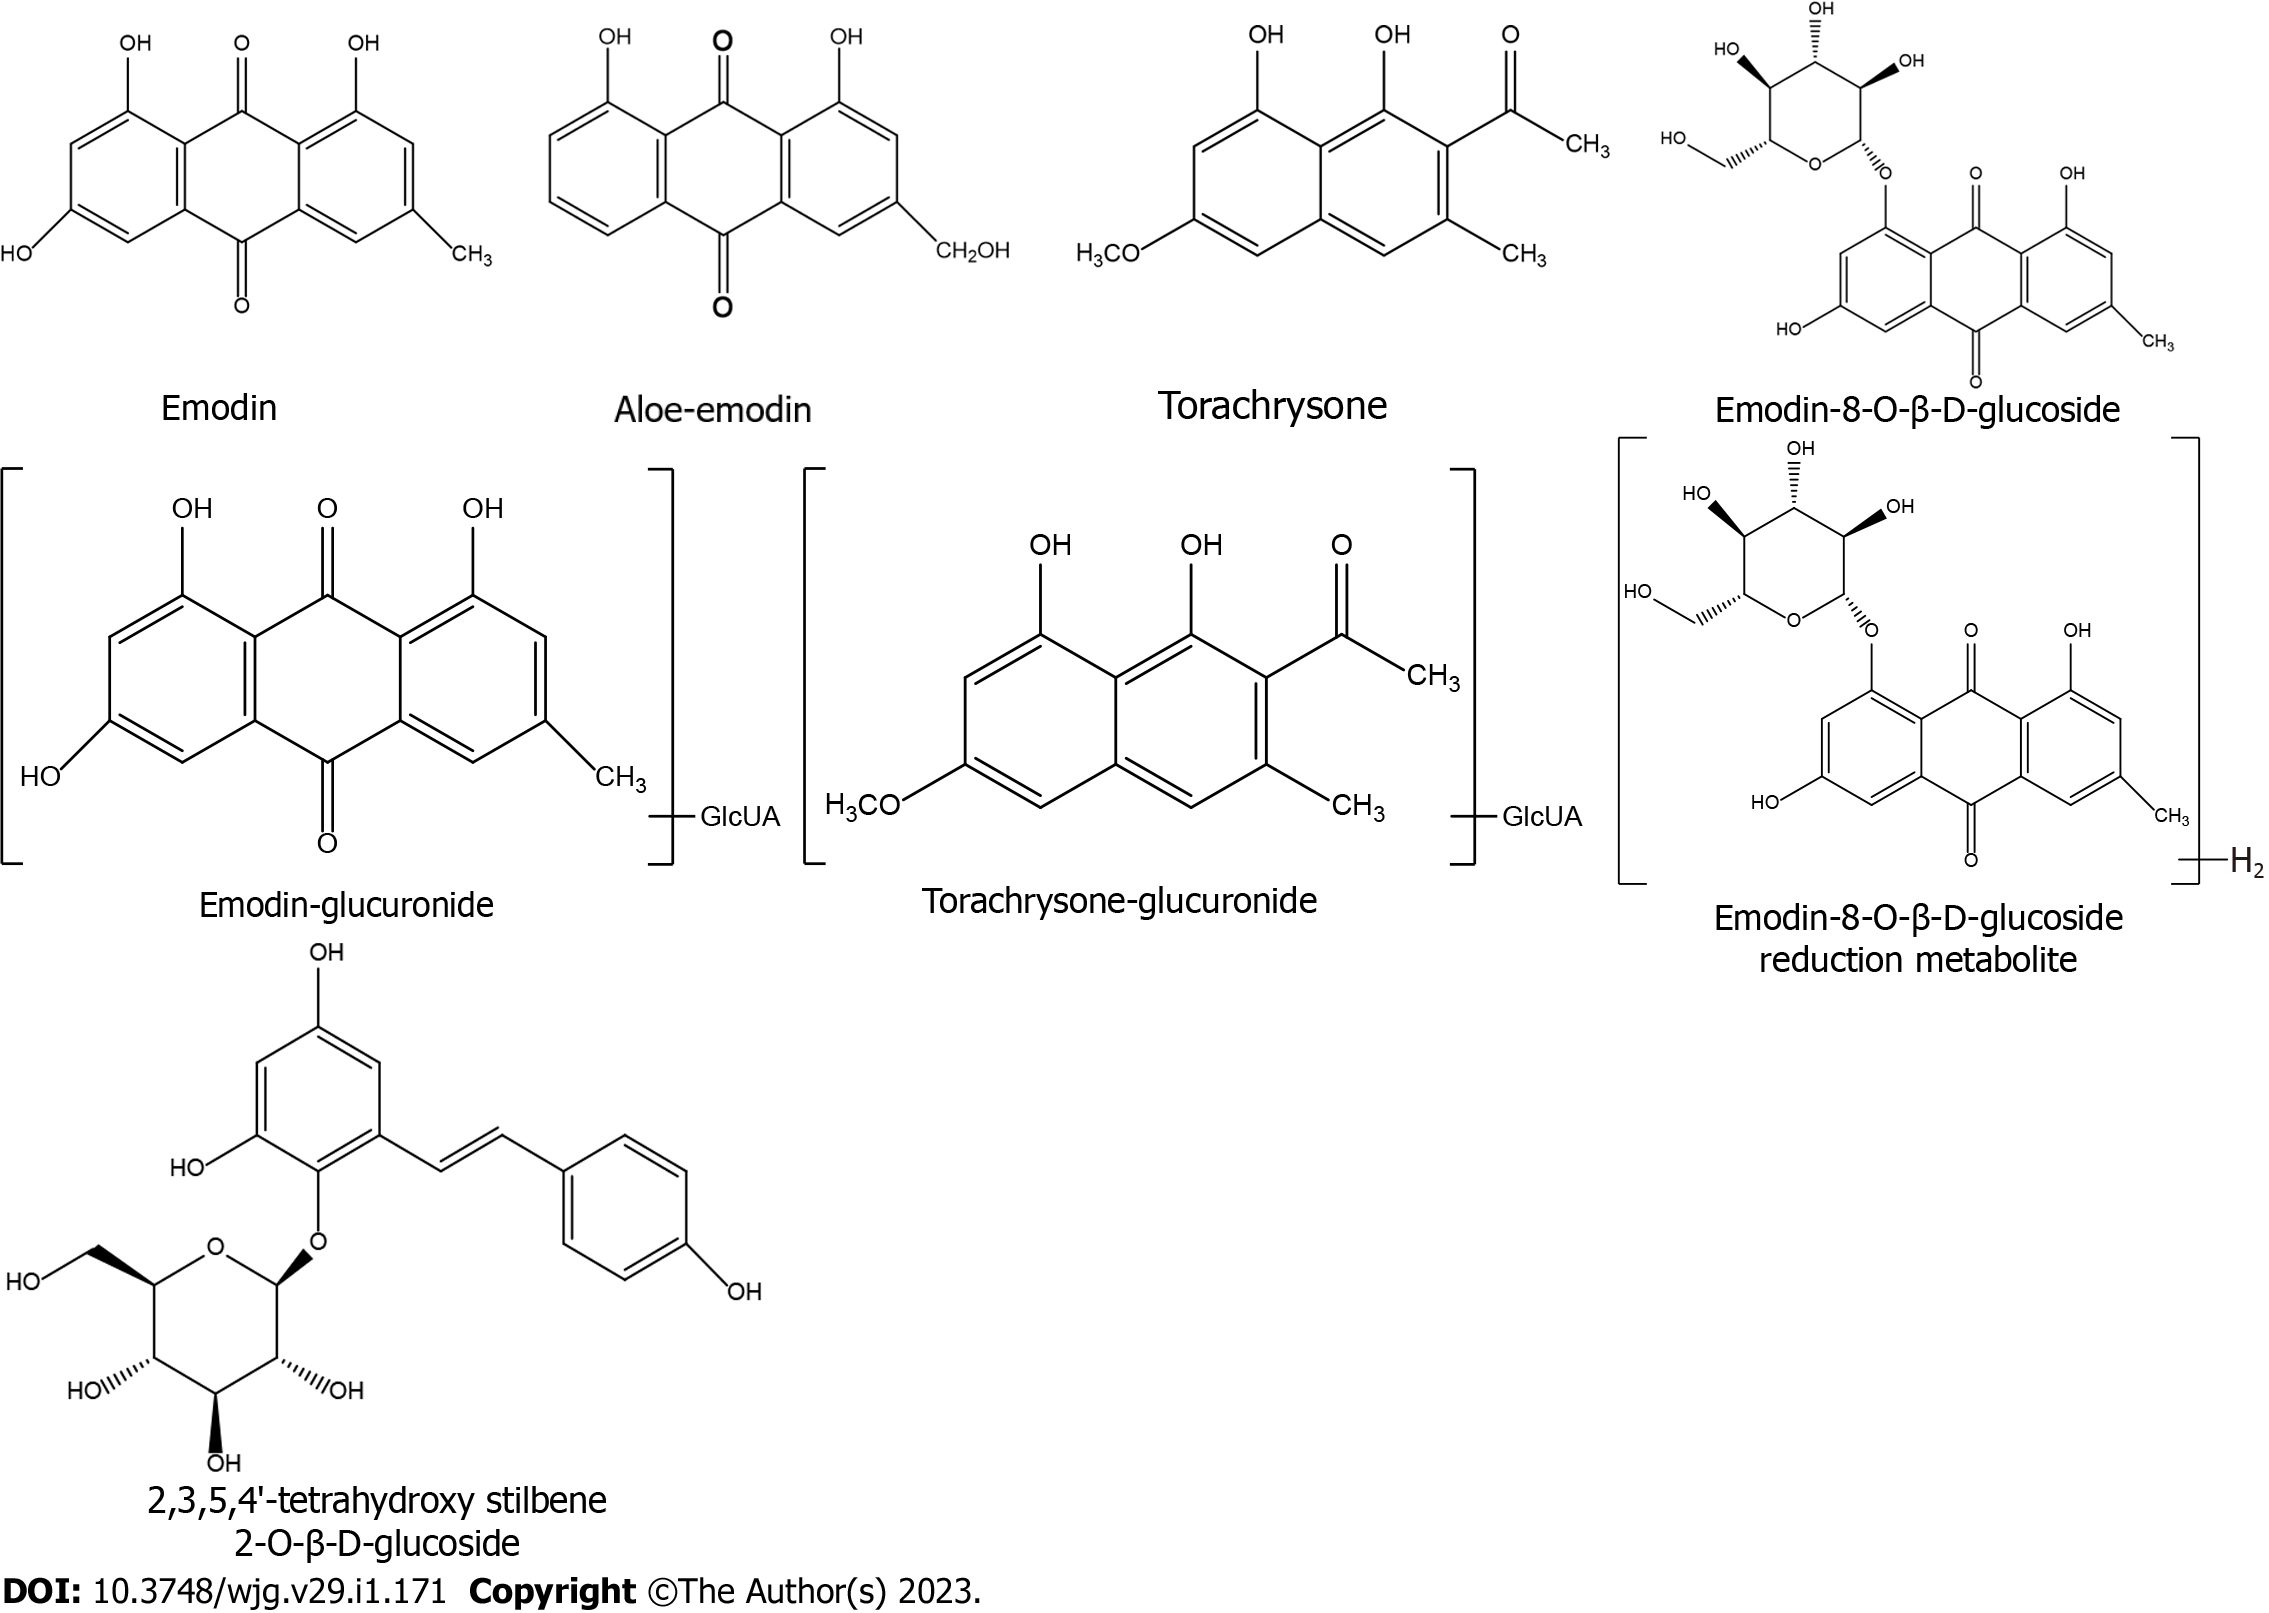
Figure 6 Chemical structures of Polygonum multiflorum-derived constituents from the liver mitochondria extract.
GlcUA: Glucuronidation.
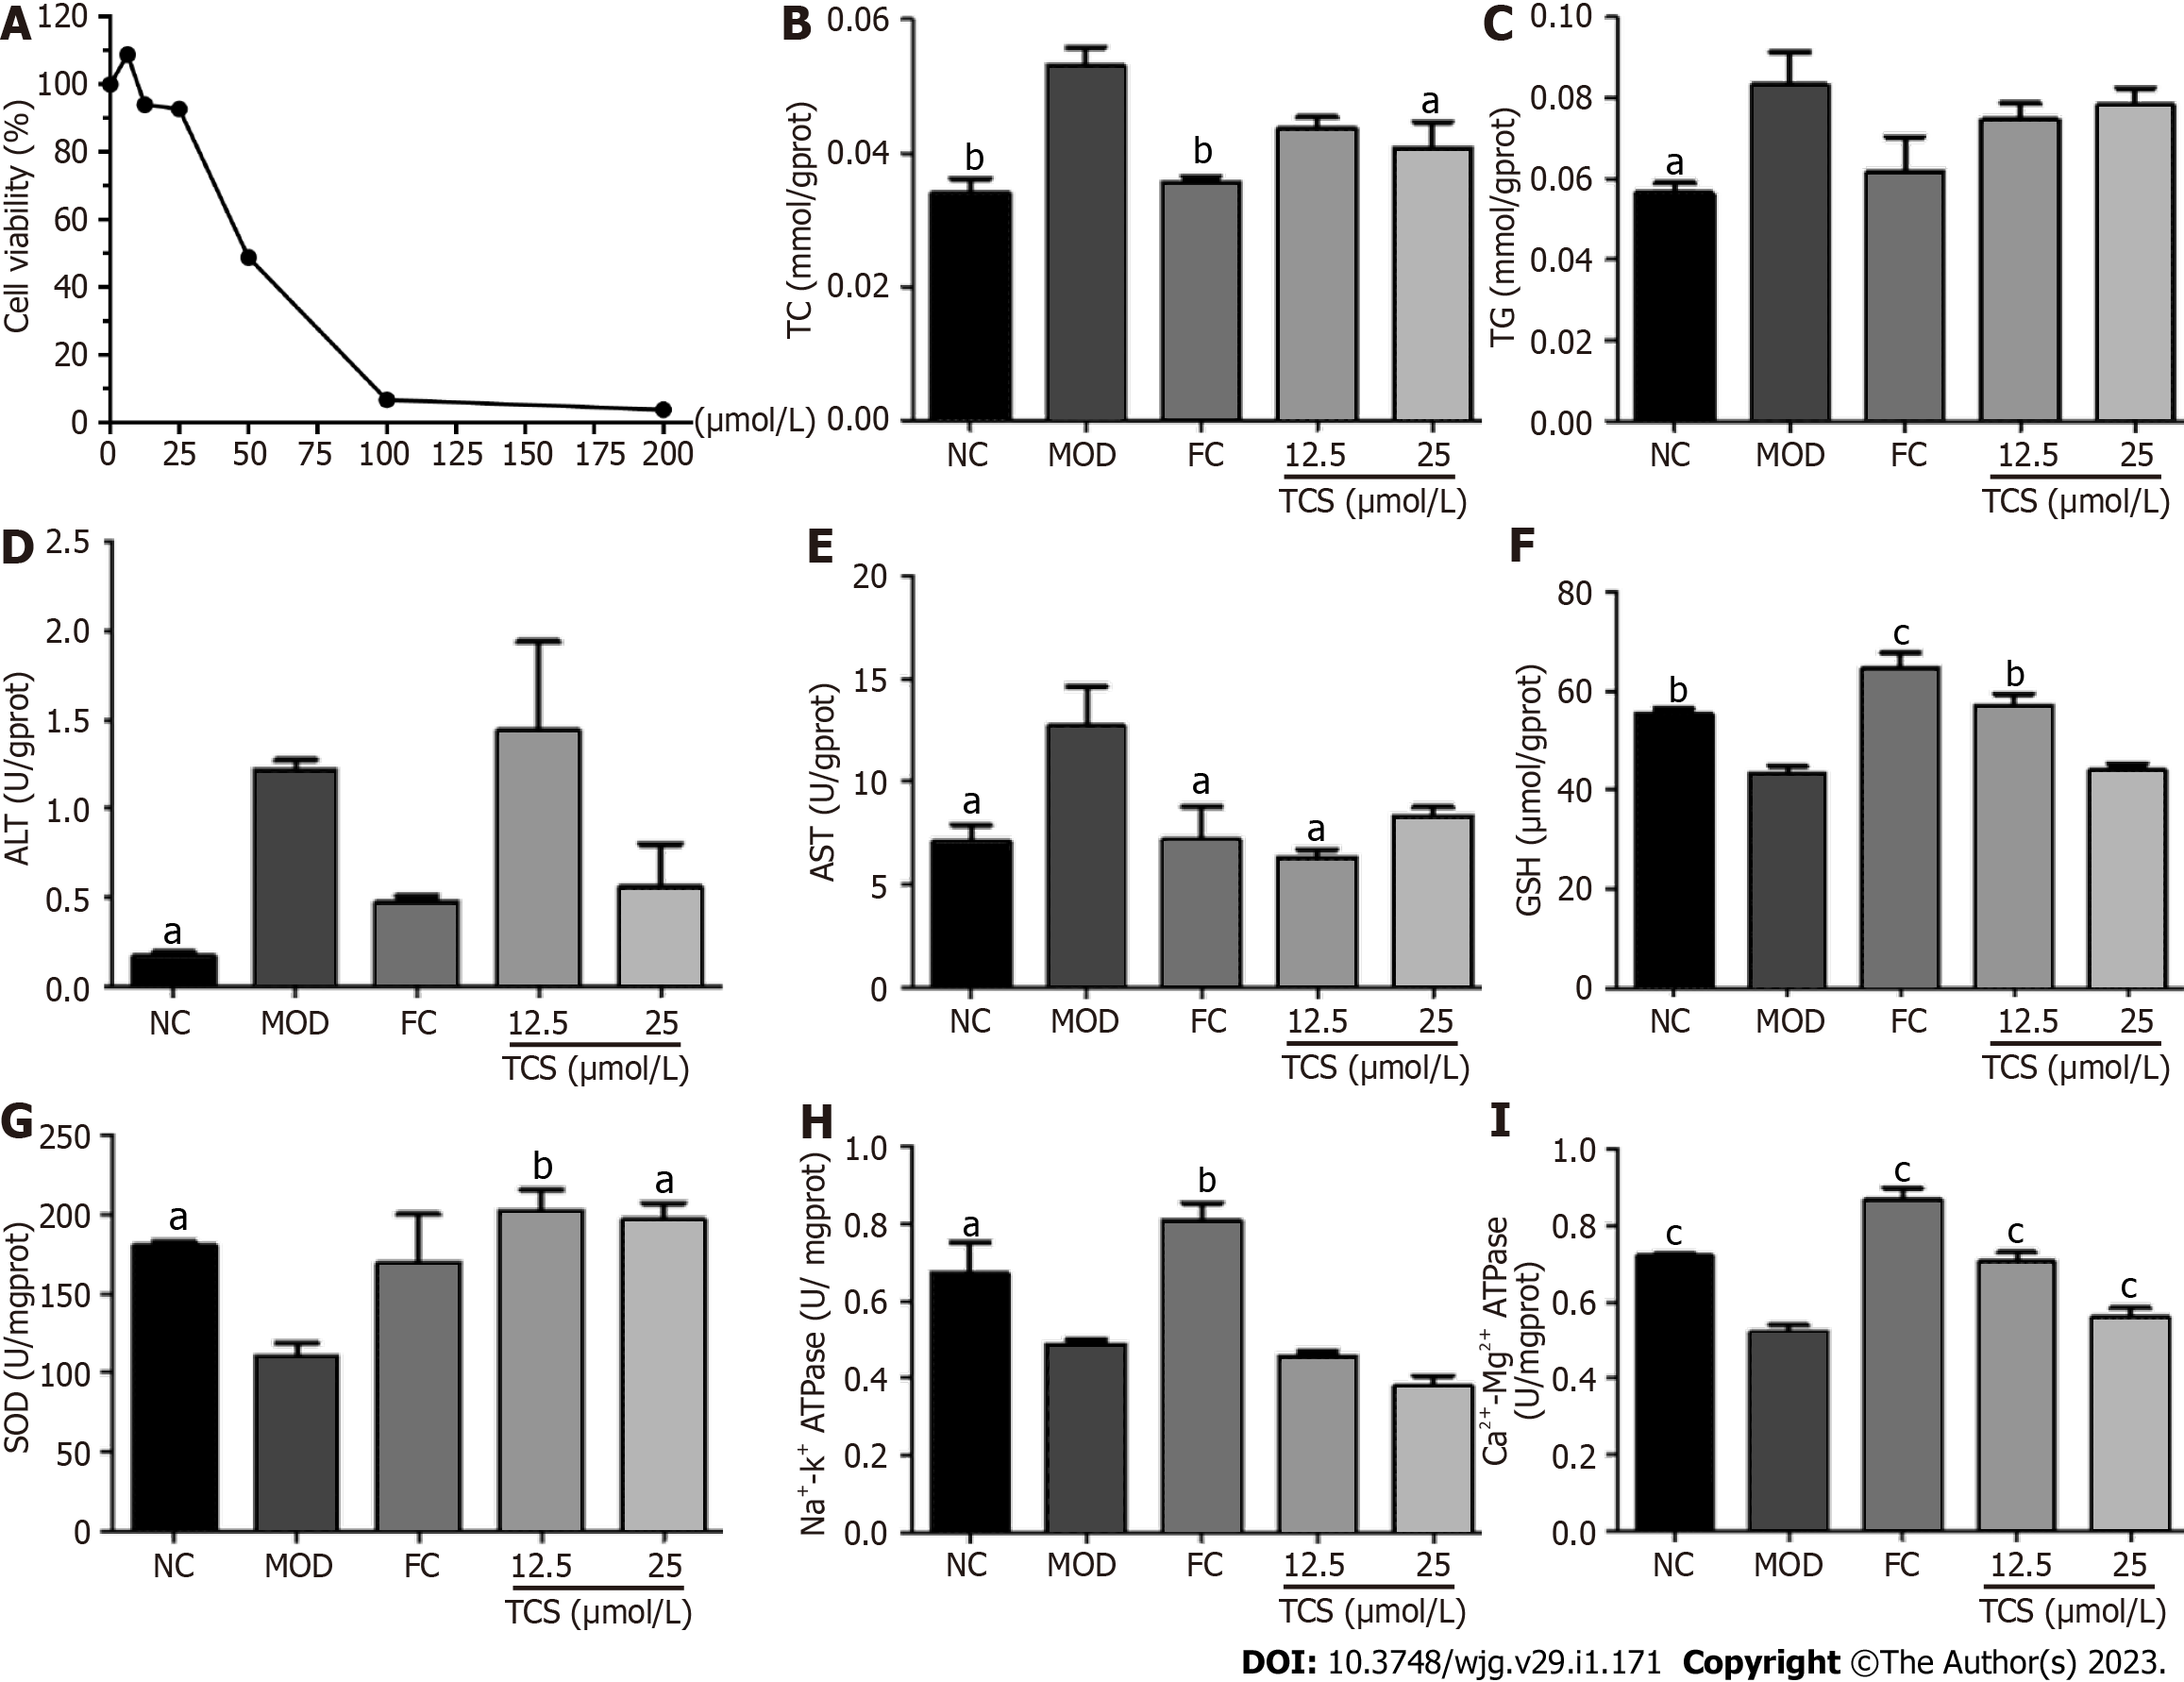
Figure 7 Effects of Polygonum multiflorum-derived monomer in liver mitochondria on L02 adipocytes induced by fat emulsion.
A: The cell counting kit-8 assay showed that torachrysone had no obvious cytotoxic effect on L02 cells at 12.5 and 25 μmol/L. These two concentrations were selected for in vitro anti-lipid activity detection. L02 cells were induced by fat emulsion for 24 h followed by stimulation with torachrysone (12.5 and 25 μmol/L) or fenofibrate capsules (150 μmol/L) for 24 h. Cells were harvested; B: Levels of total cholesterol were determined using a commercial kit; C: Levels of triglyceride were determined using a commercial kit; D: Levels of alanine transaminase were determined using a commercial kit; E: Levels of aspartate transaminase were determined using a commercial kit; F: Levels of glutathione were determined using a commercial kit; G: Levels of superoxide dismutase were determined using a commercial kit; H: Levels of Na+-K+-ATPase were determined using a commercial kit; I: Levels of Ca2+-Mg2+-ATPase were determined using a commercial kit. Data were obtained from 3 independent measurements and are expressed as the mean ± SD. aP < 0.05, bP < 0.01, cP < 0.001 vs model group. ALT: Alanine transaminase; AST: Aspartate transaminase; ATPase: ATP synthase; FC: Fenofibrate capsules; GSH: Glutathione; MOD: Model; NC: Normal control; SOD: Superoxide dismutase; TC: Total cholesterol; TG: Triglyceride; TCS: Torachrysone.
Figure 8 Effects of Polygonum multiflorum-derived monomer group in liver mitochondria on serum biochemical parameters of high-fat diet-fed mice.
Mice were administered saline, Polygonum multiflorum-derived monomer groups (30 and 90 mg/kg/d), or resveratrol (18 mg/kg/d). After 3 mo of high-fat diet feeding, mice were sacrificed, and serum was collected. A: Serum levels of total cholesterol were determined using a commercial kit; B: Serum levels of aspartate transaminase were determined using a commercial kit; C: Serum levels of low-density lipoprotein cholesterol were determined using a commercial kit. Values represent the mean ± SD from six animals. aP < 0.05, bP < 0.01, cP < 0.001 vs model group. AST: Aspartate transaminase; HMG: High-dose Polygonum multiflorum-derived monomer group; LDL-C: Low-density lipoprotein cholesterol; LMG: Low-dose Polygonum multiflorum-derived monomer group; MOD: Model; NC: Normal control; RES: Resveratrol; TC: Total cholesterol.
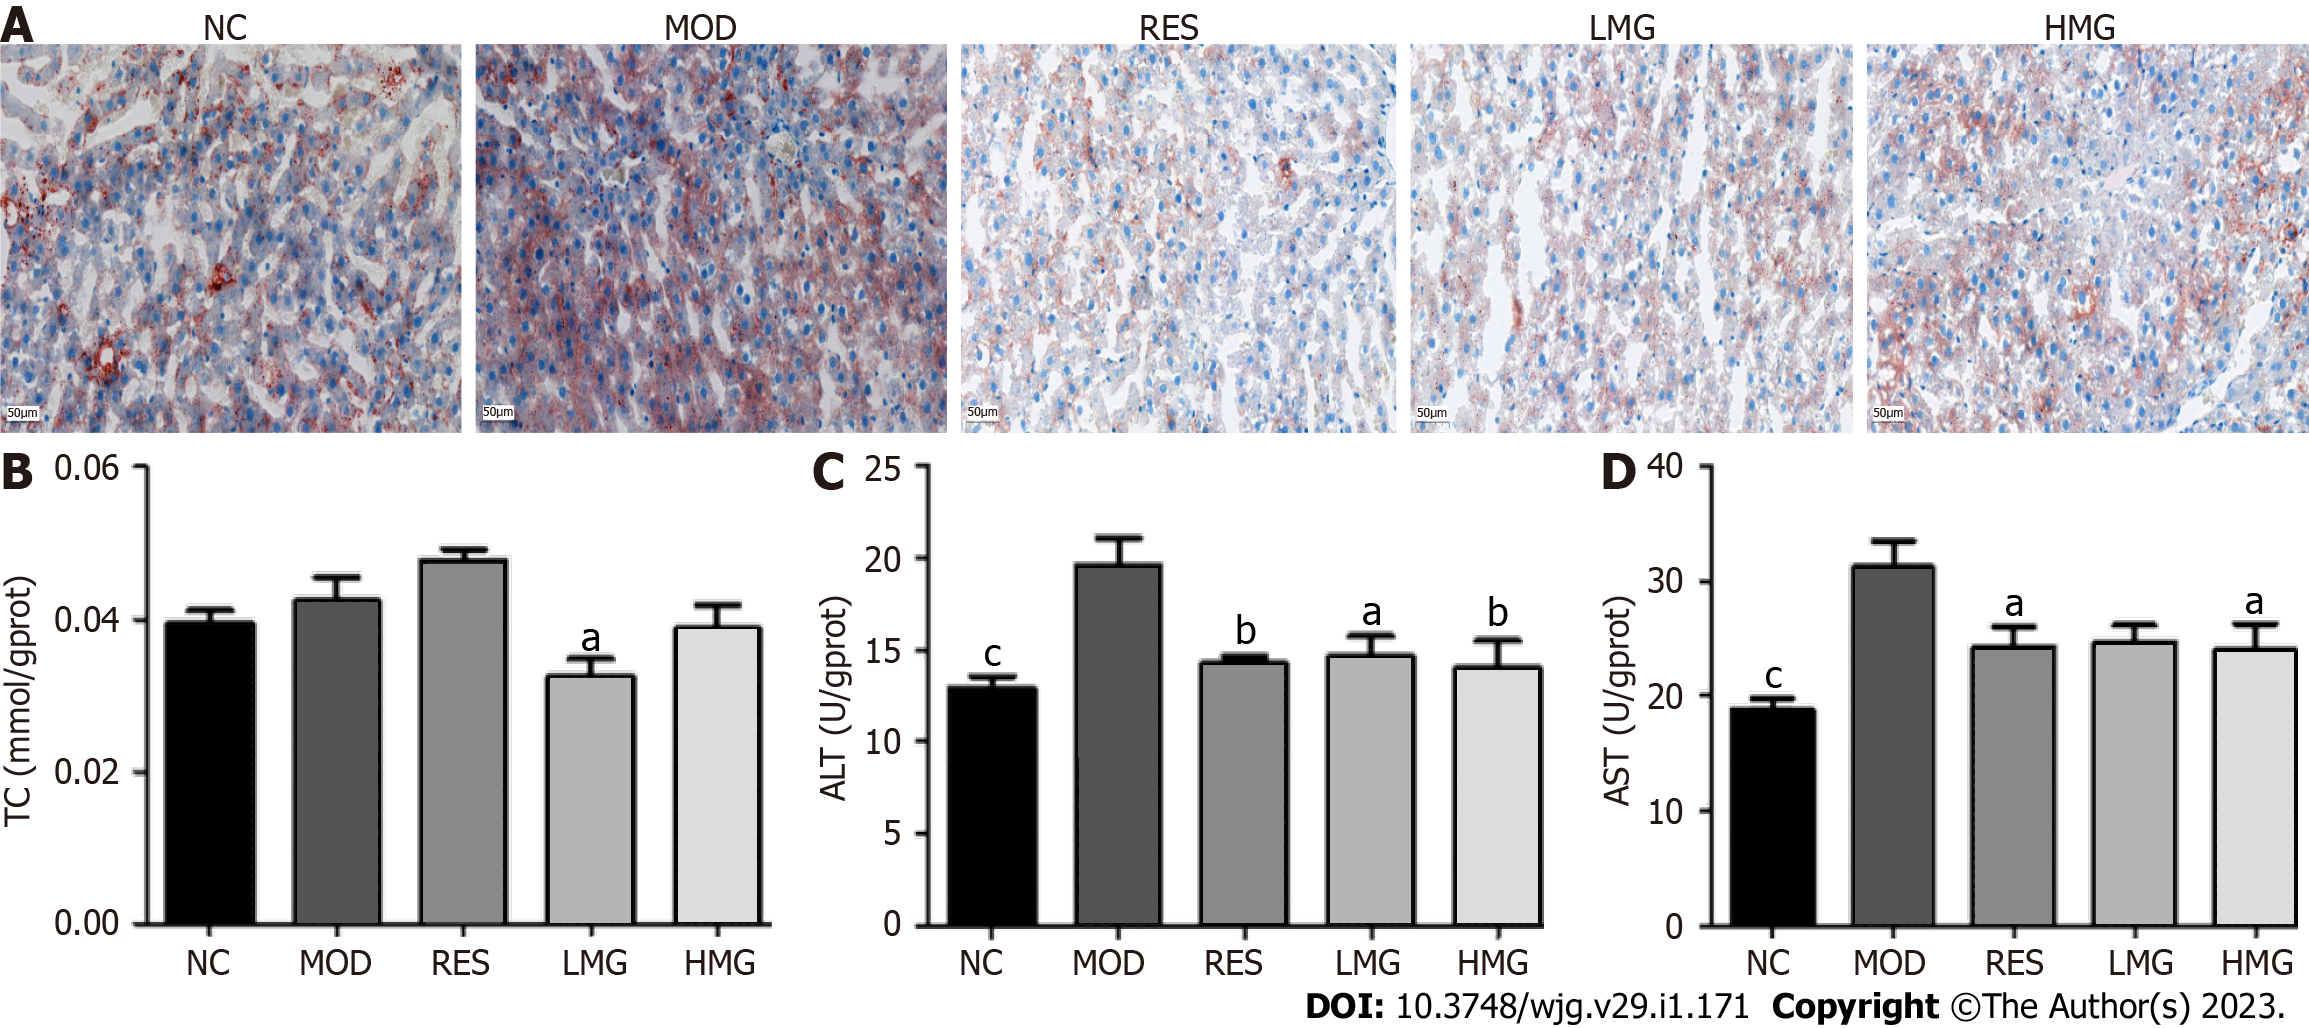
Figure 9 Effects of Polygonum multiflorum-derived monomer group in liver mitochondria on the liver lipid content of high-fat diet-fed mice.
Mice were administered saline, Polygonum multiflorum-derived monomer groups (30, and 90 mg/kg/d), or resveratrol (18 mg/kg/d). After 3 mo of high-fat diet feeding, mice were sacrificed, and livers were collected. A: Liver histology after Oil Red O staining was observed under a light microscope (× 200); B: Liver levels of total cholesterol were determined using a commercial kit; C: Liver levels of alanine transaminase were determined using a commercial kit; D: Liver levels of aspartate transaminase were determined using a commercial kit. Values represent the mean ± SD from six animals. aP < 0.05, bP < 0.01, cP < 0.001 vs the relevant model group. ALT: Alanine transaminase; AST: Aspartate transaminase; HMG: High-dose Polygonum multiflorum-derived monomer group; LMG: Low-dose Polygonum multiflorum-derived monomer group; MOD: Model; NC: Normal control; RES: Resveratrol; TC: Total cholesterol.
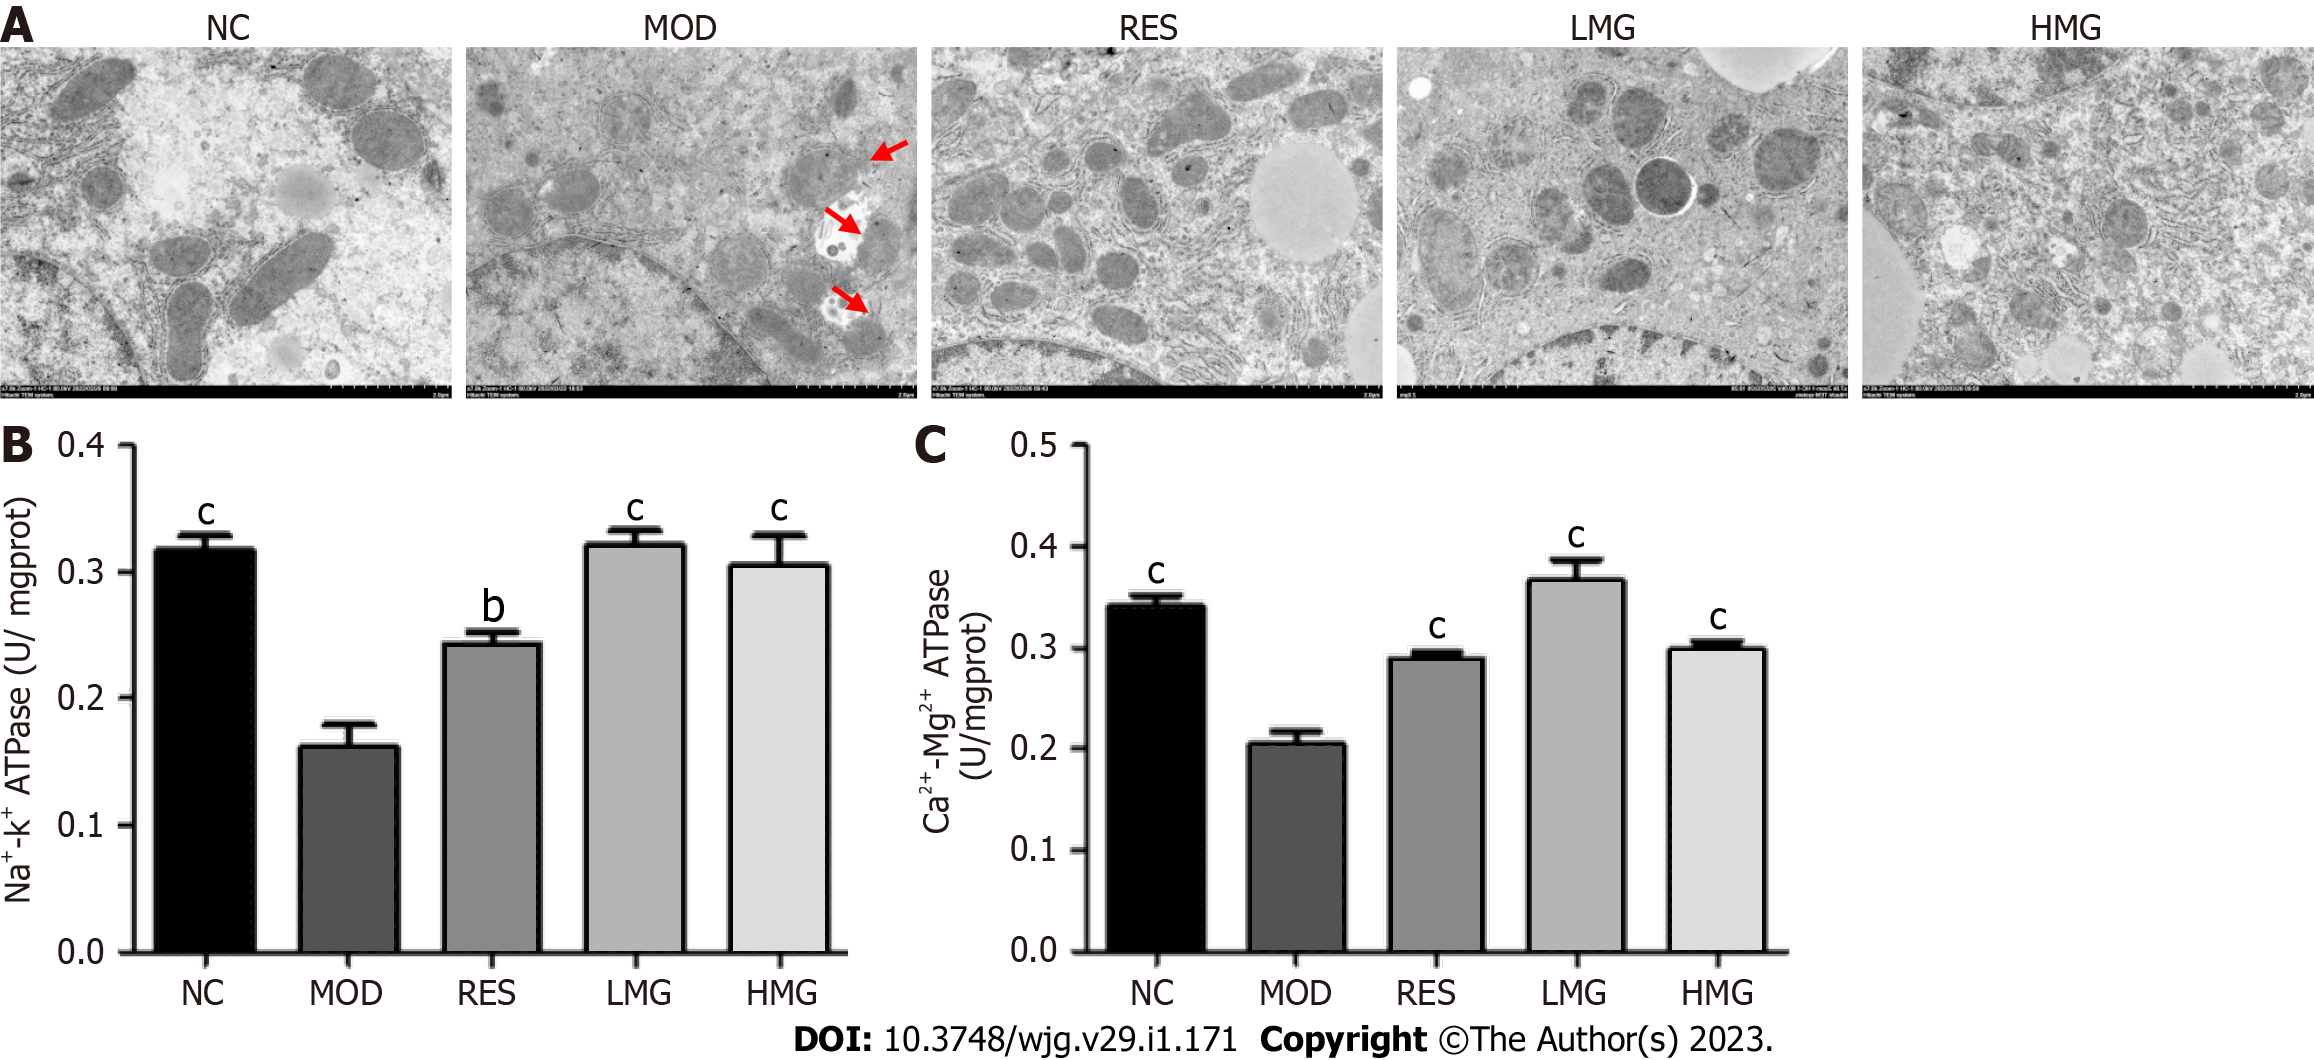
Figure 10 Effects of Polygonum multiflorum-derived monomer group in liver mitochondria on mitochondrial status in the liver from high-fat diet-fed mice.
Mice were administered saline, Polygonum multiflorum-derived monomer groups (30, and 90 mg/kg/d), or resveratrol (18 mg/kg/d). After 3 mo of high-fat diet feeding, mice were sacrificed, and livers were harvested for mitochondrial ultrastructure observations and mitochondrial isolations. A: Mitochondria were assessed by transmission electron microscope (original magnification × 30000; bar = 500 nm); B: Levels of Na+-K+-ATPase in isolated liver mitochondria were determined using a commercial kit; C: Levels of Ca2+-Mg2+-ATPase in isolated liver mitochondria were determined using a commercial kit. Values represent the mean ± SD from six animals. aP < 0.05, bP < 0.01, cP < 0.001 vs the relevant model group. ATPase: ATP synthase; HMG: High-dose Polygonum multiflorum-derived monomer group; LMG: Low-dose Polygonum multiflorum-derived monomer group; MOD: Model; NC: Normal control; RES: Resveratrol.
- Citation: Yu LP, Li YJ, Wang T, Tao YX, Zhang M, Gu W, Yu J, Yang XX. In vivo recognition of bioactive substances of Polygonum multiflorum for protecting mitochondria against metabolic dysfunction-associated fatty liver disease. World J Gastroenterol 2023; 29(1): 171-189
- URL: https://www.wjgnet.com/1007-9327/full/v29/i1/171.htm
- DOI: https://dx.doi.org/10.3748/wjg.v29.i1.171


