Copyright
©The Author(s) 2022.
World J Gastroenterol. Dec 7, 2022; 28(45): 6410-6420
Published online Dec 7, 2022. doi: 10.3748/wjg.v28.i45.6410
Published online Dec 7, 2022. doi: 10.3748/wjg.v28.i45.6410
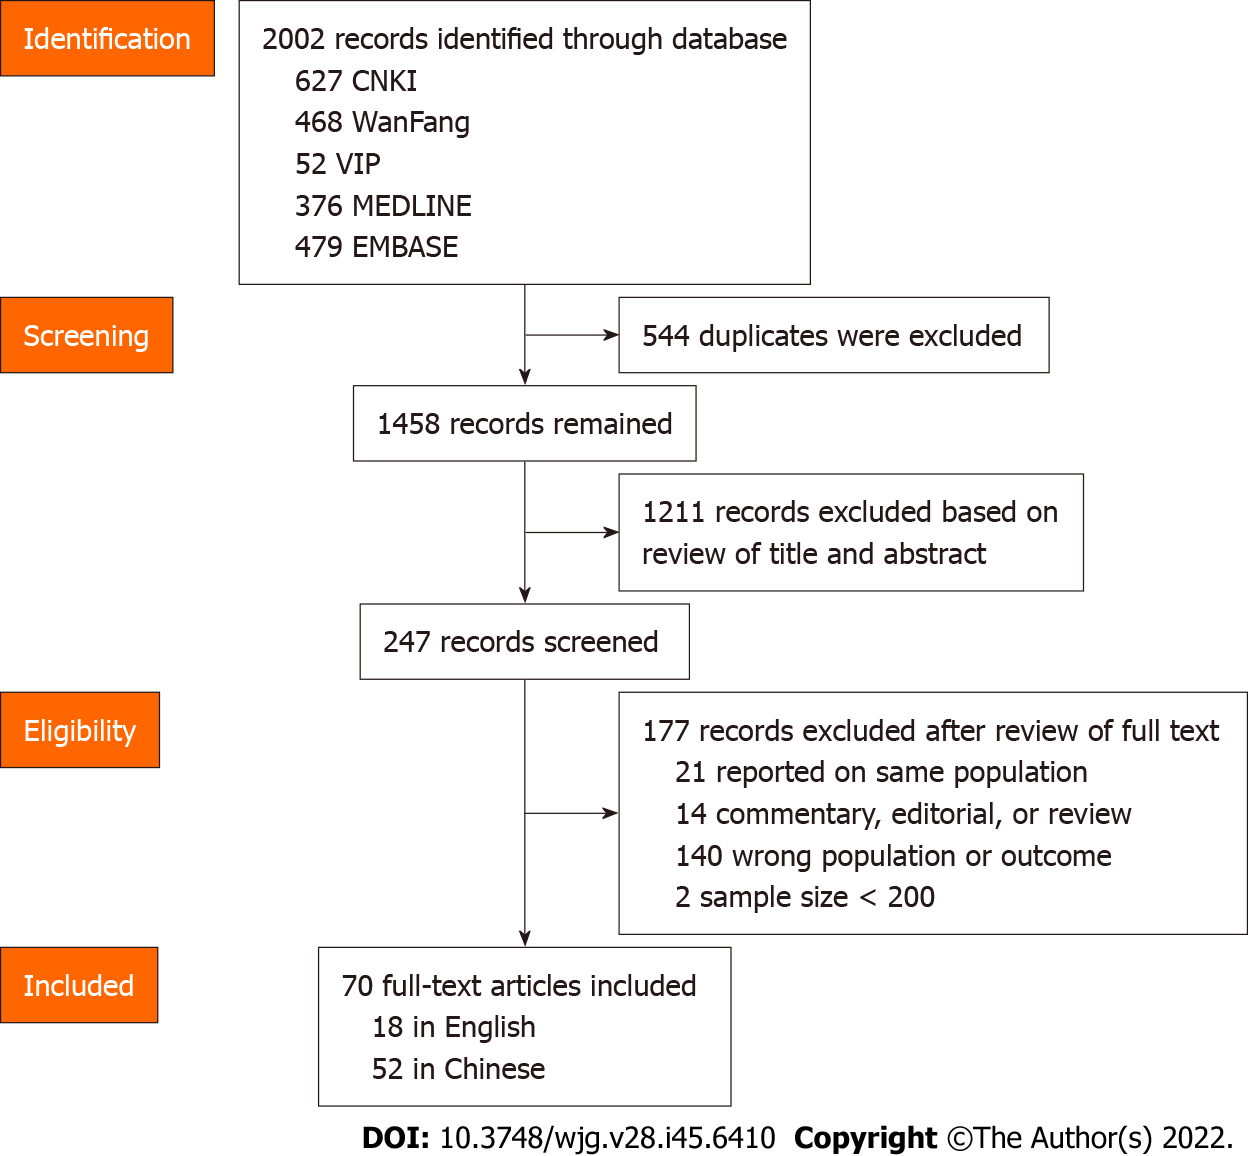
Figure 1 Flowchart of the selection of studies.
Figure 2 Prevalence of gastroesophageal reflux disease in different periods.
A: Violin diagram of the original prevalence; B: Line chart of the pooled prevalence.
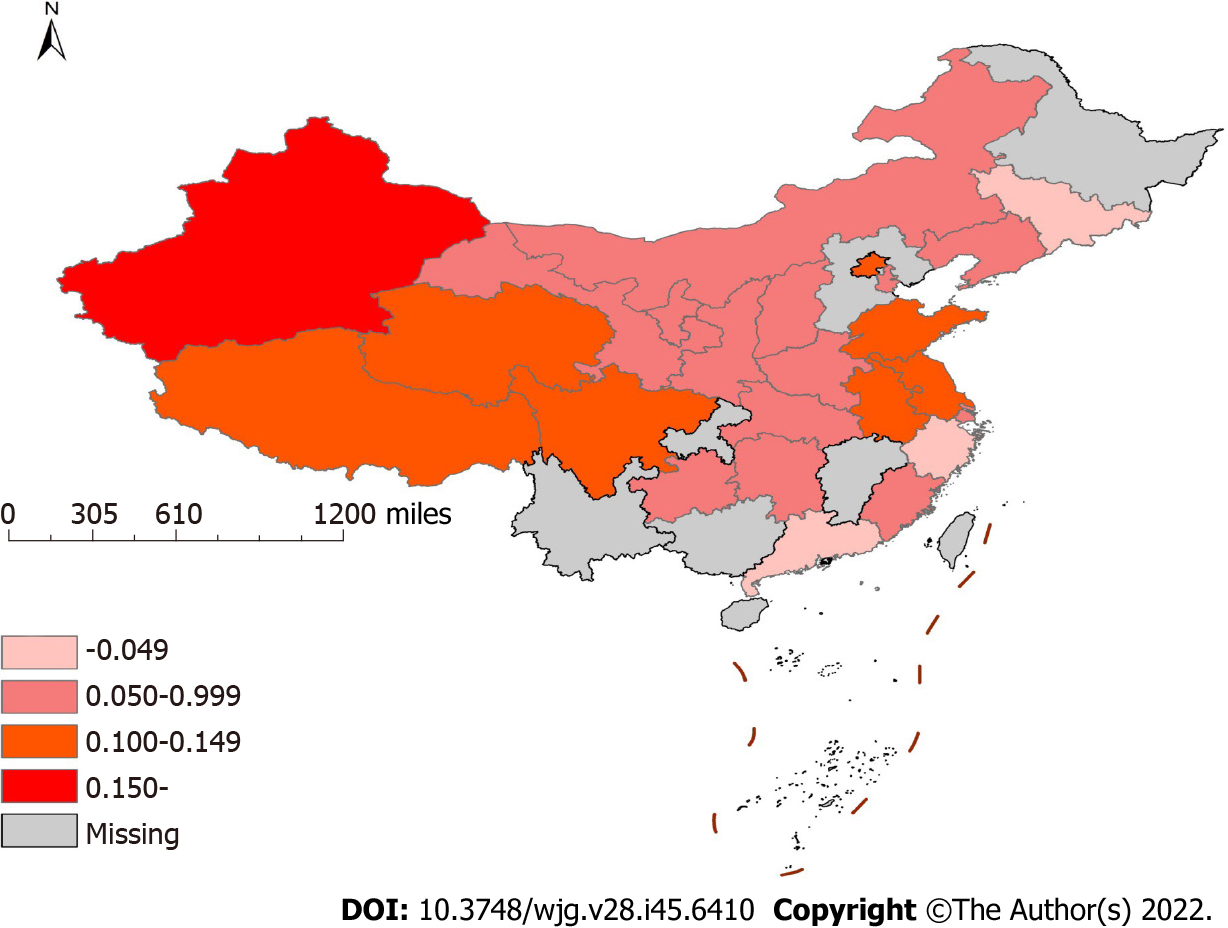
Figure 3 Prevalence of gastroesophageal reflux disease in different provinces of China.
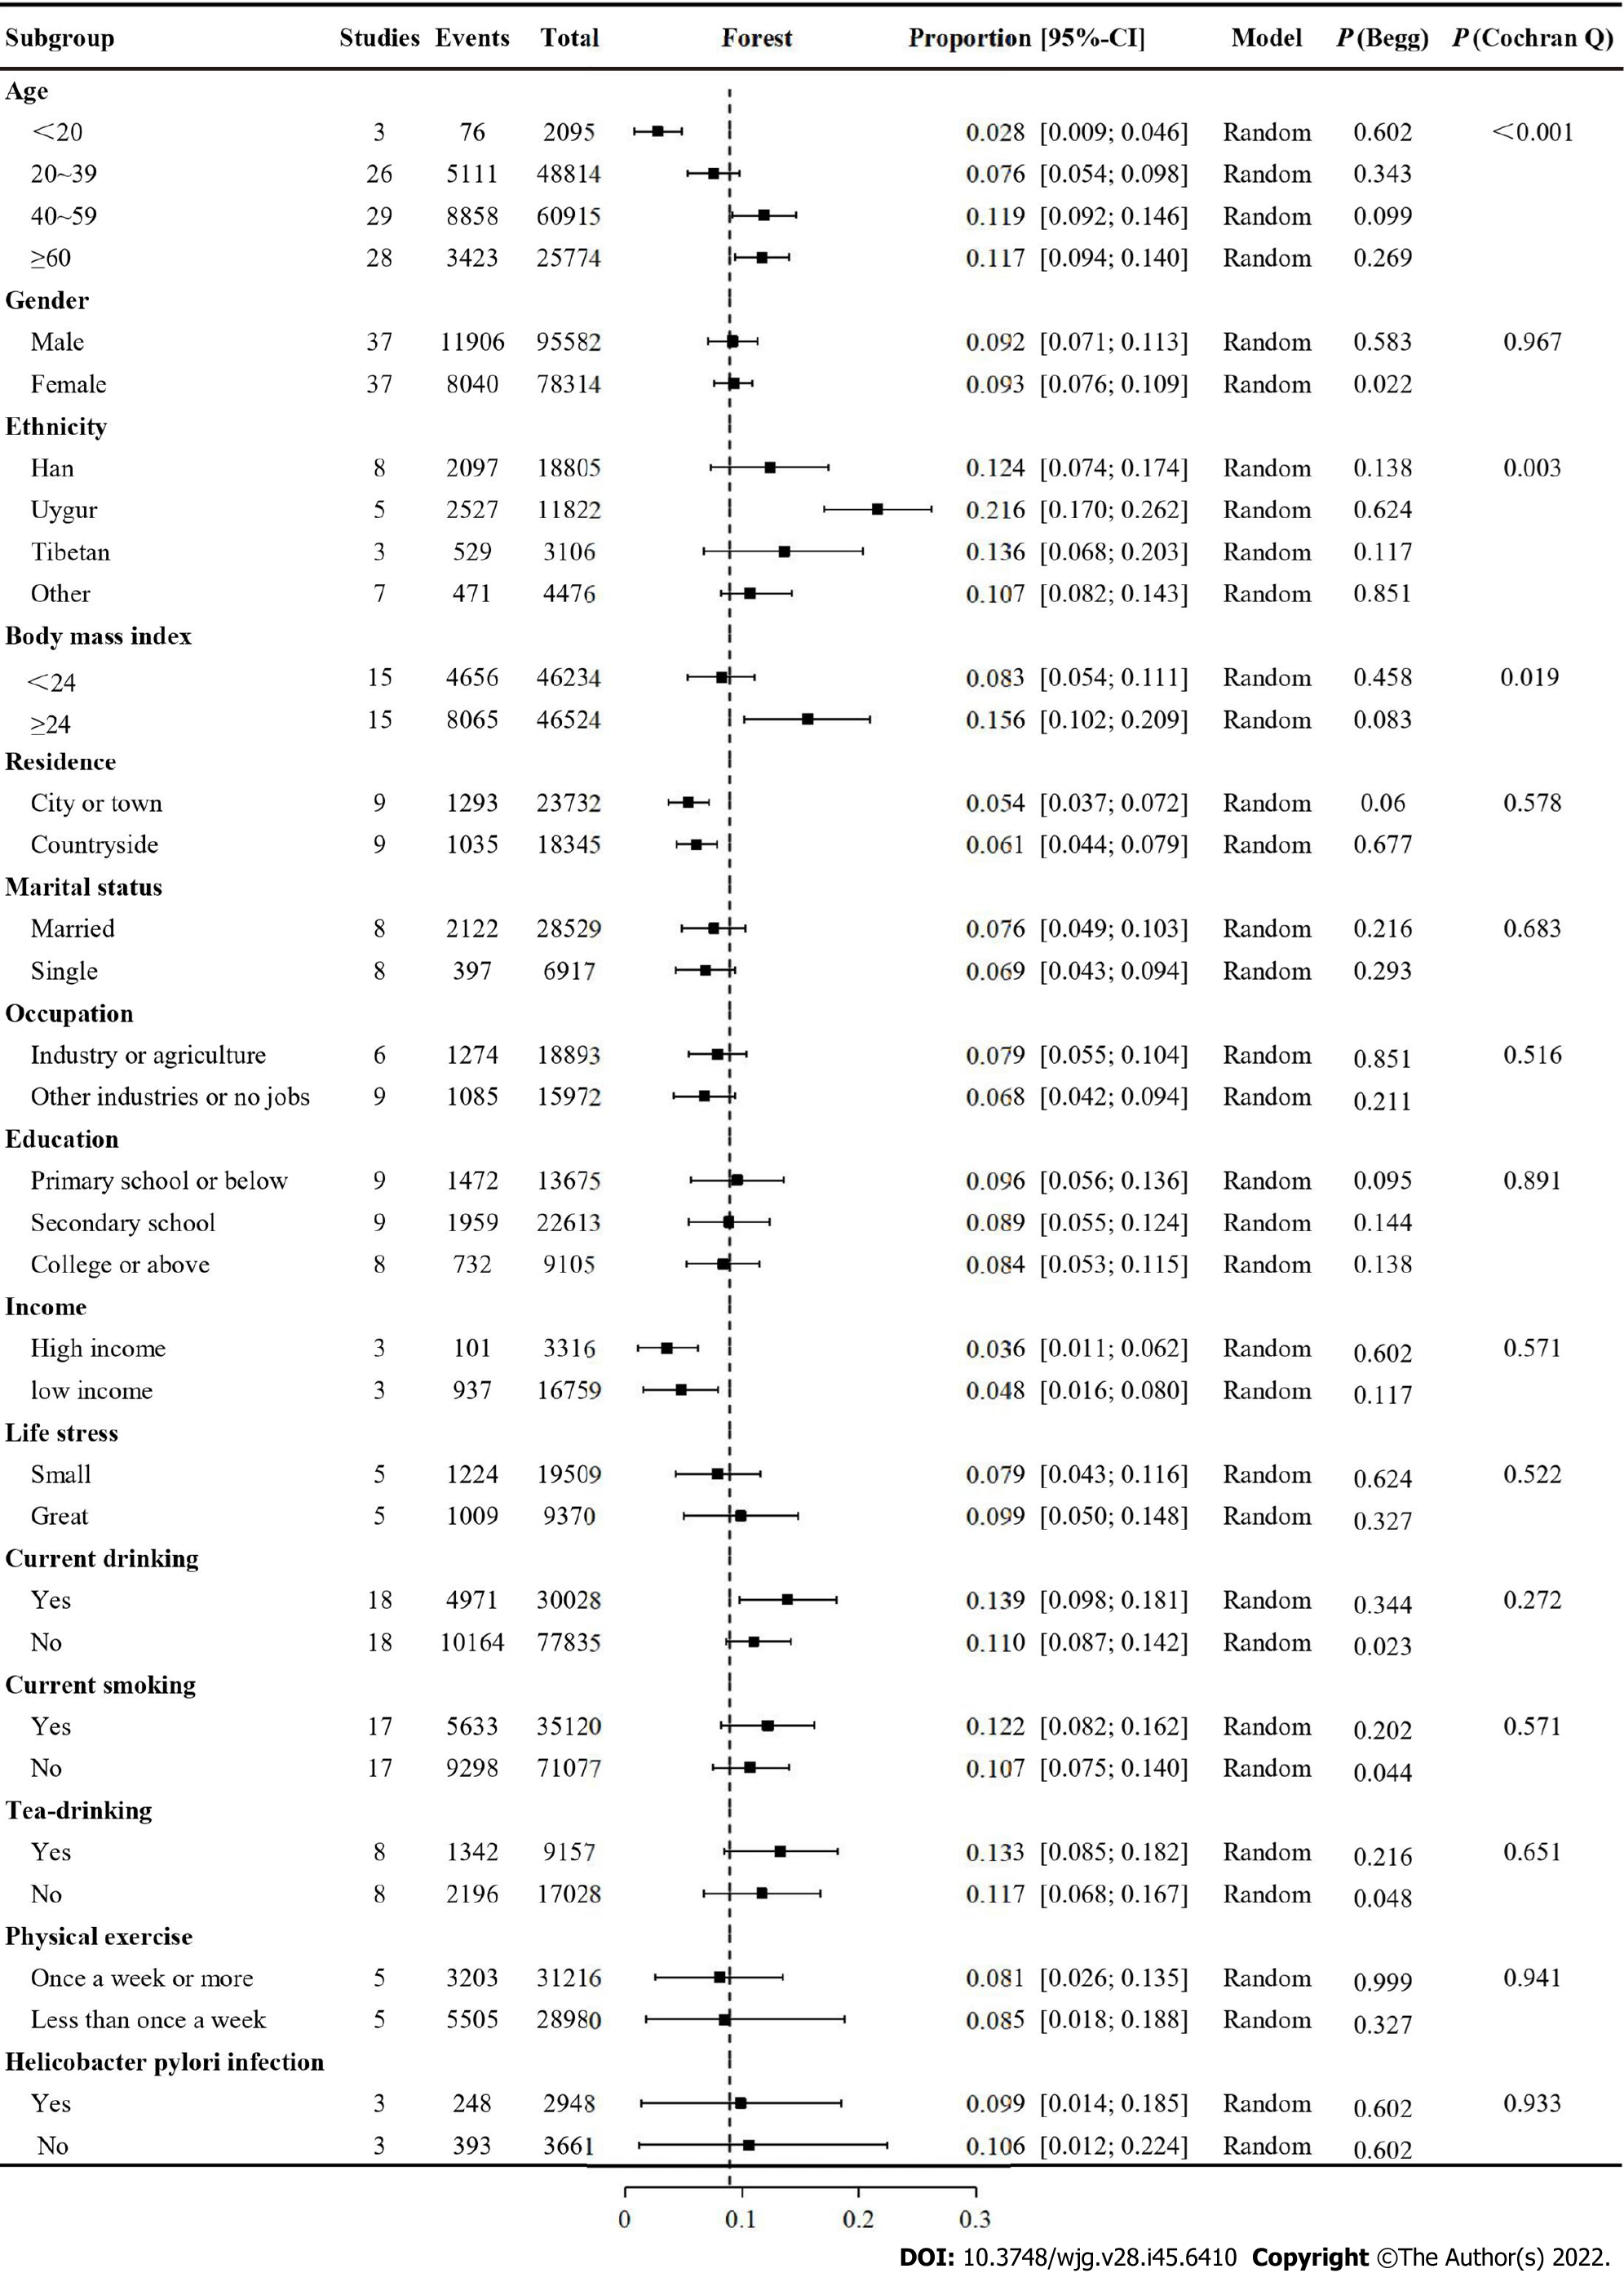
Figure 4 Forest plot for subgroup analysis by demographic data.
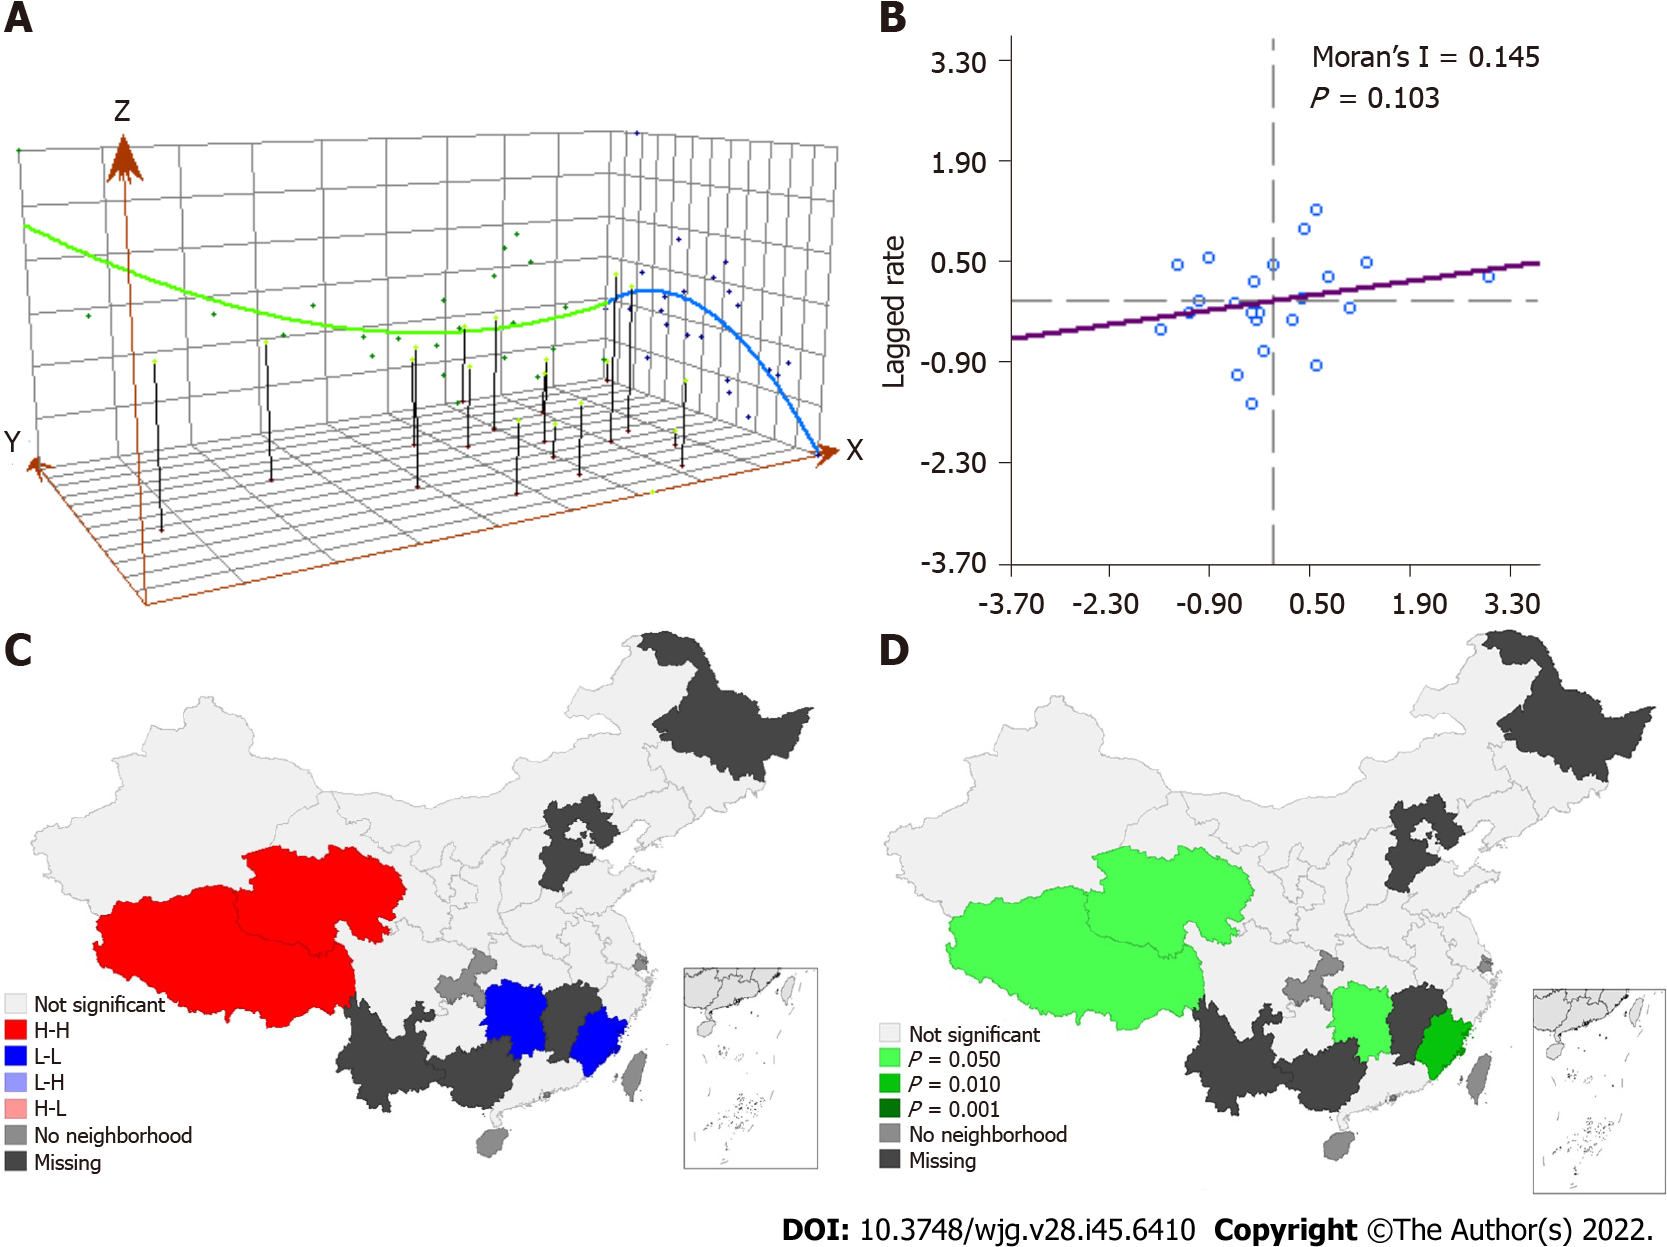
Figure 5 Spatial trend distribution of gastroesophageal reflux disease.
A: Trend Analysis; B: Moran-scatterplot; C: Lisa concentration map; D: Lisa significance map.
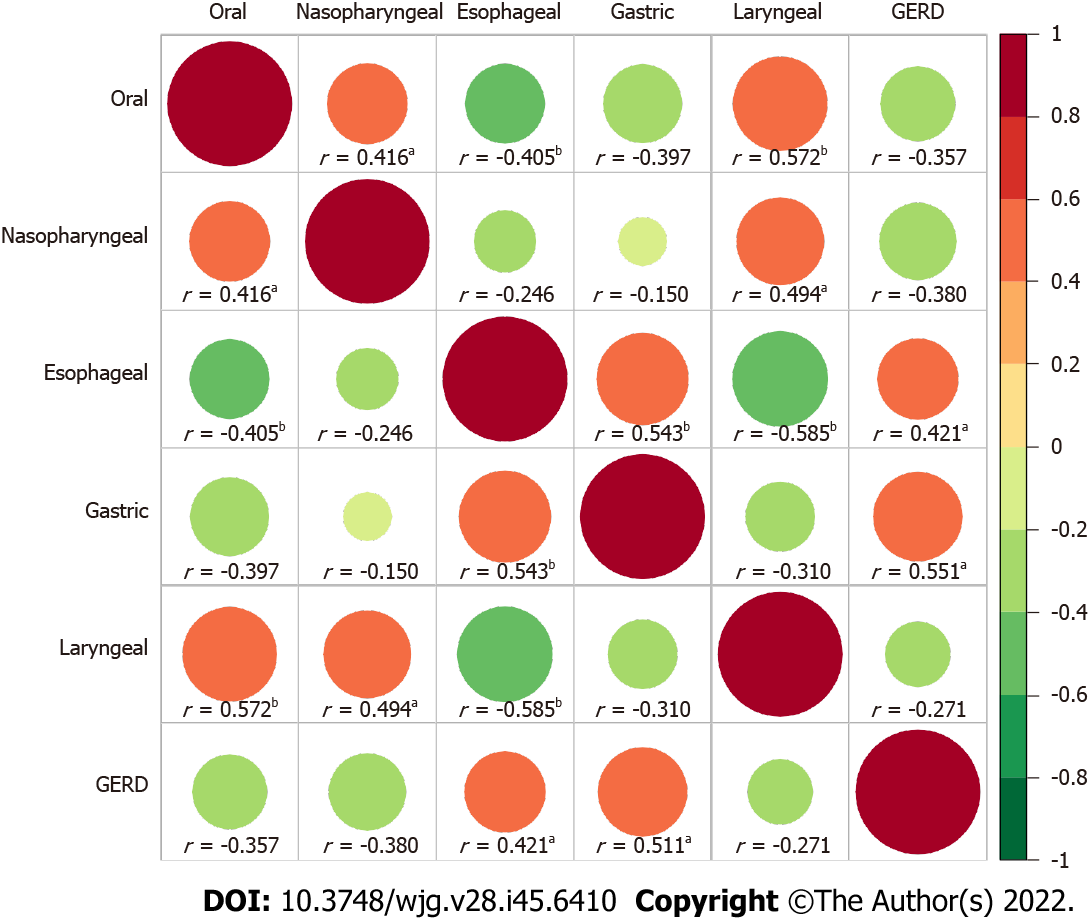
Figure 6 Correlation heat map of the relationship between gastroesophageal reflux disease and upper gastrointestinal tumors.
aP < 0.05, bP < 0.01.
- Citation: Lu TL, Li SR, Zhang JM, Chen CW. Meta-analysis on the epidemiology of gastroesophageal reflux disease in China. World J Gastroenterol 2022; 28(45): 6410-6420
- URL: https://www.wjgnet.com/1007-9327/full/v28/i45/6410.htm
- DOI: https://dx.doi.org/10.3748/wjg.v28.i45.6410


