Copyright
©The Author(s) 2022.
World J Gastroenterol. Nov 14, 2022; 28(42): 6068-6077
Published online Nov 14, 2022. doi: 10.3748/wjg.v28.i42.6068
Published online Nov 14, 2022. doi: 10.3748/wjg.v28.i42.6068
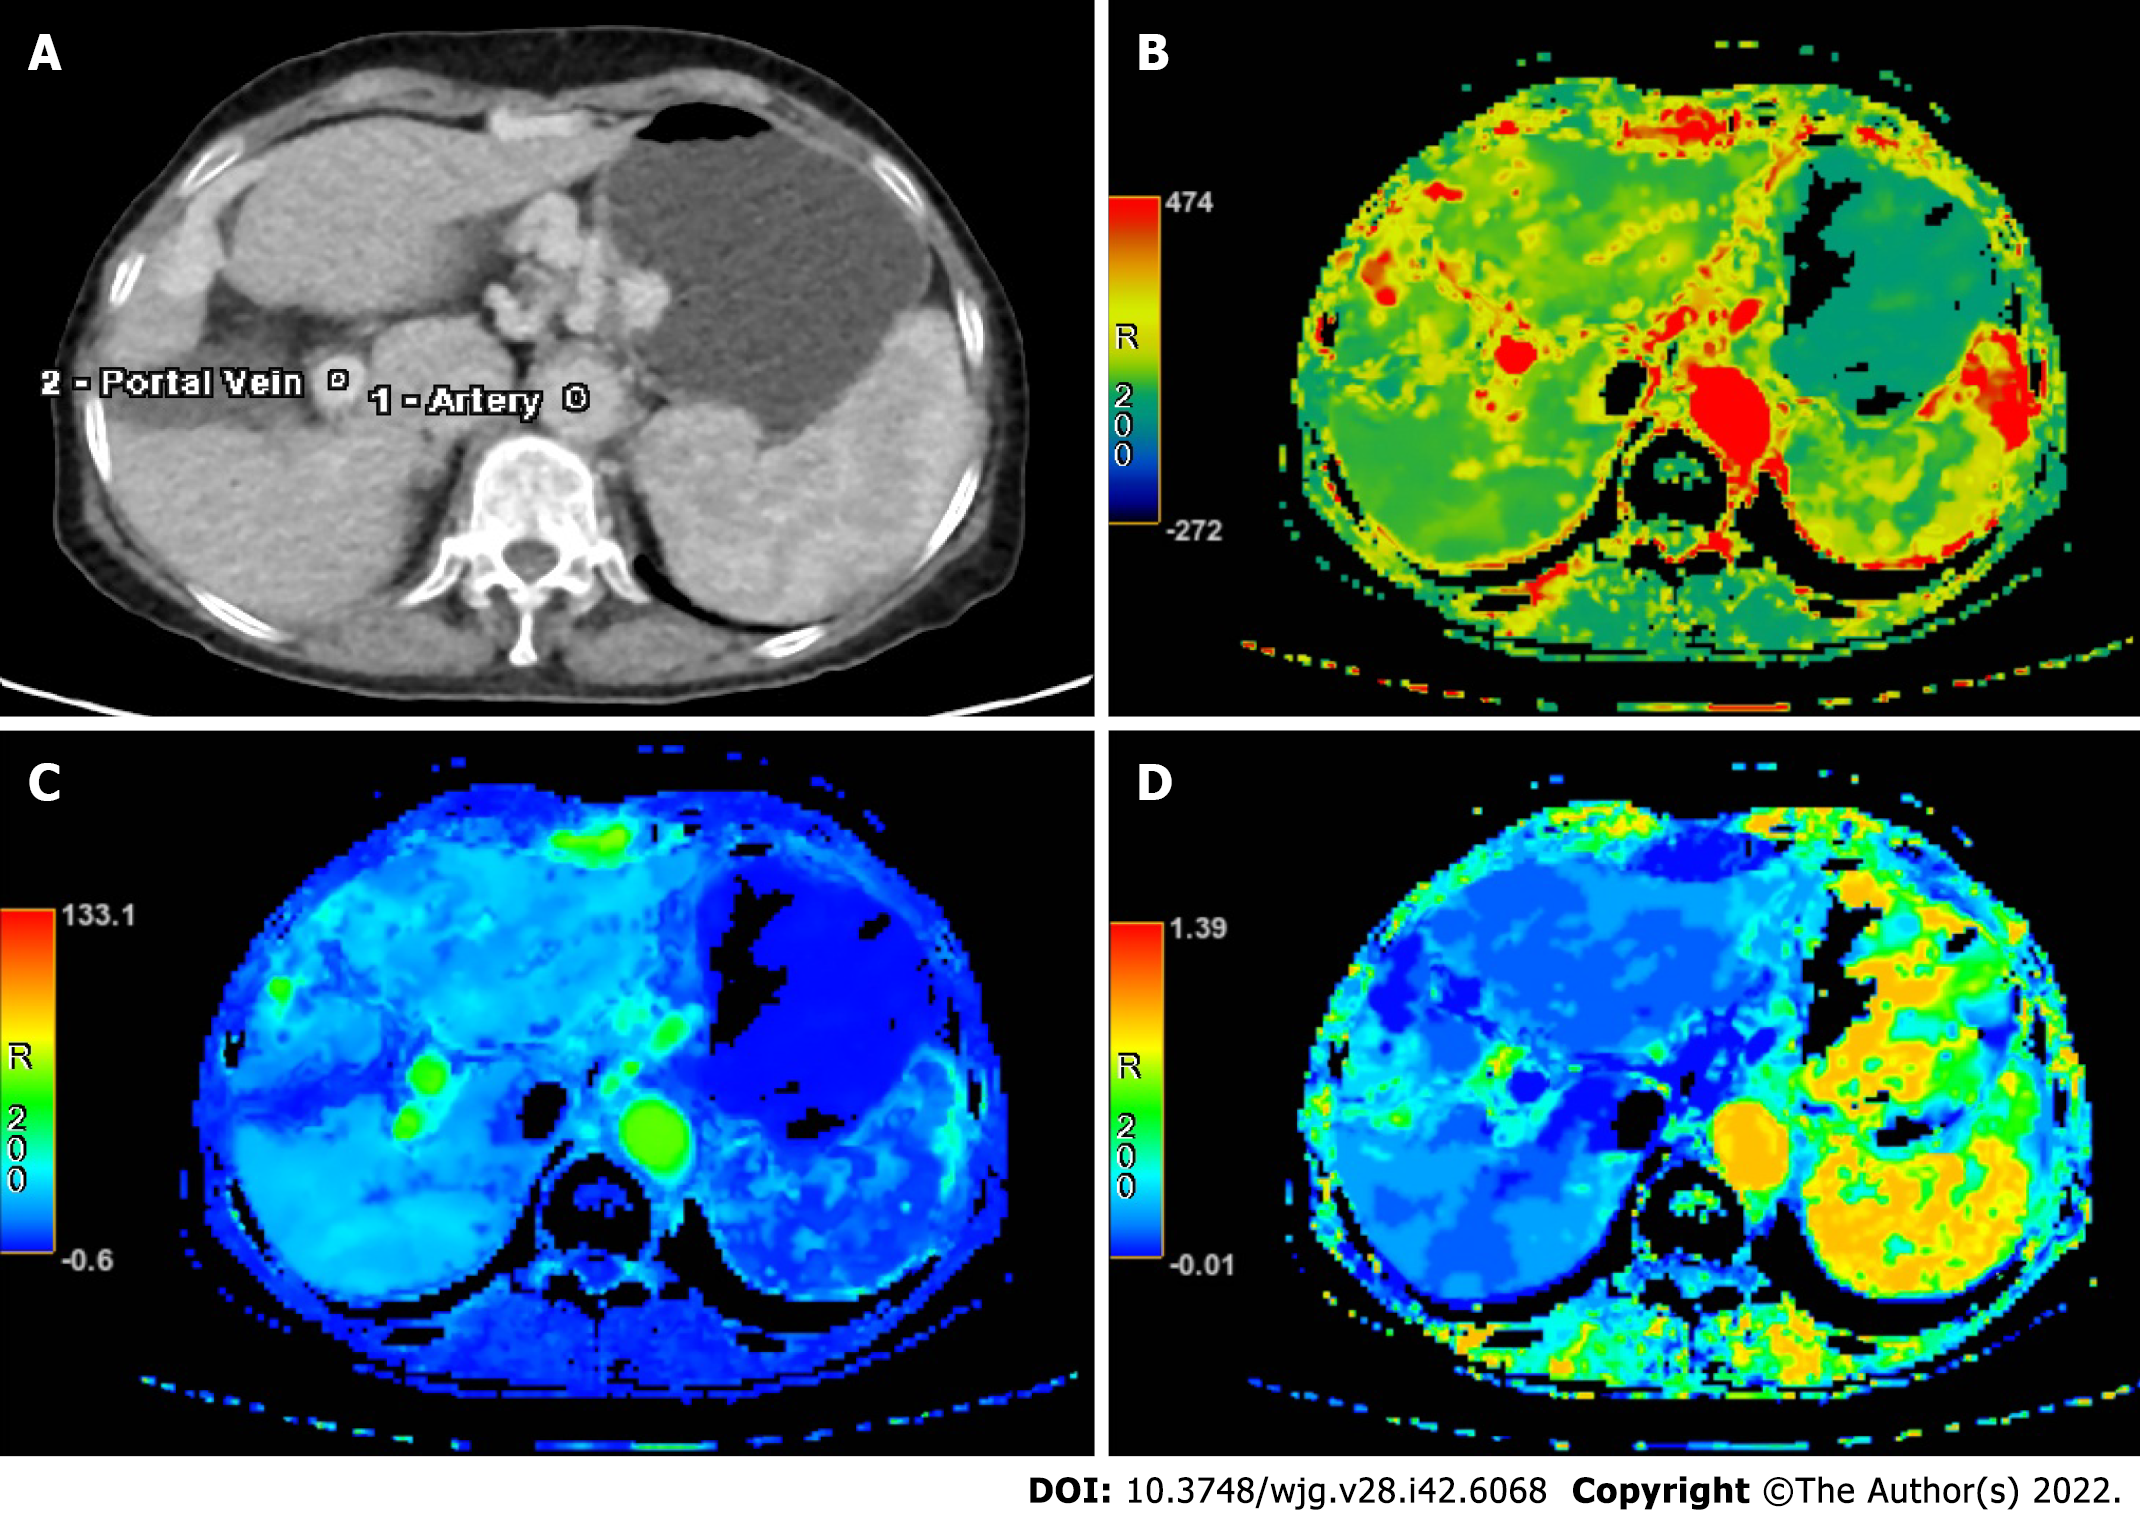
Figure 1 Computed tomography perfusion of the liver post-processing data.
A: Regions of interest were placed in the abdominal aorta and main portal vein as the input blood vessels for calculation of liver computed tomography perfusion; B-D: The parameters of liver computed tomography perfusion were calculated automatically to include hepatic artery fraction (B), liver blood flow (C), and liver blood volume (D).
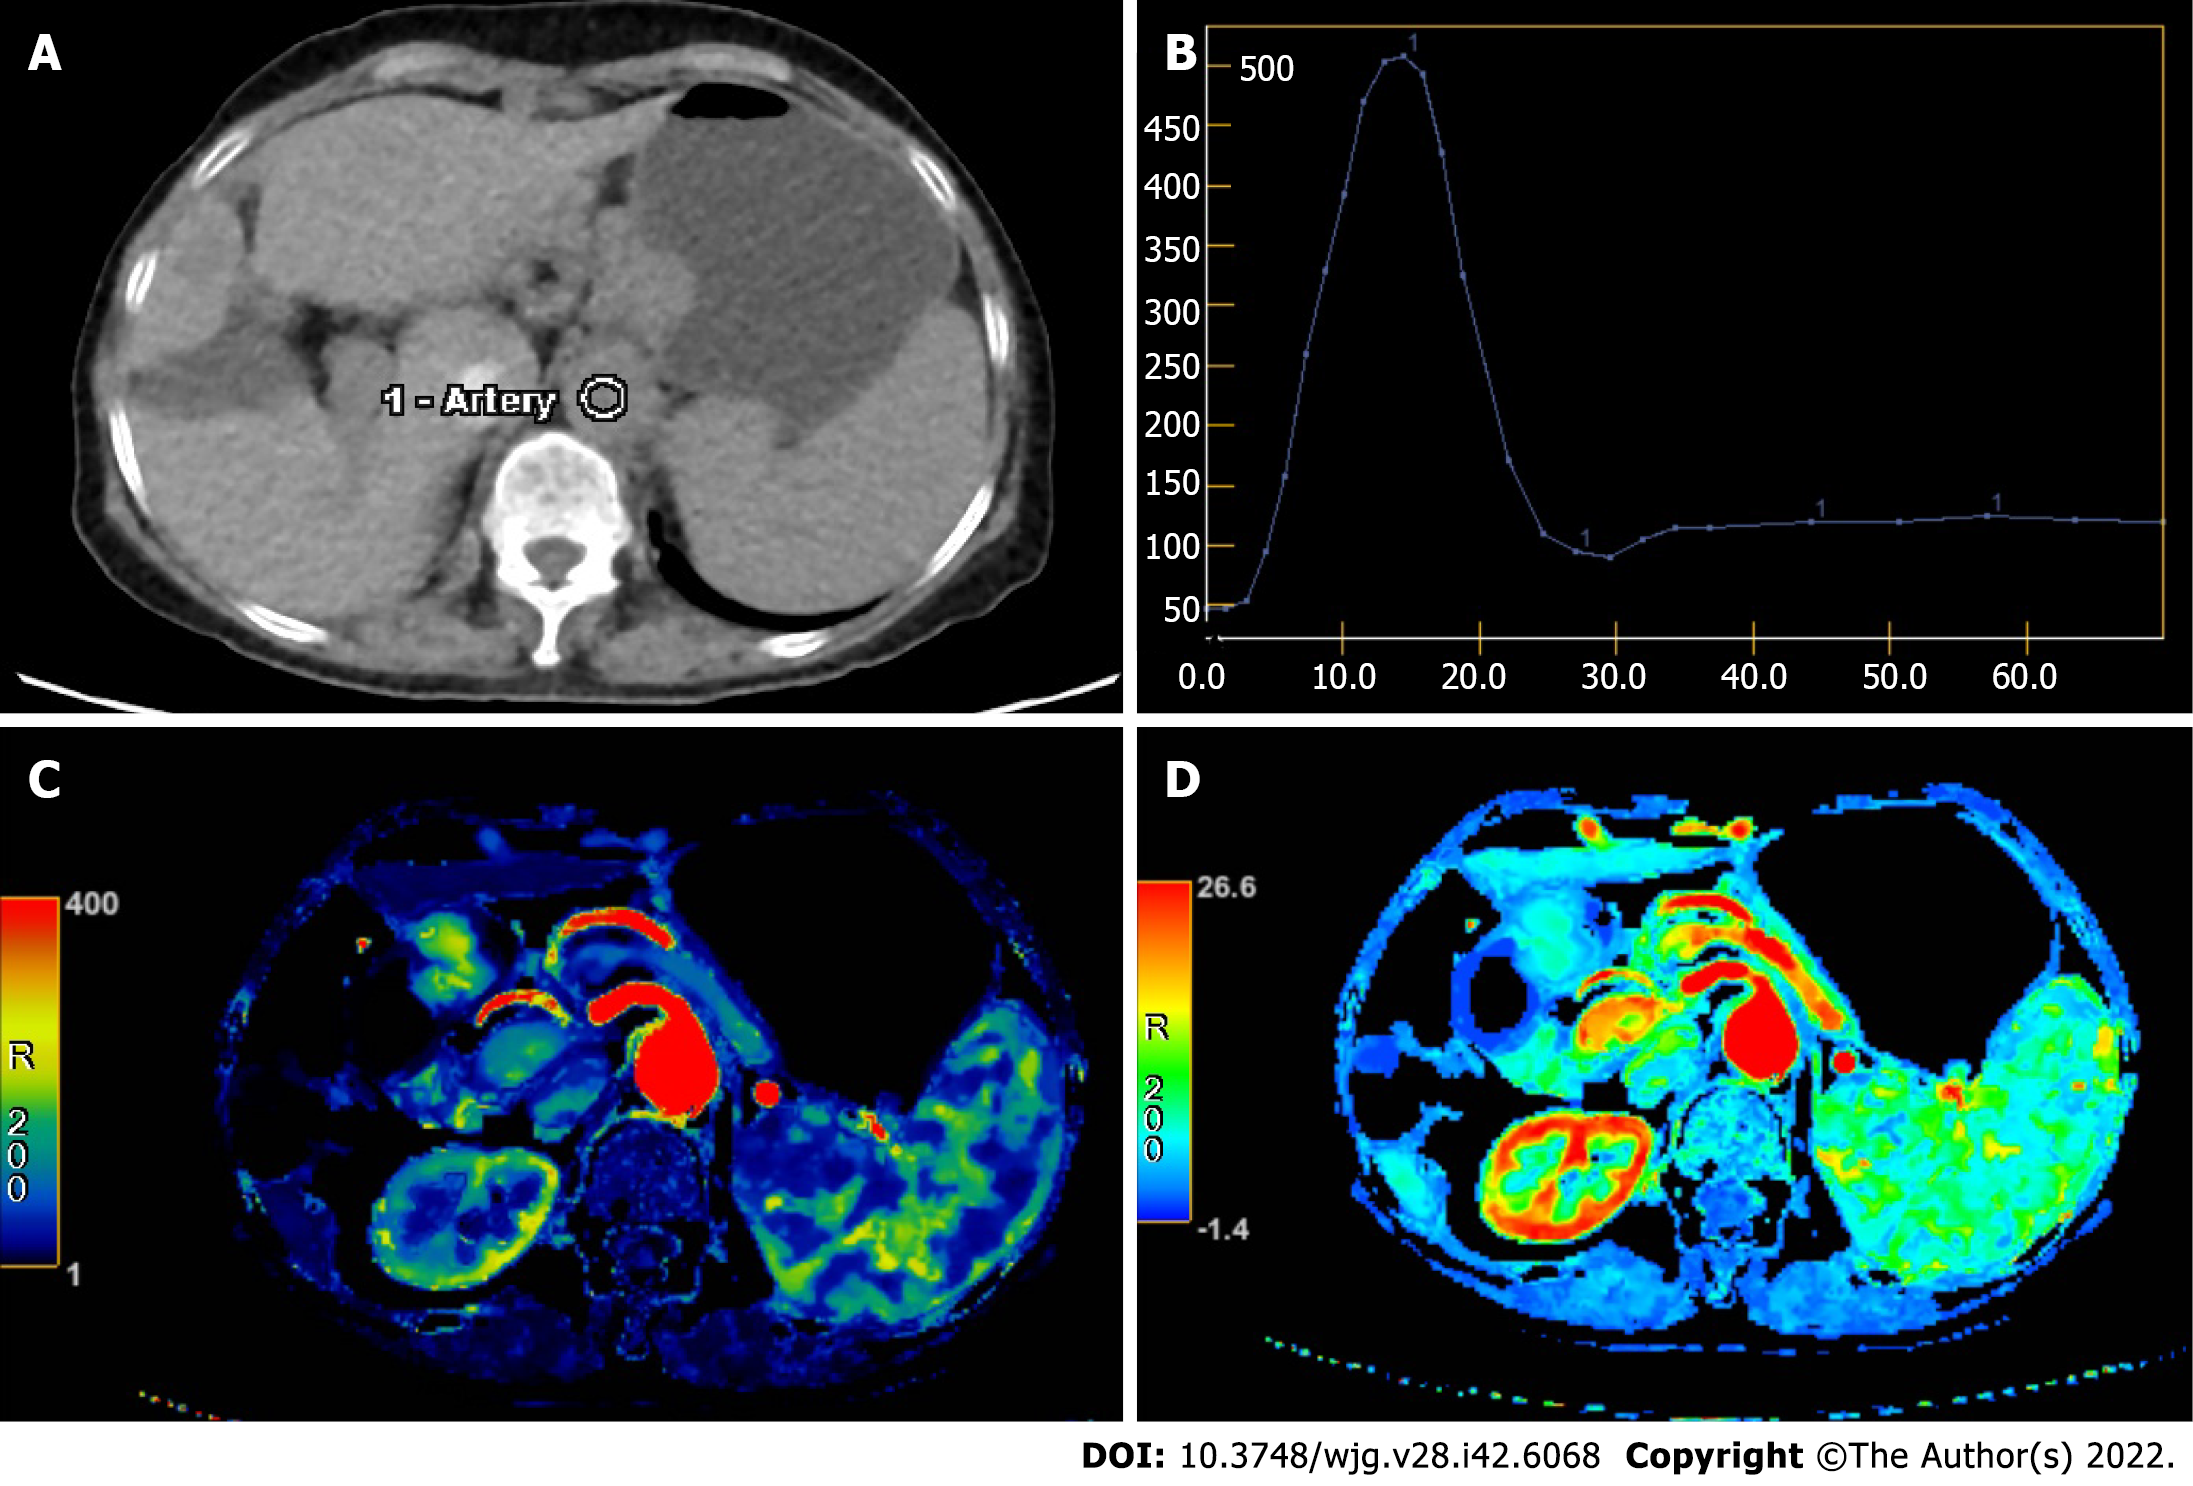
Figure 2 Computed tomography perfusion of the spleen post-processing data.
A: Regions of interest were placed in the abdominal aorta as the input blood vessel; B: The time-density curve was generated automatically for calculation of splenic perfusion; C and D: The parameters of computed tomography perfusion of the spleen were calculated automatically, including splenic blood flow (C) and splenic blood volume (D).
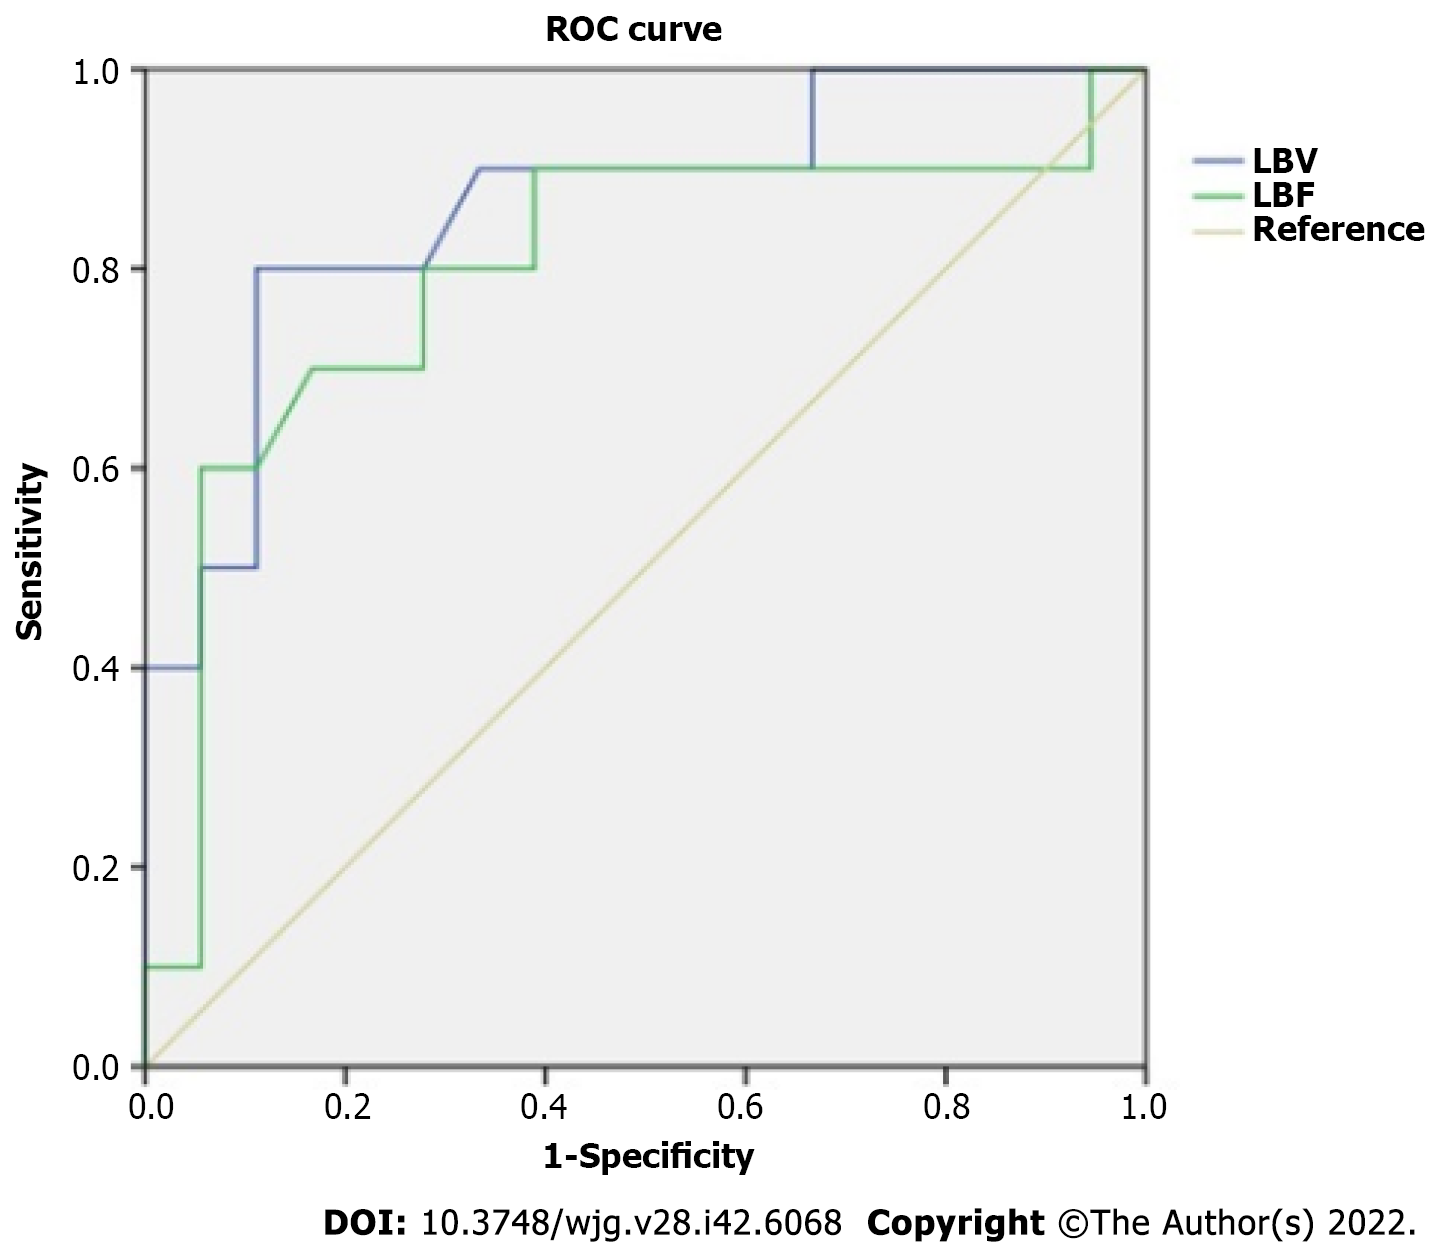
Figure 3 Receiver operating characteristic curves to differentiate moderate and severe portal hypertension.
For discriminating severe portal hypertension, liver blood volume had an area under the curve of 0.864 with a standard error of 0.075 [95% confidence interval (CI): 0.72-1.00], while liver blood flow had an area under the curve of 0.797 with a standard error of 0.100 (95%CI: 0.60-1.00). LBF: Liver blood flow; LBV: Liver blood volume; ROC: Receiver operating characteristic.
- Citation: Wang L, Zhang Y, Wu YF, Yue ZD, Fan ZH, Zhang CY, Liu FQ, Dong J. Computed tomography perfusion in liver and spleen for hepatitis B virus-related portal hypertension: A correlation study with hepatic venous pressure gradient. World J Gastroenterol 2022; 28(42): 6068-6077
- URL: https://www.wjgnet.com/1007-9327/full/v28/i42/6068.htm
- DOI: https://dx.doi.org/10.3748/wjg.v28.i42.6068


