Copyright
©The Author(s) 2022.
World J Gastroenterol. Nov 14, 2022; 28(42): 6045-6055
Published online Nov 14, 2022. doi: 10.3748/wjg.v28.i42.6045
Published online Nov 14, 2022. doi: 10.3748/wjg.v28.i42.6045
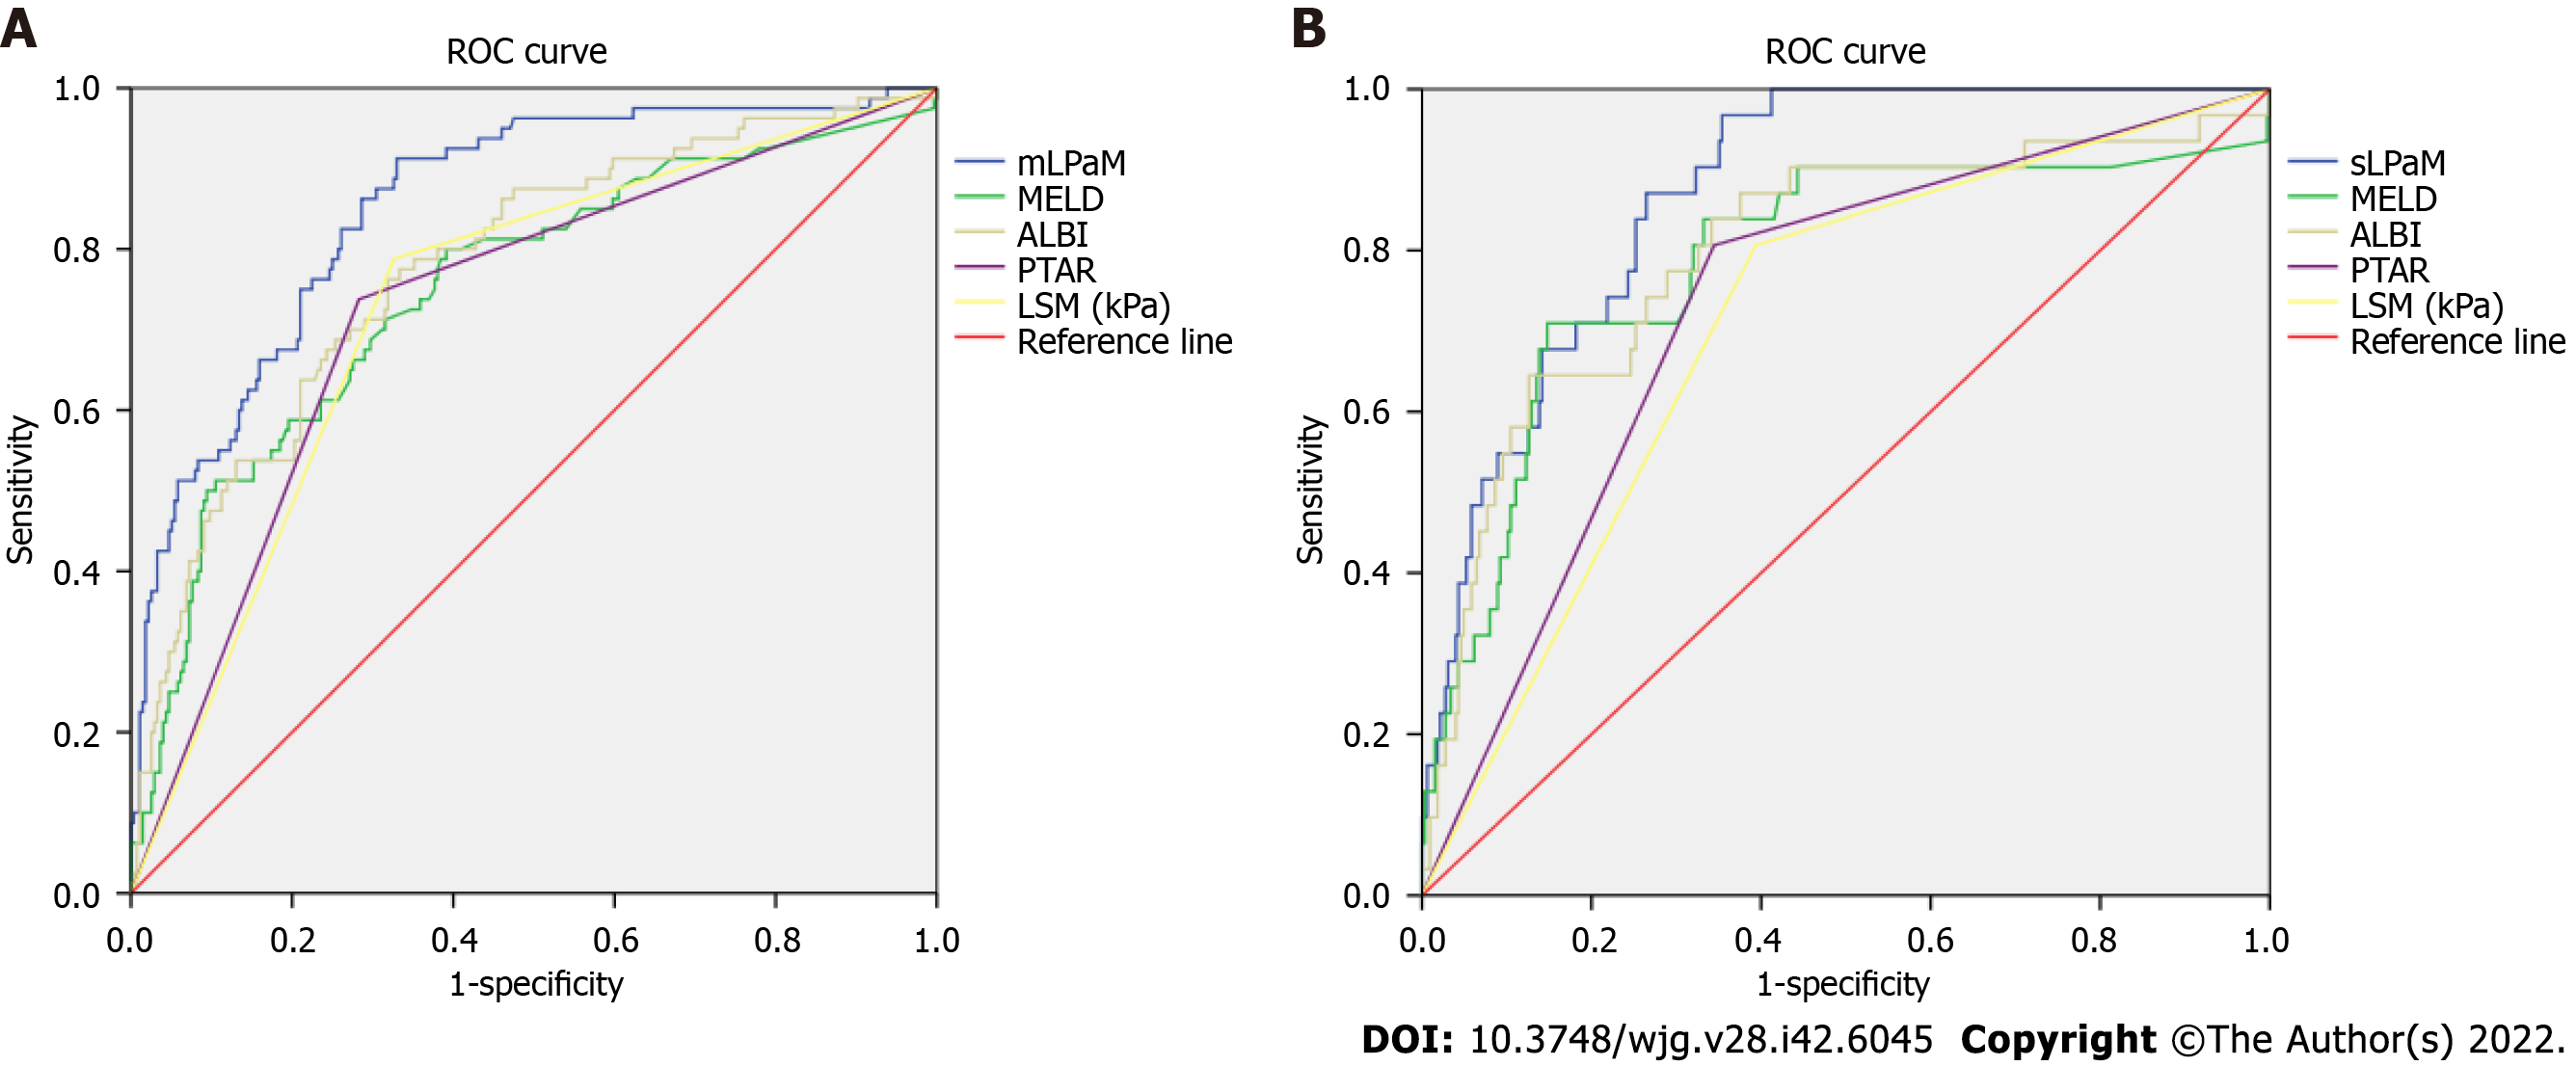
Figure 1 Comparison of different liver reserve function assessment methods by receiver operator characteristic curves in the training cohort.
A: mLPaM is indocyanine green retention rate at 15 min (ICGR15) ≥ 10%; B: sLPaM is ICGR15 ≥ 20%. ROC: Receiver operator characteristic; MELD: Model for end-stage liver disease; ALBI: Albumin-bilirubin grade; PTAR: Prothrombin time international normalized ratio to albumin ratio; LSM: Liver stiffness measurement; mLPaM: Mildly impaired liver reserve function model; sLPaM: Severely impaired liver reserve function model.
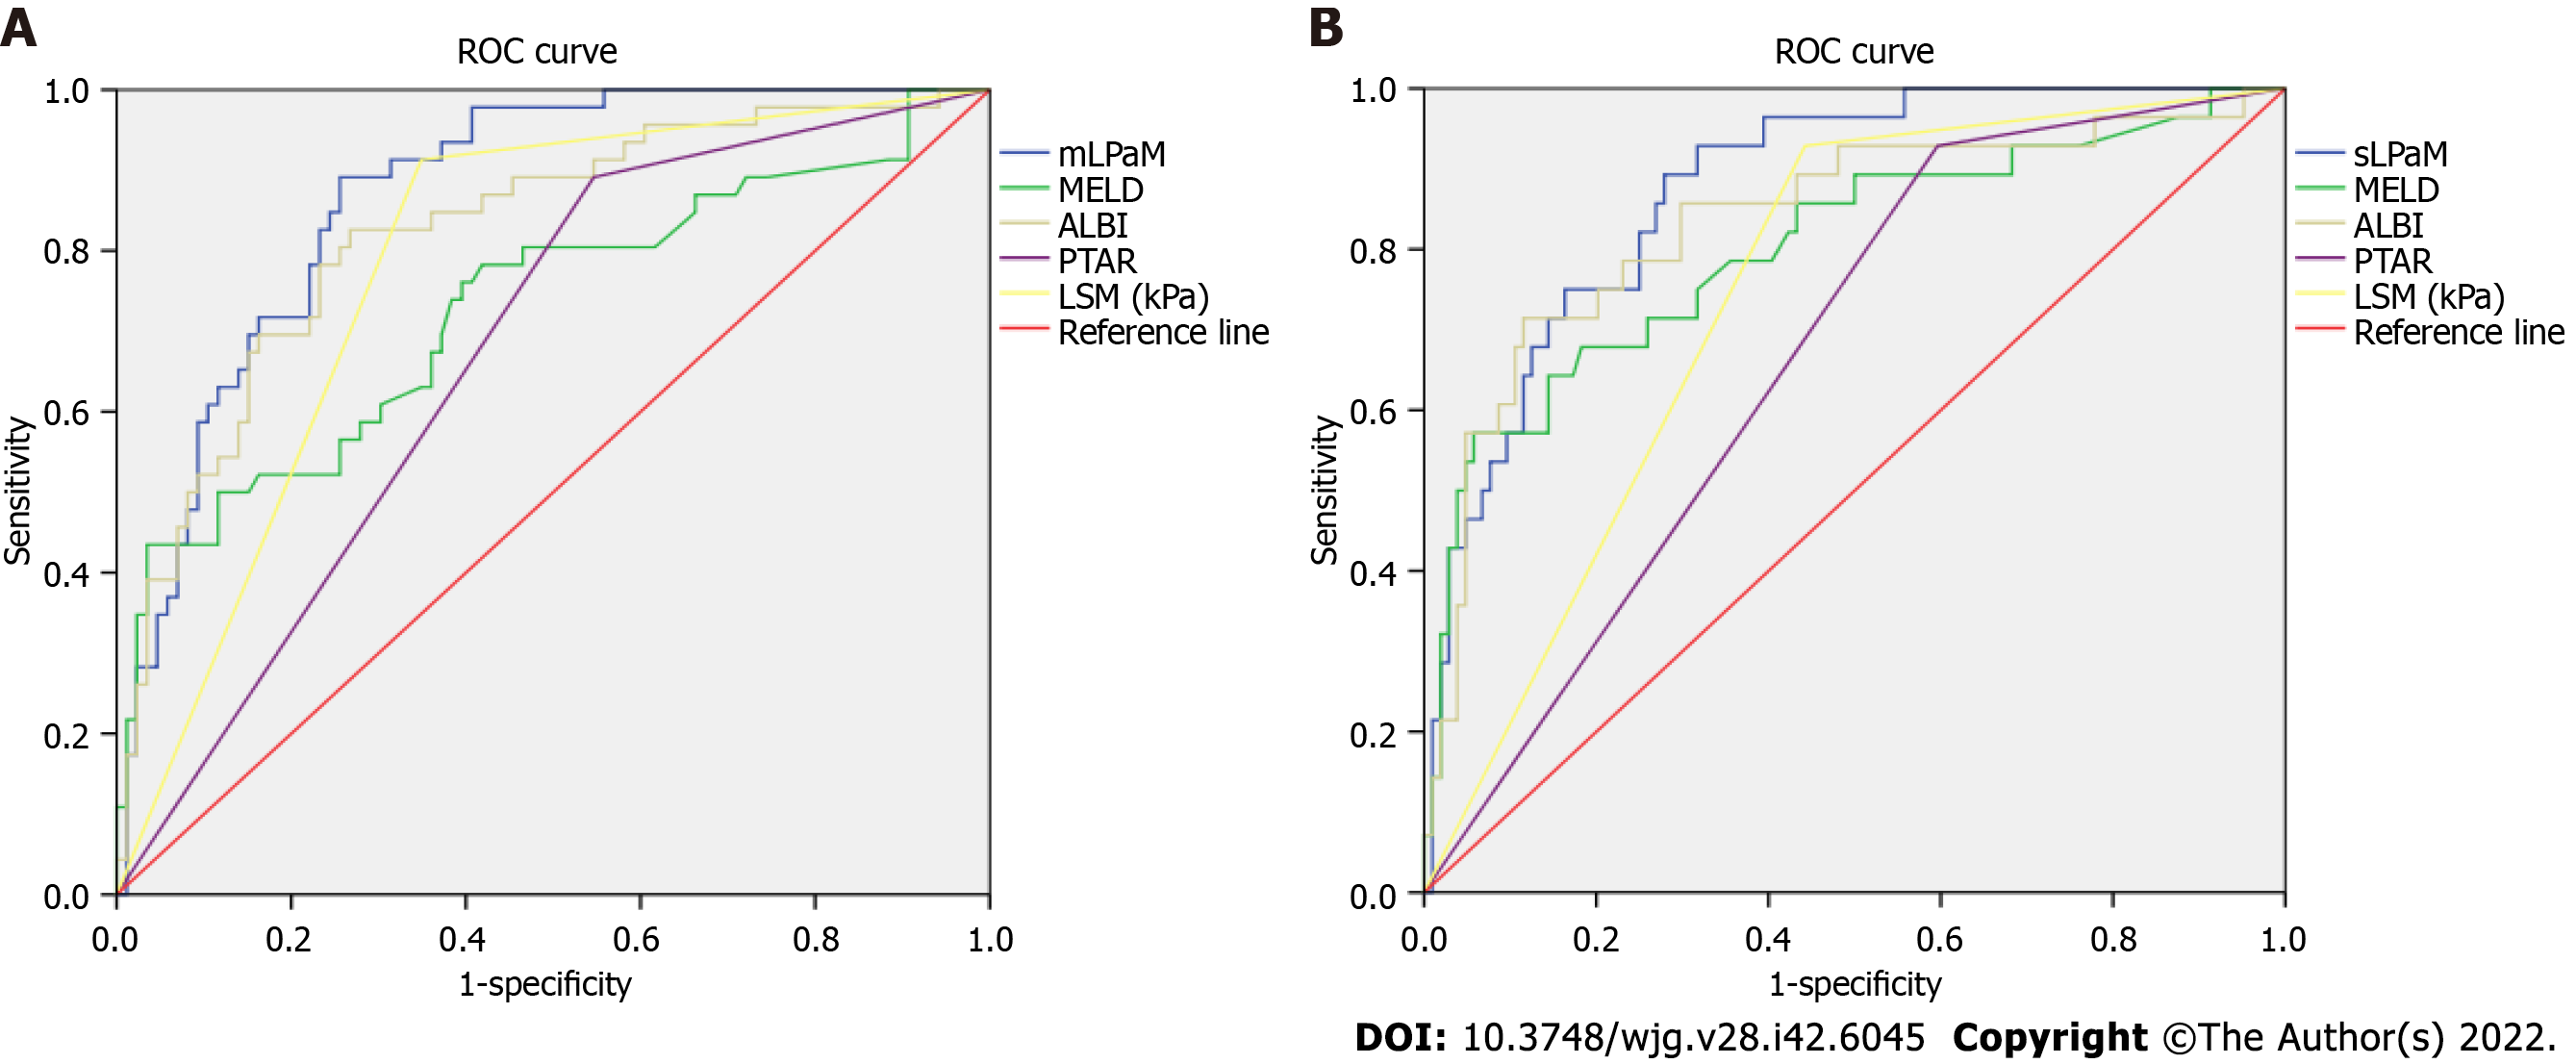
Figure 2 Comparison of different liver reserve function assessment methods by area under the curves in the validation cohort.
A: mLPaM is indocyanine green retention rate at 15 min (ICGR15) ≥ 10%; B: sLPaM is ICGR15 ≥ 20%. ROC: Receiver operator characteristic; MELD: Model for end-stage liver disease; ALBI: Albumin-bilirubin grade; PTAR: Prothrombin time international normalized ratio to albumin ratio; LSM: Liver stiffness measurement; mLPaM: Mildly impaired liver reserve function model; sLPaM: Severely impaired liver reserve function model.
- Citation: Lai RM, Wang MM, Lin XY, Zheng Q, Chen J. Clinical value of predictive models based on liver stiffness measurement in predicting liver reserve function of compensated chronic liver disease. World J Gastroenterol 2022; 28(42): 6045-6055
- URL: https://www.wjgnet.com/1007-9327/full/v28/i42/6045.htm
- DOI: https://dx.doi.org/10.3748/wjg.v28.i42.6045


