Copyright
©The Author(s) 2022.
World J Gastroenterol. Nov 7, 2022; 28(41): 5931-5943
Published online Nov 7, 2022. doi: 10.3748/wjg.v28.i41.5931
Published online Nov 7, 2022. doi: 10.3748/wjg.v28.i41.5931
Figure 1 Examples of artifact-infested endoscopy images used in our current study.
A: Presence of cloudy liquid and specular reflections; B: Presence of bubbles and low contrast between lesion tissue and normal tissues; C: Presence of fecal residue; D: Presence of bubbles and specular reflections.
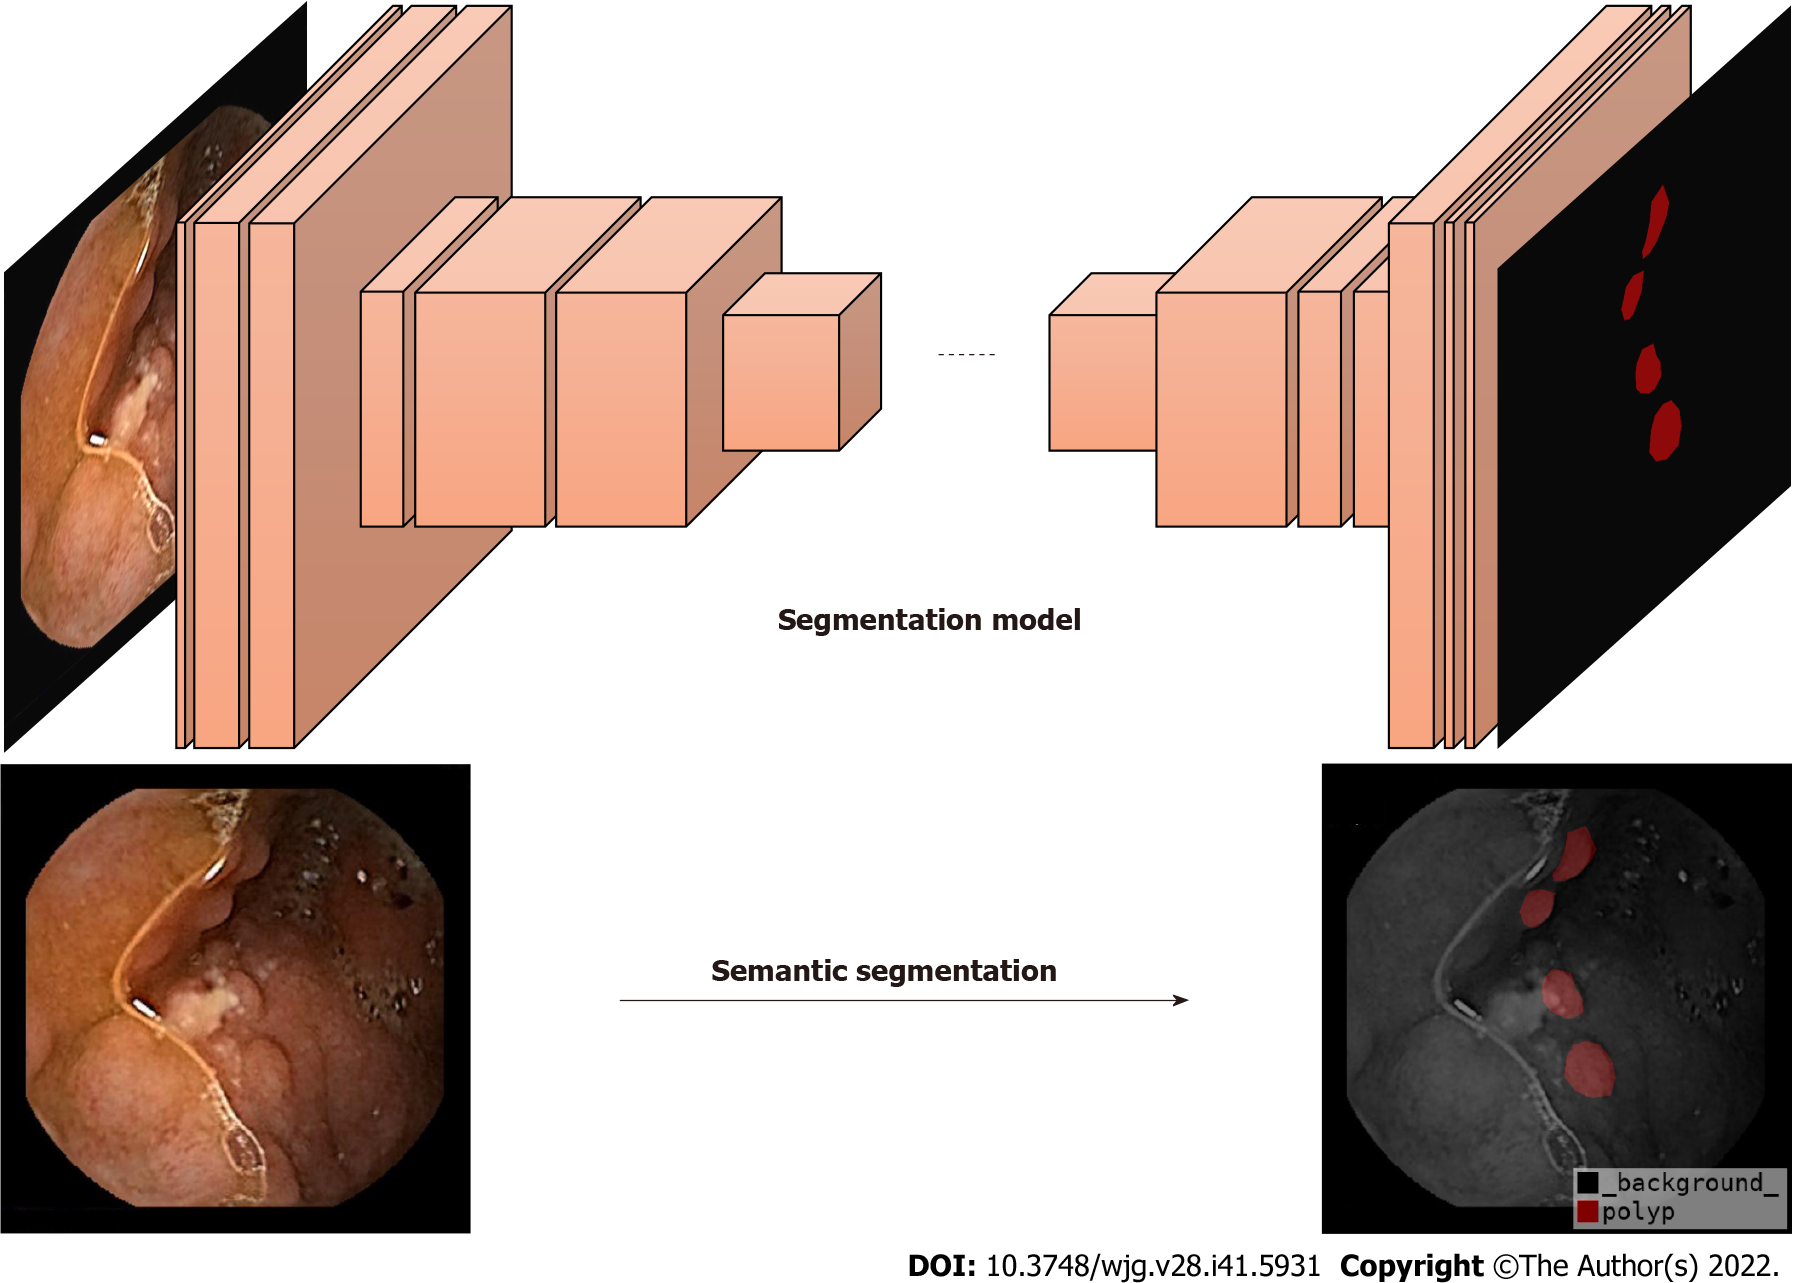
Figure 2 Semantic segmentation problem in the field of computer vision.
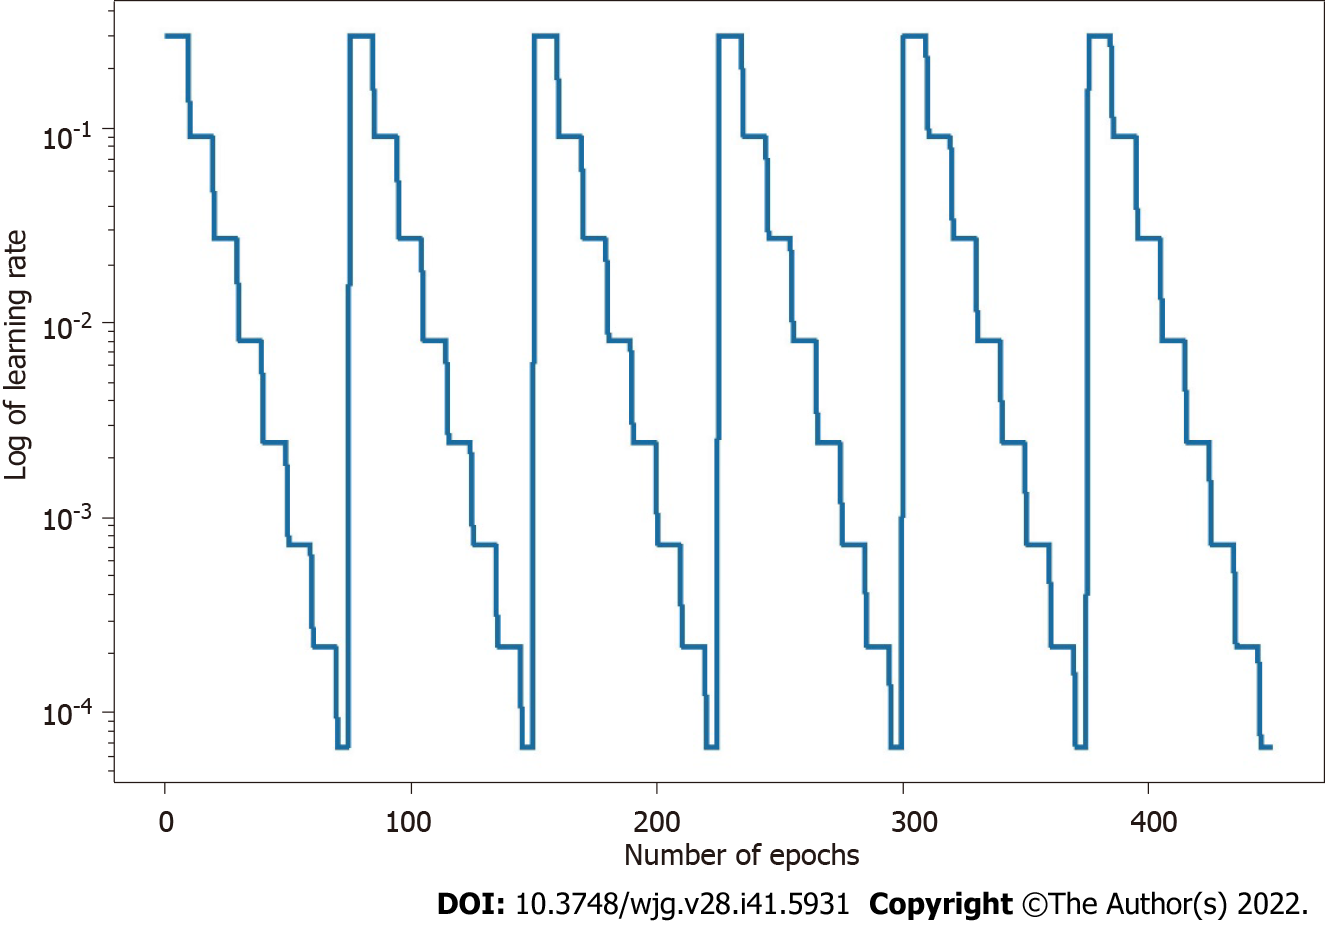
Figure 3 Learning rate for each epoch in the snapshot ensemble learning, with γ and α0 set for 0.
3, M for 10, and T for 75.
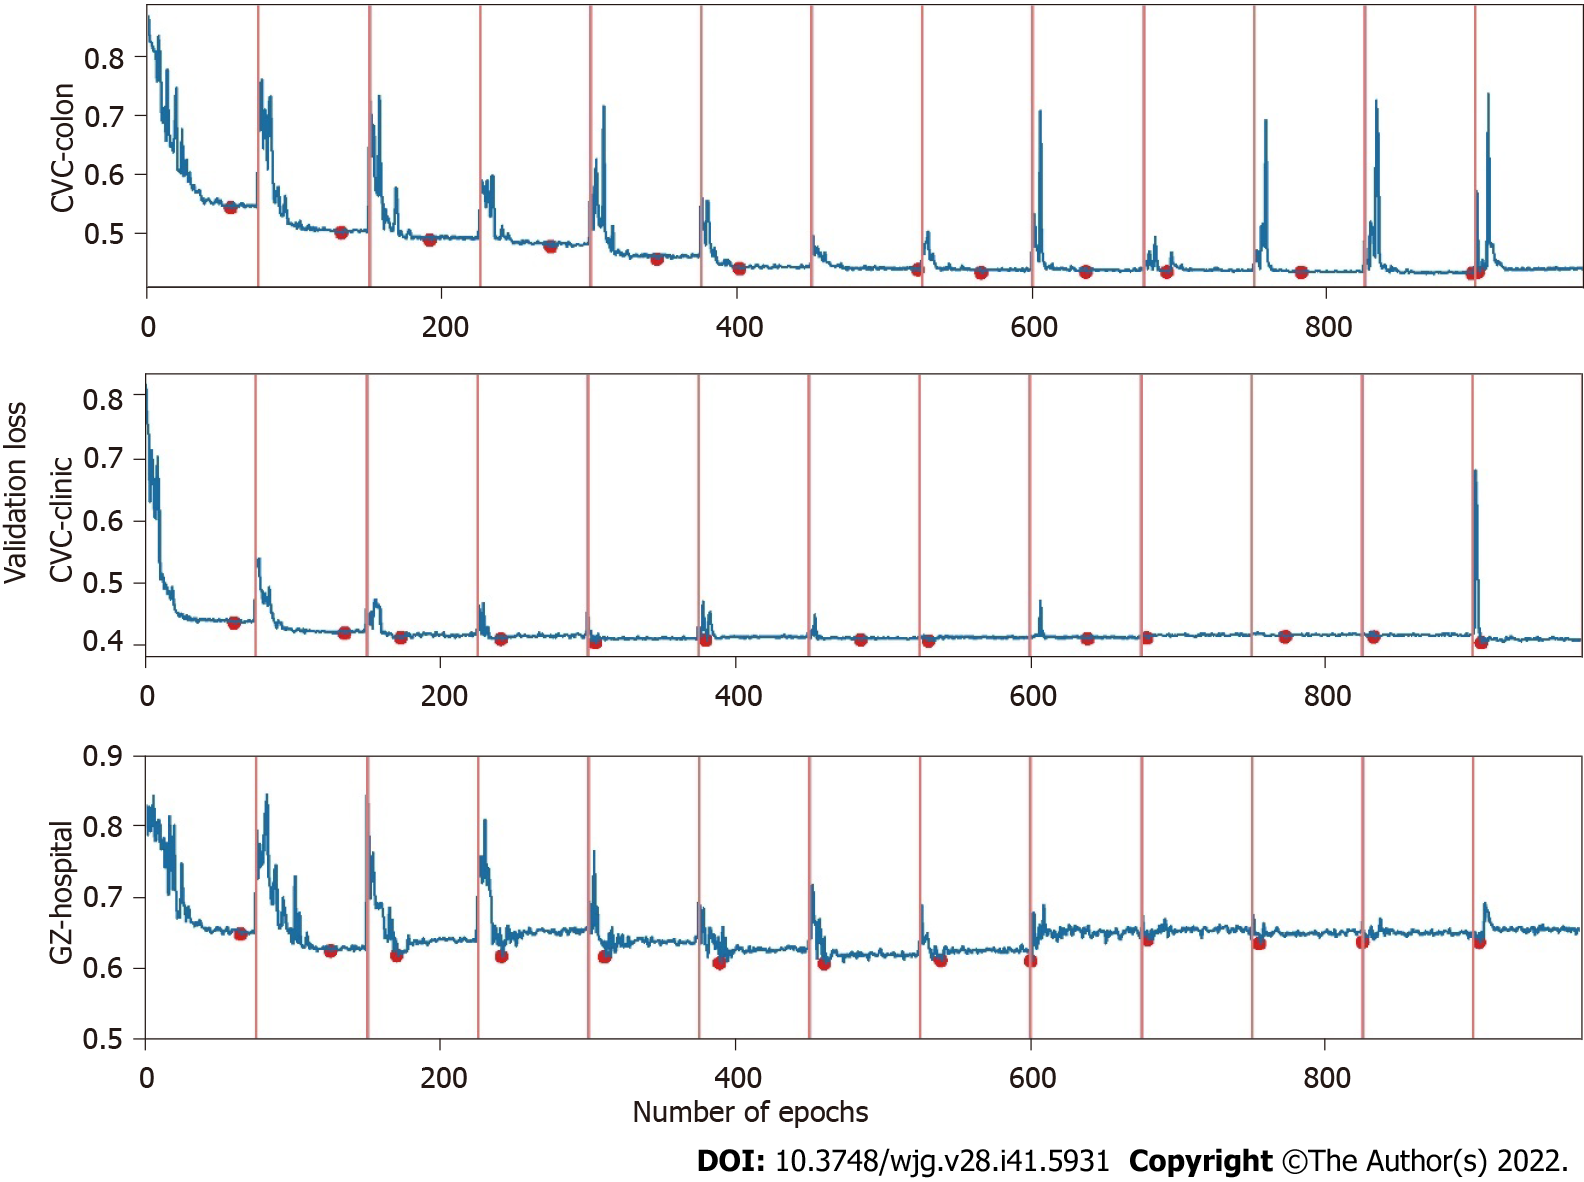
Figure 4 Validation loss in training.
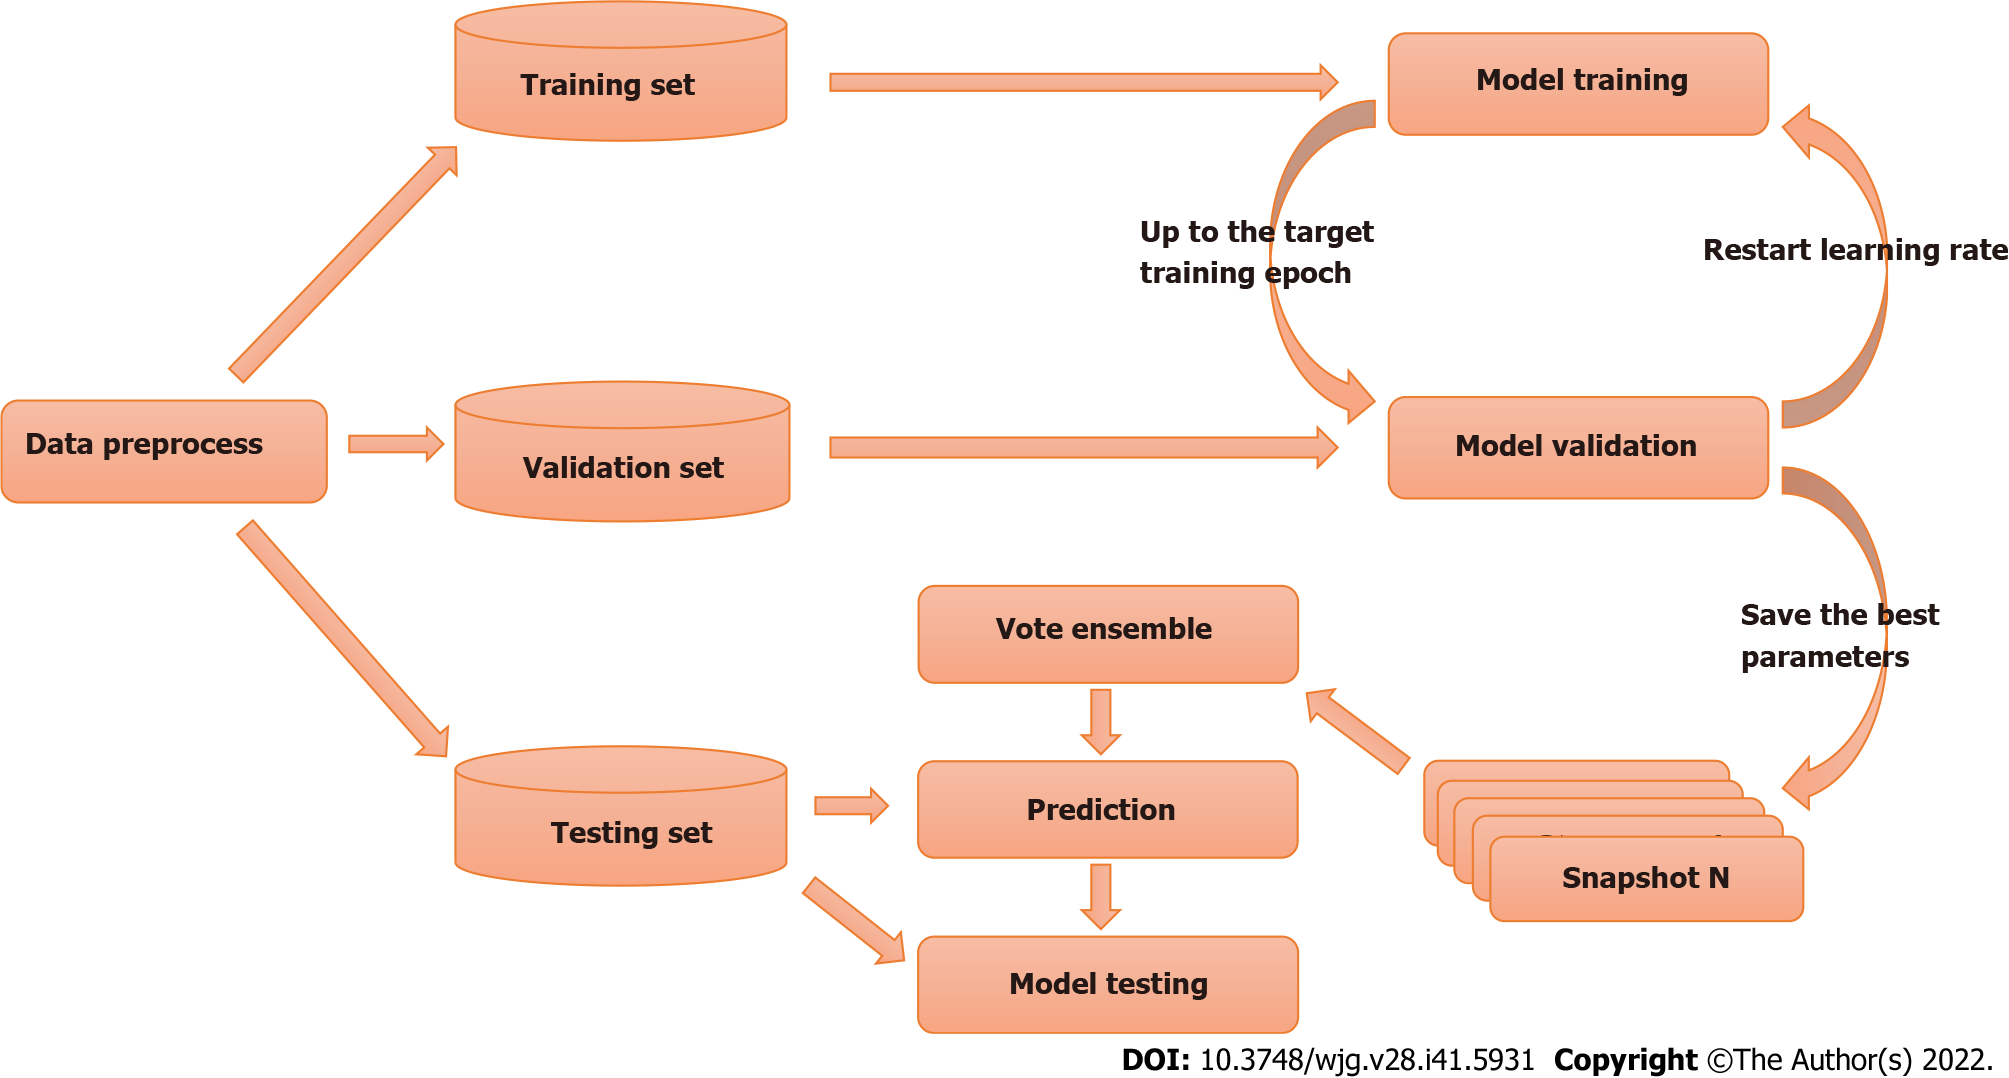
Figure 5 Train-test workflow of the proposed method.
Figure 6 Illustration of intersection over union and dice metrics.
IoU: Intersection over union; FN: False negative; TP: True positive; FP: False positive.
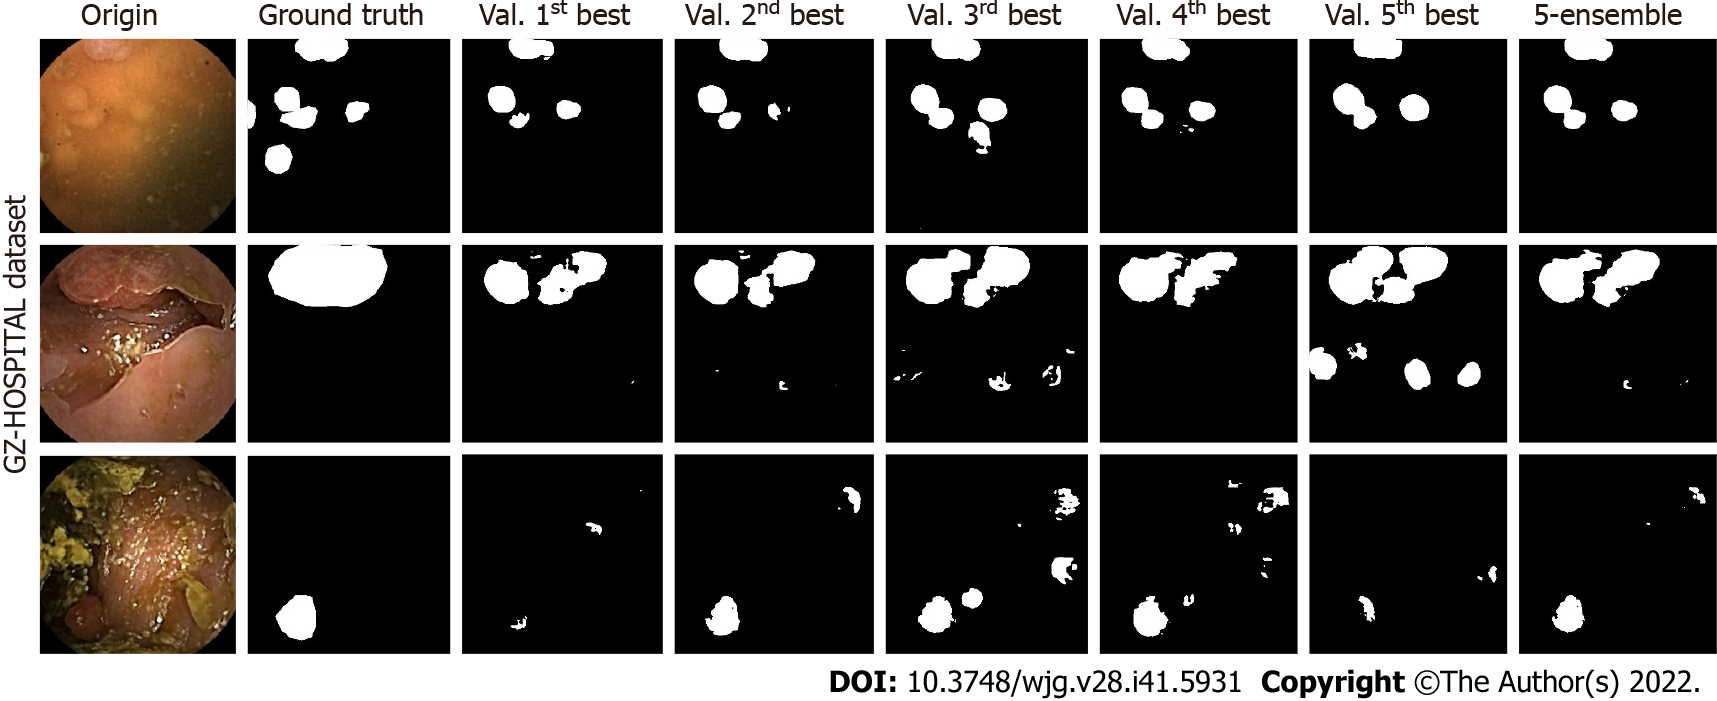
Figure 7 Comparison between the ensemble and single models on artifact-affected images.
Origin represents the images taken by the endoscope. Ground truth represents the anomalous locations marked by experts based on the original images. Val. 1st best to Val. 5th best represents the results of the five best-performing single models evaluated on the validation set. 5-ensemble represents the results of the ensemble model based on these single models.
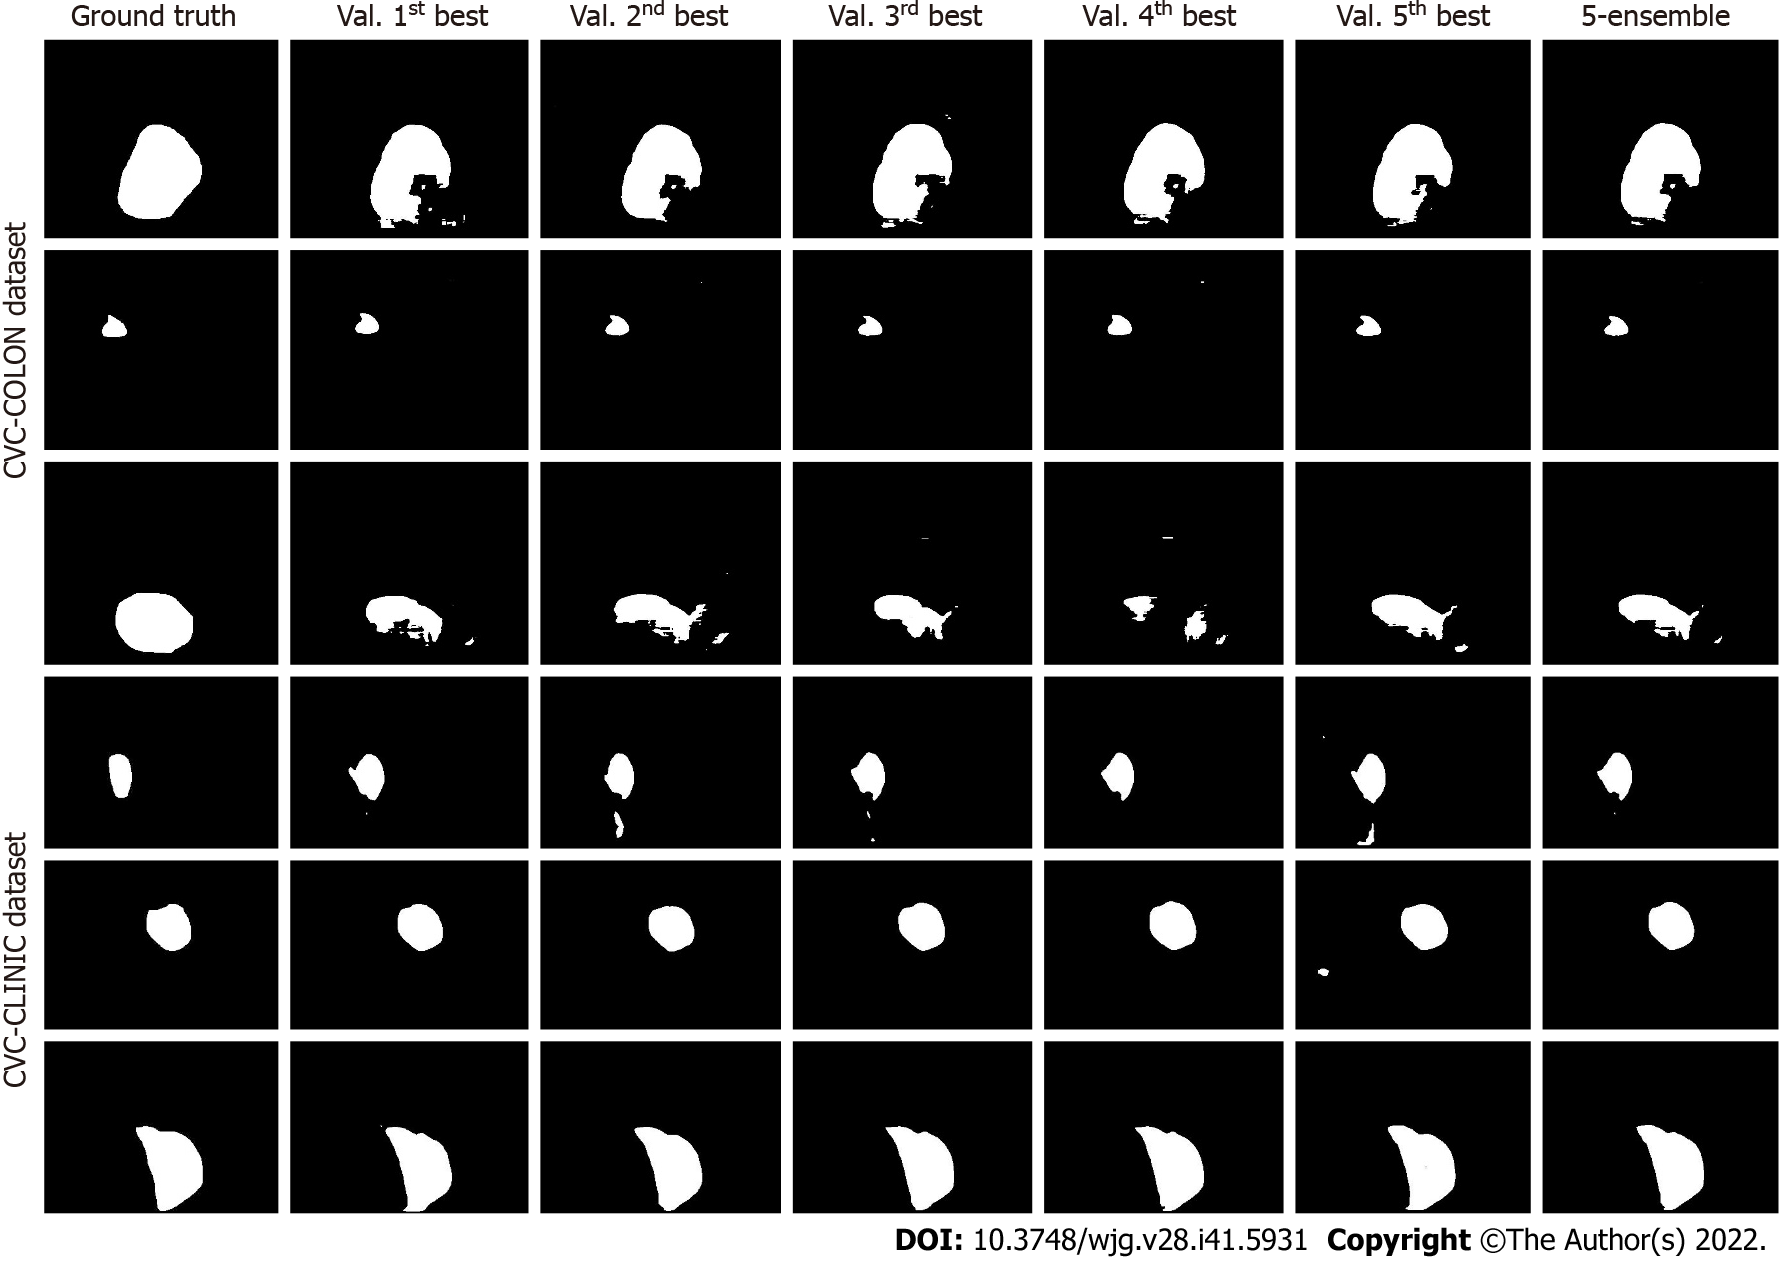
Figure 8 Comparison between the ensemble and single models on standard (clear) images.
Ground truth represents the anomalous locations marked by experts based on the original images. Val. 1st best to Val. 5th best represents the results of the five best-performing single models evaluated on the validation set. 5-ensemble represents the results of the ensemble model based on these single models.
- Citation: Zhou JX, Yang Z, Xi DH, Dai SJ, Feng ZQ, Li JY, Xu W, Wang H. Enhanced segmentation of gastrointestinal polyps from capsule endoscopy images with artifacts using ensemble learning. World J Gastroenterol 2022; 28(41): 5931-5943
- URL: https://www.wjgnet.com/1007-9327/full/v28/i41/5931.htm
- DOI: https://dx.doi.org/10.3748/wjg.v28.i41.5931


