Copyright
©The Author(s) 2022.
World J Gastroenterol. Oct 28, 2022; 28(40): 5845-5864
Published online Oct 28, 2022. doi: 10.3748/wjg.v28.i40.5845
Published online Oct 28, 2022. doi: 10.3748/wjg.v28.i40.5845
Figure 1 Characterization of the in vitro HT-29 cell model.
A: Western blot of connexin 43 (Cx43) protein expression in parental HT-29, HT-29 Cx43-Dendra (Cx43D), and in HT-29 Cx43- cells. Bar graphs display mean densitometric analysis (of three independent experiments) after normalizing protein expression to glyceraldehyde 3-phosphate dehydrogenase (GAPDH); B: Immunofluorescence micrographs of parental HT-29 and HT-29 Cx43- cells, as well as a fluorescent micrograph of HT-29 cells transduced with the GFP-Cx43 construct. Highly GFP positive cells were sorted using BD-Fluorescence-Activated Cell Sorting cell sorter, generating the HT-29 Cx43D. Scale bar 10 μm; C: Cells were counted at three different time points (24, 48 and 72 h), using the trypan blue dye exclusion assay. Compared to parental HT-29 cells, HT-29 Cx43D cells had a slower proliferation rate and HT-29 Cx43- cells a faster proliferation rate at 48 and 72 h; D: Histograms show normalized gene expression of ten-eleven translocation (TETs) in parental HT-29, HT-29 Cx43D and HT-29 Cx43- cells, as detected by quantitative polymerase chain reaction (qPCR). TET-2 was the highest expressed TET in HT-29 cells, and cells with differential Cx43 expression also had significantly different TET-2 expression levels. The inset is an immunomicrograph of TET-2 in HT-29 C43D cells. Scale bar 5 μm. Results are presented as means ± SEM of three independent qPCR runs in duplicates. One-way ANOVA, aP < 0.05; bP < 0.001; cP < 0.0005. Cx43: Connexin 43; GAPDH: Glyceraldehyde 3-phosphate dehydrogenase.
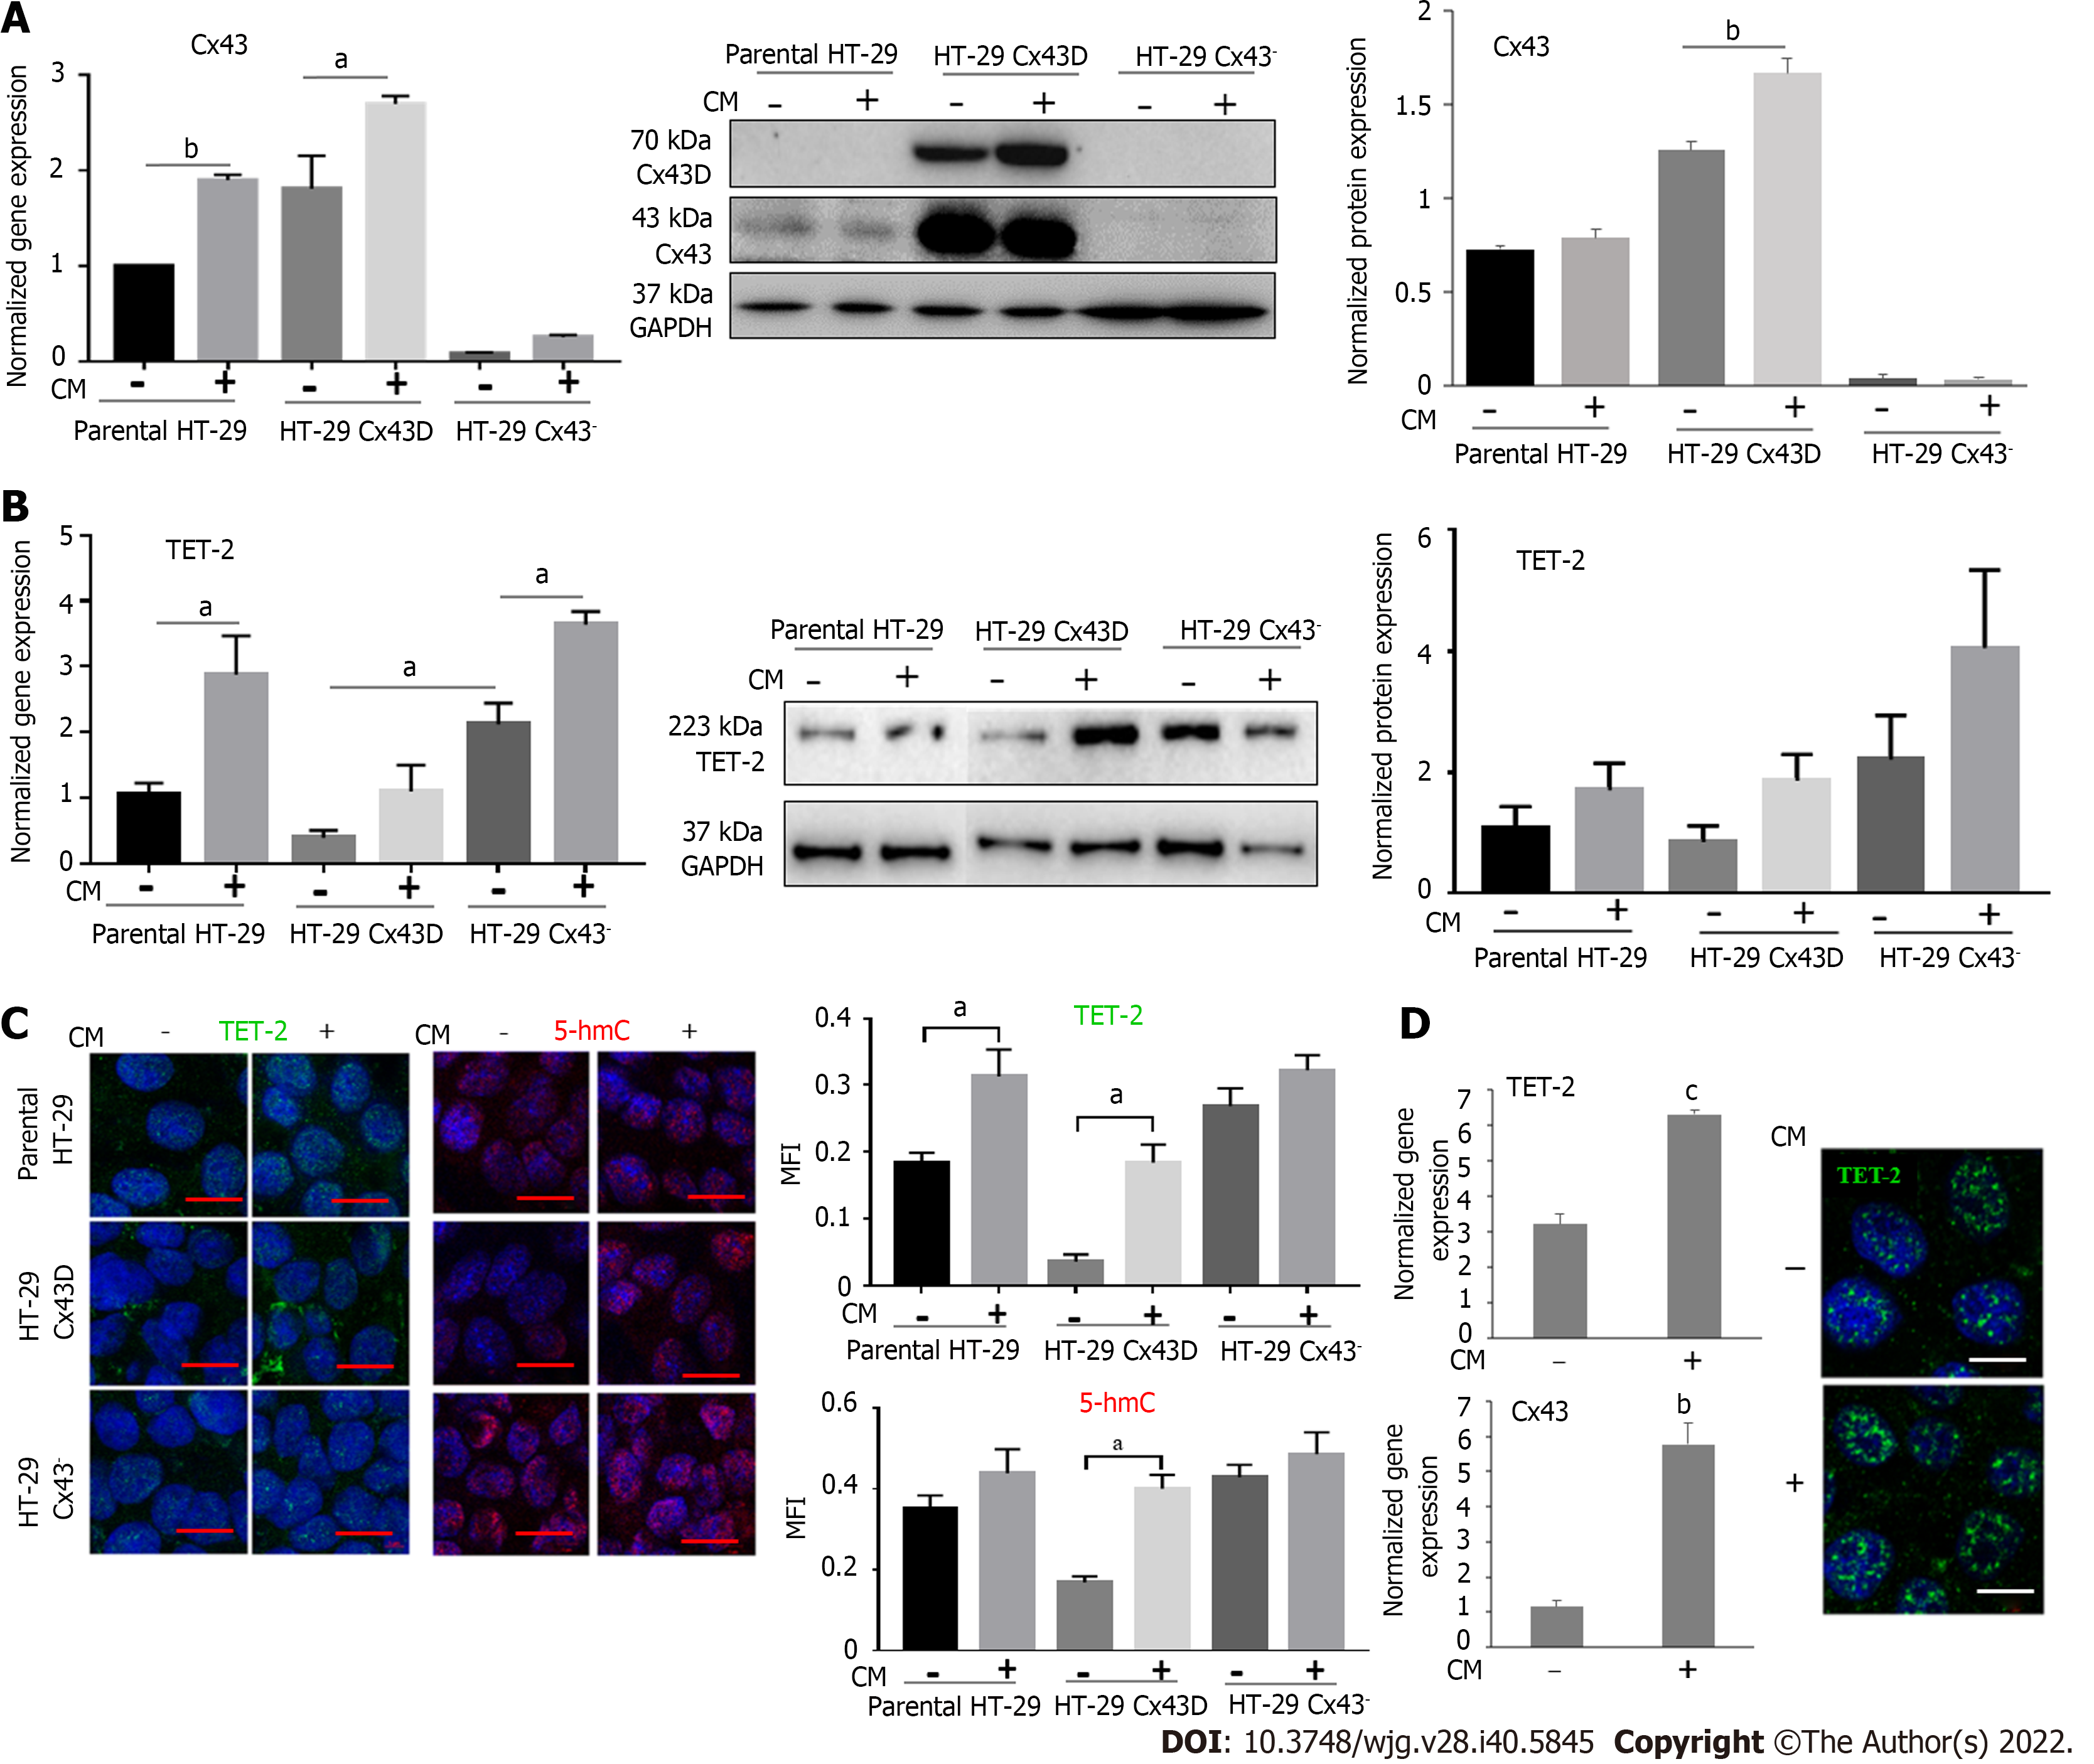
Figure 2 Connexin 43 and ten-eleven translocation-2 expression increases in cells exposed to inflammation.
Parental HT-29, HT-29 connexin 43-Dendra (Cx43D), and HT-29 Cx43- cells were exposed to inflammatory conditioned media (CM) obtained from activated THP-1 cells for 24 h. A: Histograms show the normalized gene expression of Cx43, as detected by quantitative polymerase chain reaction. Cx43 mRNA levels increase in parental HT-29 and HT-29 Cx43D, in the presence of inflammatory media. Western blot of endogenous Cx43 and exogenous Cx43D protein expression in parental HT-29, HT-29 Cx43D, and in HT-29 Cx43- cells. Densitometric analysis (ratio of protein-of-interest to loading control band intensity) shows a slight increase in Cx43 levels upon exposure to inflammation; B: Bar graphs show ten-eleven translocation-2 (TET-2) transcriptional levels increase in all three HT-29 cellular subsets when exposed to CM. Western blots of TET-2 and densitometric analysis shows increased protein levels of TET-2 in CM-treated cells; C: Immunofluorescence images showing TET-2 expression and 5-hmC marks in parental HT-29, HT-29 Cx43D, and HT-29 Cx43- cells. Bar graphs in the right panel reflect mean fluorescence intensity of at least five different fields acquired from three different experiments. Levels and activity of TET-2 increase in all CM-exposed cells. Scale bar 5 μm; D: Bar graphs display levels of Cx43 and TET-2 in Caco-2 cells exposed to CM. Fluorescent micrographs show increased levels of TET-2 in the nucleus upon exposure to CM. Scale bar 5 μm. Experiments were repeated at least three different times. One-way ANOVA, aP < 0.05; bP < 0.001; cP < 0.0005. TET-2: Translocation-2; Cx43: Connexin 43; GAPDH: Glyceraldehyde 3-phosphate dehydrogenase; MFI: Mean fluorescence intensity.
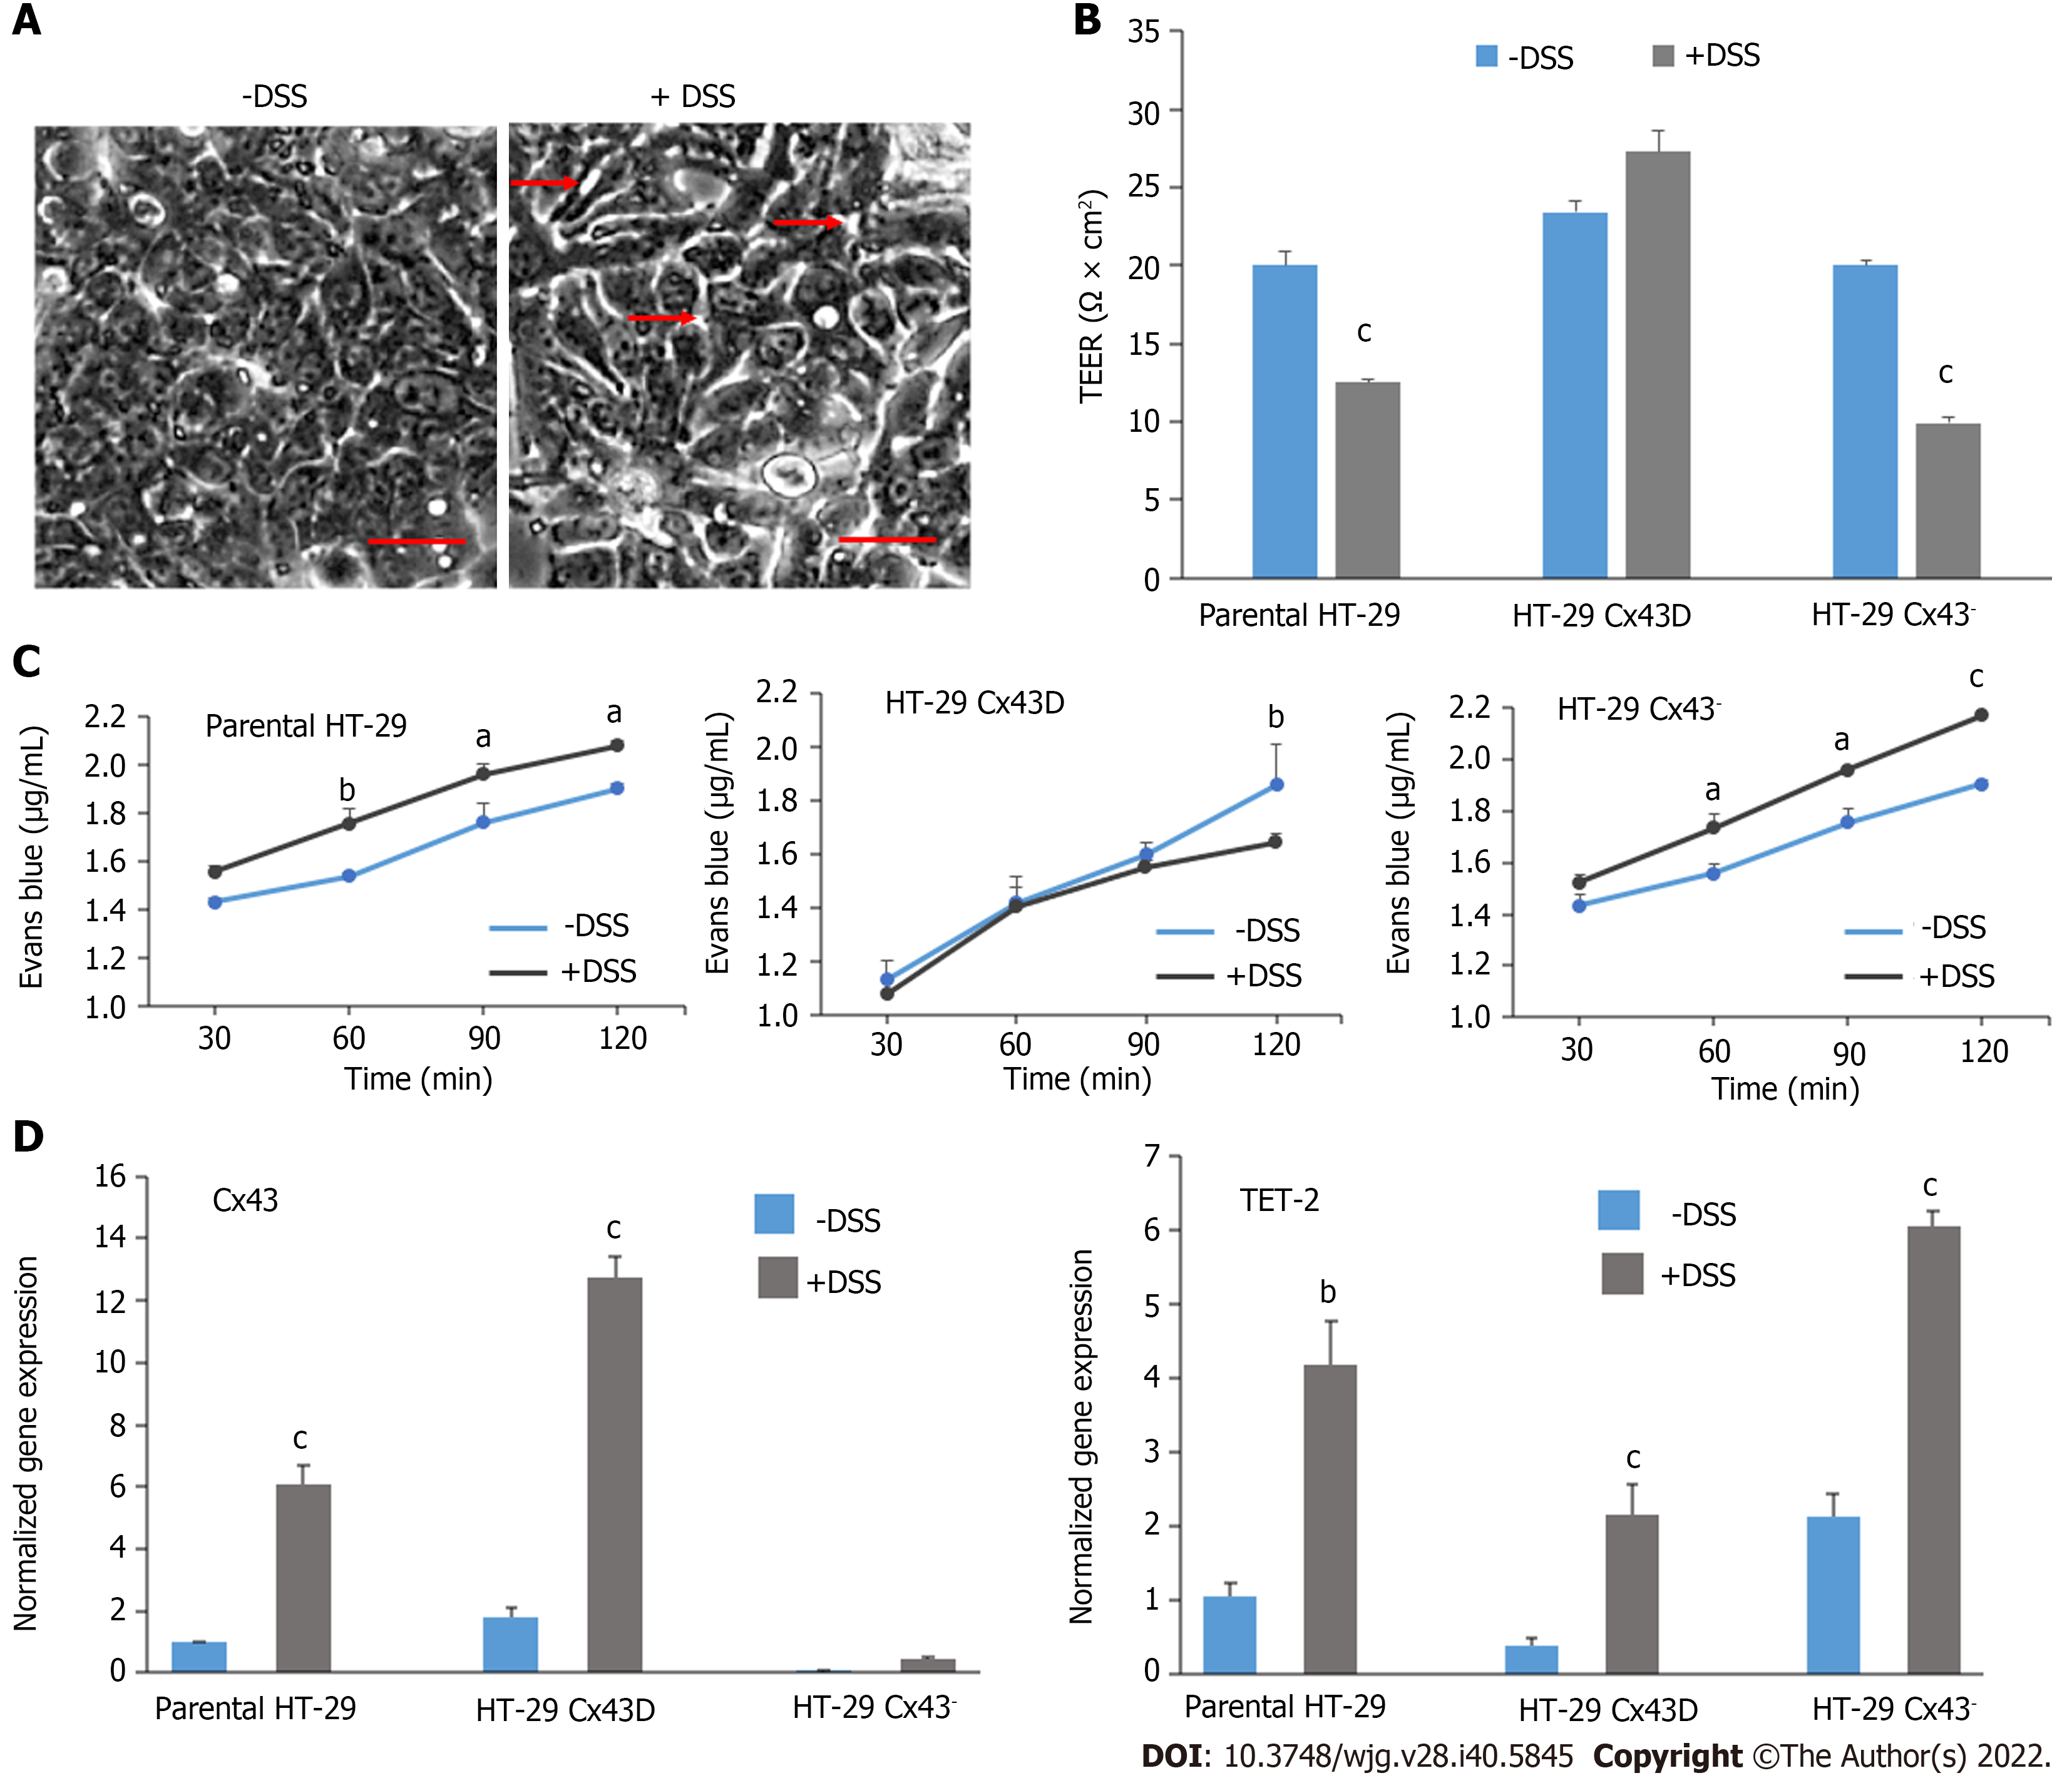
Figure 3 Dextran sulfate sodium treatment disrupts the integrity and permeability of intestinal epithelial barrier, notably in HT-29 connexin 43- cells.
A: Light microscopy images of HT-29 cells in the presence or absence of 2% dextran sulfate sodium (DSS). Scale bar 50 μm; B: The membrane integrity of parental HT-29, HT-29 connexin 43-Dendra (Cx43D), and HT-29 Cx43- cells in the presence or absence of 2% DSS was measured by trans-epithelial electrical resistance (TEER). Bar graphs indicate average TEER measurements; C: Membrane permeability was evaluated by Evans Blue permeability assay in all three cell subsets. Levels of Evans Blue that crossed are measured by spectrophotometry and are plotted as means over time; D: Quantitative polymerase chain reaction data show that transcriptional levels of Cx43 and ten-eleven translocation-2 (TET-2) significantly increase in DSS-treated cells. All experiments have been repeated at least three times. Two-way ANOVA, aP < 0.05; bP < 0.001; cP < 0.0005. Cx43: Connexin 43; DSS: Dextran sulfate sodium; TEER: Trans-epithelial electrical resistance.
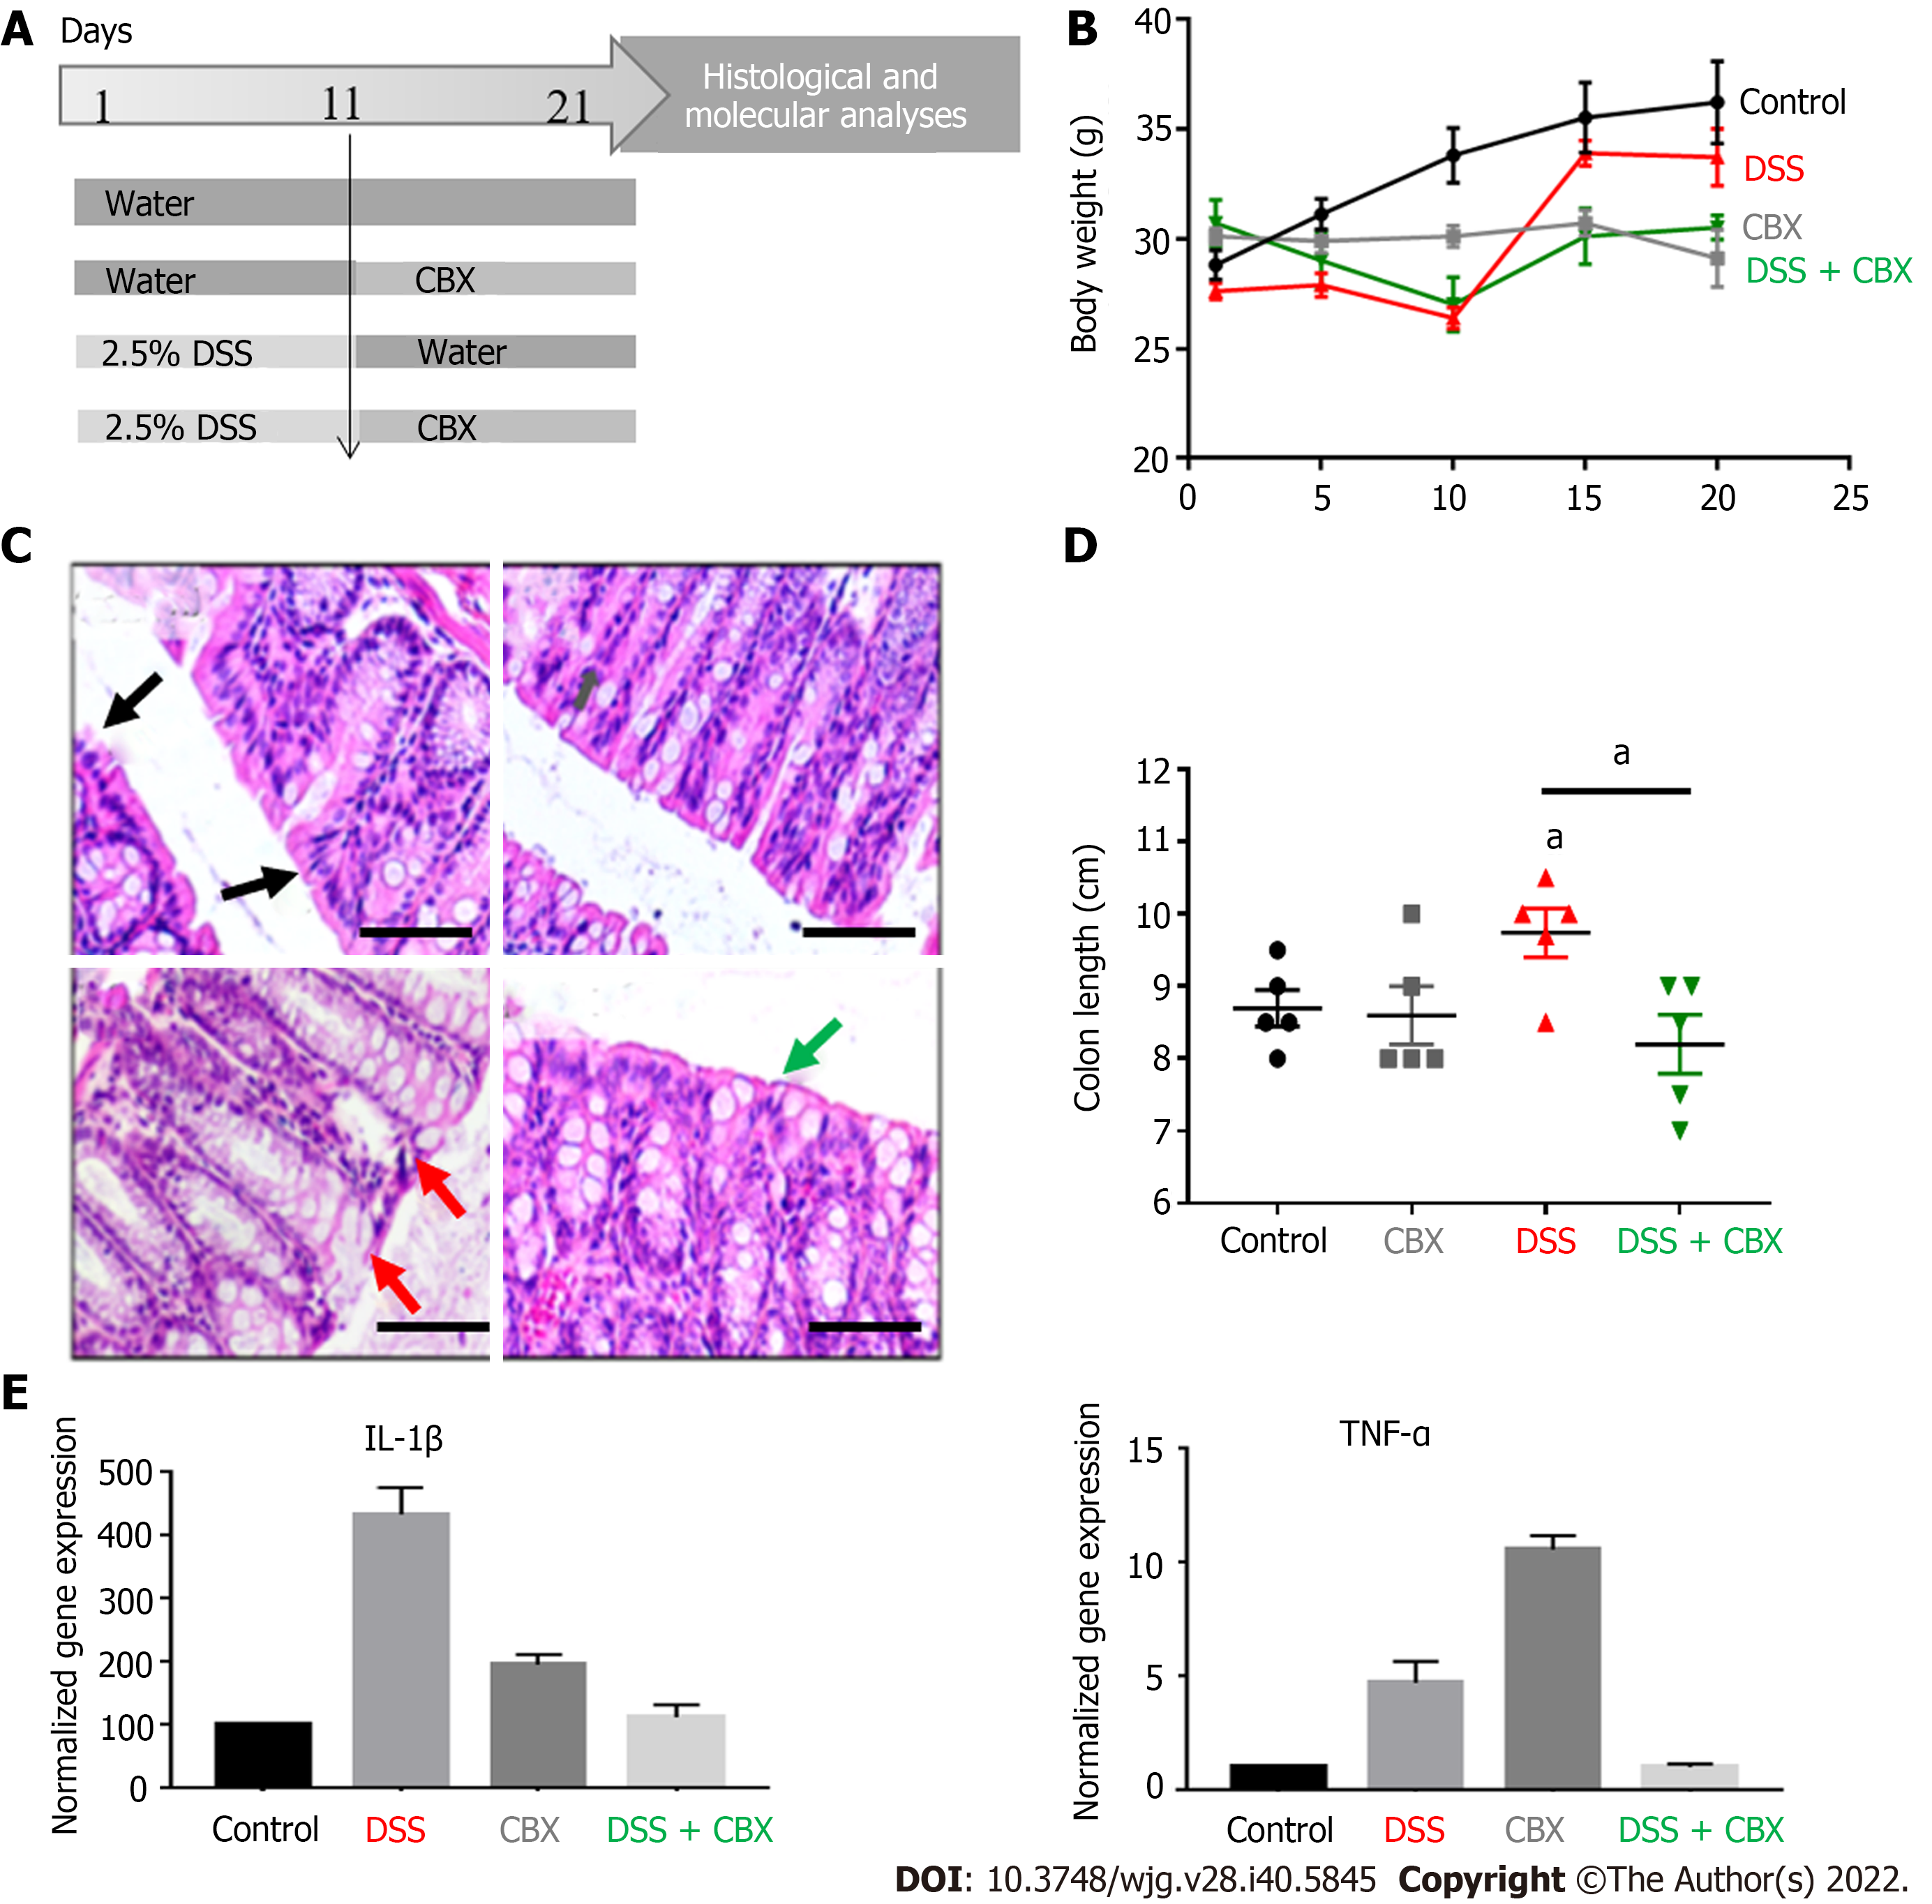
Figure 4 Dextran sulfate sodium induces inflammation in mice and carbenoxolone restores the normal phenotype.
A: A flowchart schematizing the in vivo experimental design. BALB/c male mice were distributed into four experimental groups, each comprised of five mice: (1) Control group that received normal drinking water with no carbenoxolone (CBX) injections; (2) CBX group that received normal drinking water with CBX injections starting day 11; (3) Dextran sulfate sodium (DSS) group where mice were administered with 2.5% DSS in their drinking water for 10 d but not subjected to any CBX injections; and (4) DSS + CBX group that received DSS-containing drinking water as well as CBX injections. Mice were given 30 mg/kg CBX via intraperitoneal injections from day 11 every other day to the end of the experiment; B: Variation of animal body weight over 21 d. DSS-exposed mice lost weight. Significance in body weight change was detected between days 4 and 12 in DSS-treated mice, and days 11 and 21 in CBX-injected mice only; C: Hematoxylin and eosin images showing the architecture of mice colon tissues from all experimental groups. Arrows indicate representative sites in each experimental condition. Scale bar 50 μm; D: Colon length was measured at the end of the experiment. DSS-treated mice showed significantly longer colons compared to the control group; E: Bar graphs showing the normalized gene expression of interleukin-1β and tumor necrosis factor-α in mouse colon tissues, as detected by quantitative polymerase chain reaction. Experiments were repeated five times and results are displayed as means ± SEM. One-way ANOVA, aP < 0.05. IL: Interleukin; CBX: Carbenoxolone; DSS: Dextran sulfate sodium; TNF-α: Tumor necrosis factor-α.
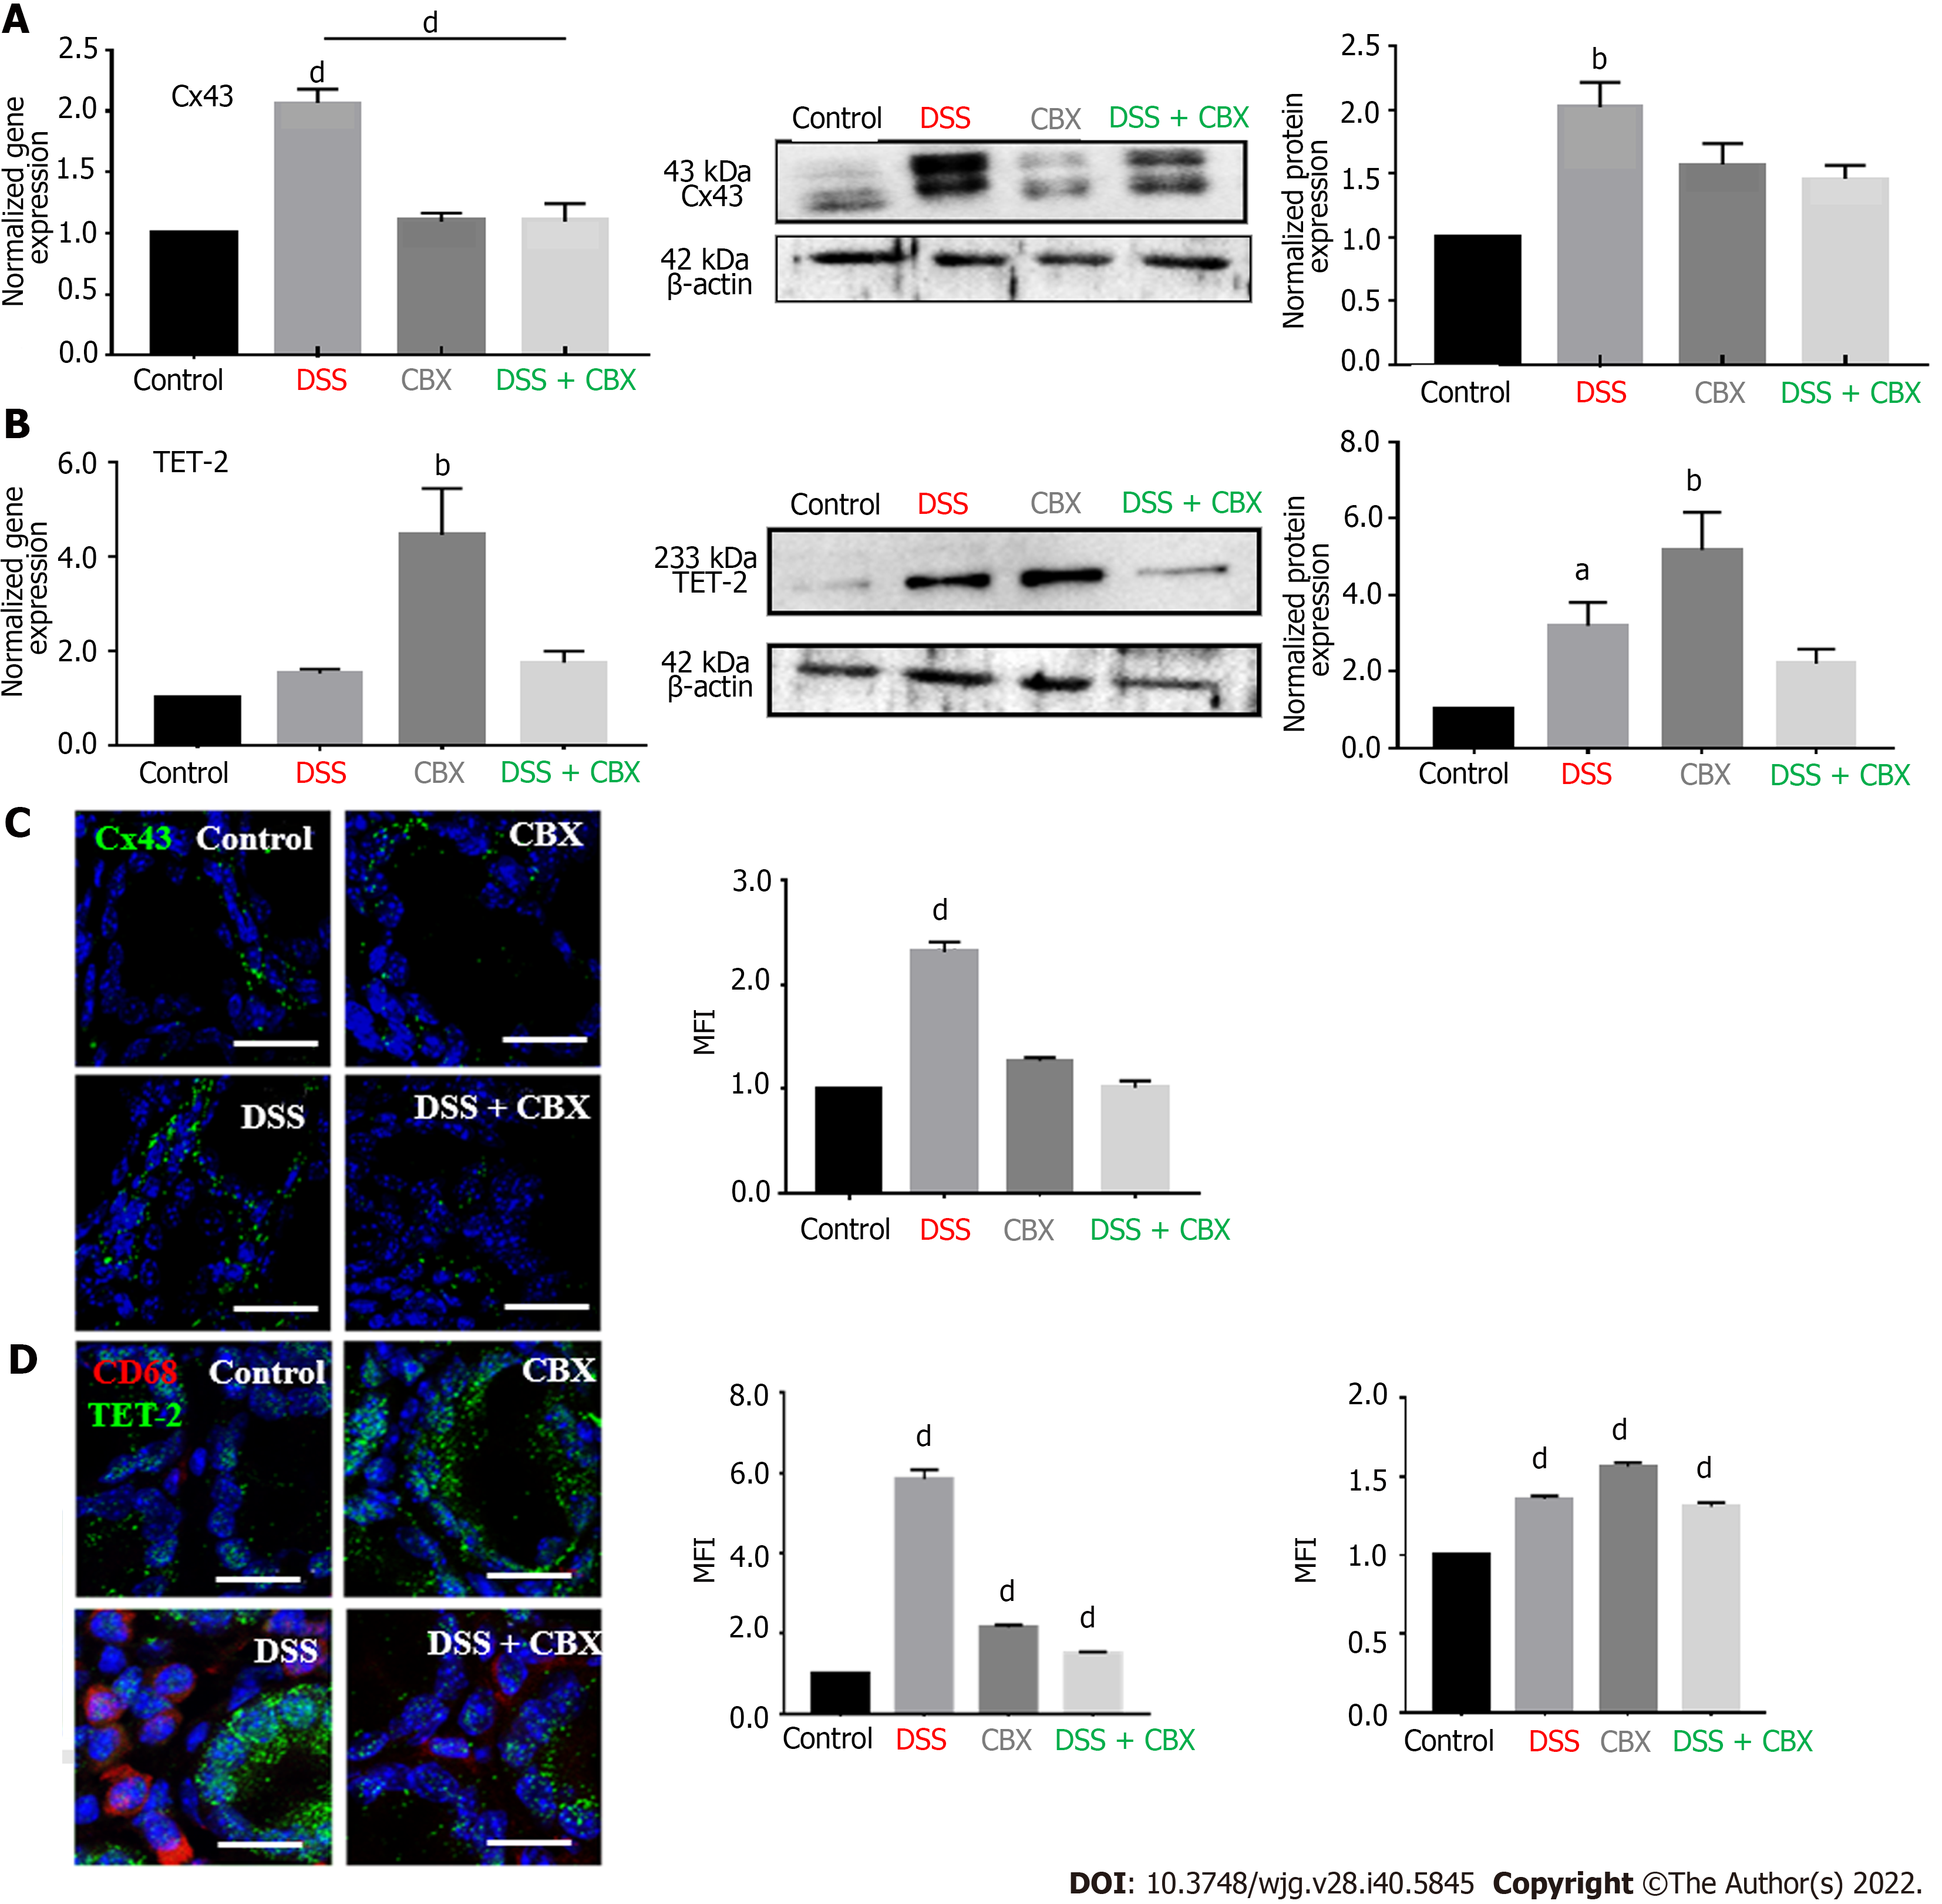
Figure 5 Dextran sulfate sodium increases connexin 43 and ten-eleven translocation-2 expressions in vivo.
A: Left panel: Histograms show the normalized gene expression of connexin 43 (Cx43) in mice colon tissues, as detected by quantitative polymerase chain reaction (qPCR). Middle panel: Western blot of Cx43 protein in mouse colon tissues. Right panel: Densitometric analysis of protein expression after normalization to β-actin. Dextran sulfate sodium (DSS)-treated mice had the highest expression of Cx43 in their colons; B: Left panel: Histograms display the normalized gene expression of ten-eleven translocation-2 (TET-2) in mouse colon tissues, as detected by qPCR. Middle panel: Western blot of TET-2 protein expression in mouse colon tissues. Right panel: Densitometric analysis of protein expression after normalization to β-actin. DSS exposure resulted in enhanced TET-2 transcription and carbenoxolone inhibition of gap junctions significantly increased TET-2 expression; C: Immunofluorescence images of colon tissues stained for Cx43 with the mean fluorescence intensity (MFI) analysis. Scale bar 20 μm; D: Immunofluorescence images of mouse colon tissues stained for CD68 and TET-2. Histograms reflect the MFI analysis. High levels of CD68+ cells correlated with greater expression of Cx43 and TET-2 in DSS-exposed mice. Scale bar 10 μm. Experiments were repeated five times. One-way ANOVA, aP < 0.05; bP < 0.005; dP < 0.0001. MFI: Mean fluorescence intensity; CBX: Carbenoxolone; DSS: Dextran sulfate sodium.
Figure 6 Modulation of connexin 43 and ten-eleven translocation-2 expression in human colon tissues under pathological conditions.
A: Hematoxylin and eosin images of human colon tissues. Compared to normal (histopathologically unchanged) samples, tissues from inflamed (ulcerative colitis) and sporadic malignant colons show disorganization of colon crypts and infiltration of immune cells within the lamina propria. Scale bar 50 μm; B: Immunofluorescence images of CD68+ cells (macrophages) and connexin 43 (Cx43) show that Cx43 expression increases in inflamed tissues. Scale bar 10 μm; C: Immunofluorescence images of ten-eleven translocation-2 (TET-2) in human colon tissues (upper panel: Low magnification; lower panel: Higher magnification). TET-2 protein was minimally detected in ulcerative colitis and colon adenocarcinoma tissues. Scale bar 10 μm; D: Mean fluorescence intensity (MFI) analyses reflecting the expression of CD68, Cx43, and TET-2. One-way ANOVA, bP < 0.005; dP < 0.0001. MFI: Mean fluorescence intensity; TET: Ten-eleven translocation.
- Citation: El-Harakeh M, Saliba J, Sharaf Aldeen K, Haidar M, El Hajjar L, Awad MK, Hashash JG, Shirinian M, El-Sabban M. Expression of the methylcytosine dioxygenase ten-eleven translocation-2 and connexin 43 in inflammatory bowel disease and colorectal cancer. World J Gastroenterol 2022; 28(40): 5845-5864
- URL: https://www.wjgnet.com/1007-9327/full/v28/i40/5845.htm
- DOI: https://dx.doi.org/10.3748/wjg.v28.i40.5845


