Copyright
©The Author(s) 2022.
World J Gastroenterol. Oct 14, 2022; 28(38): 5573-5588
Published online Oct 14, 2022. doi: 10.3748/wjg.v28.i38.5573
Published online Oct 14, 2022. doi: 10.3748/wjg.v28.i38.5573
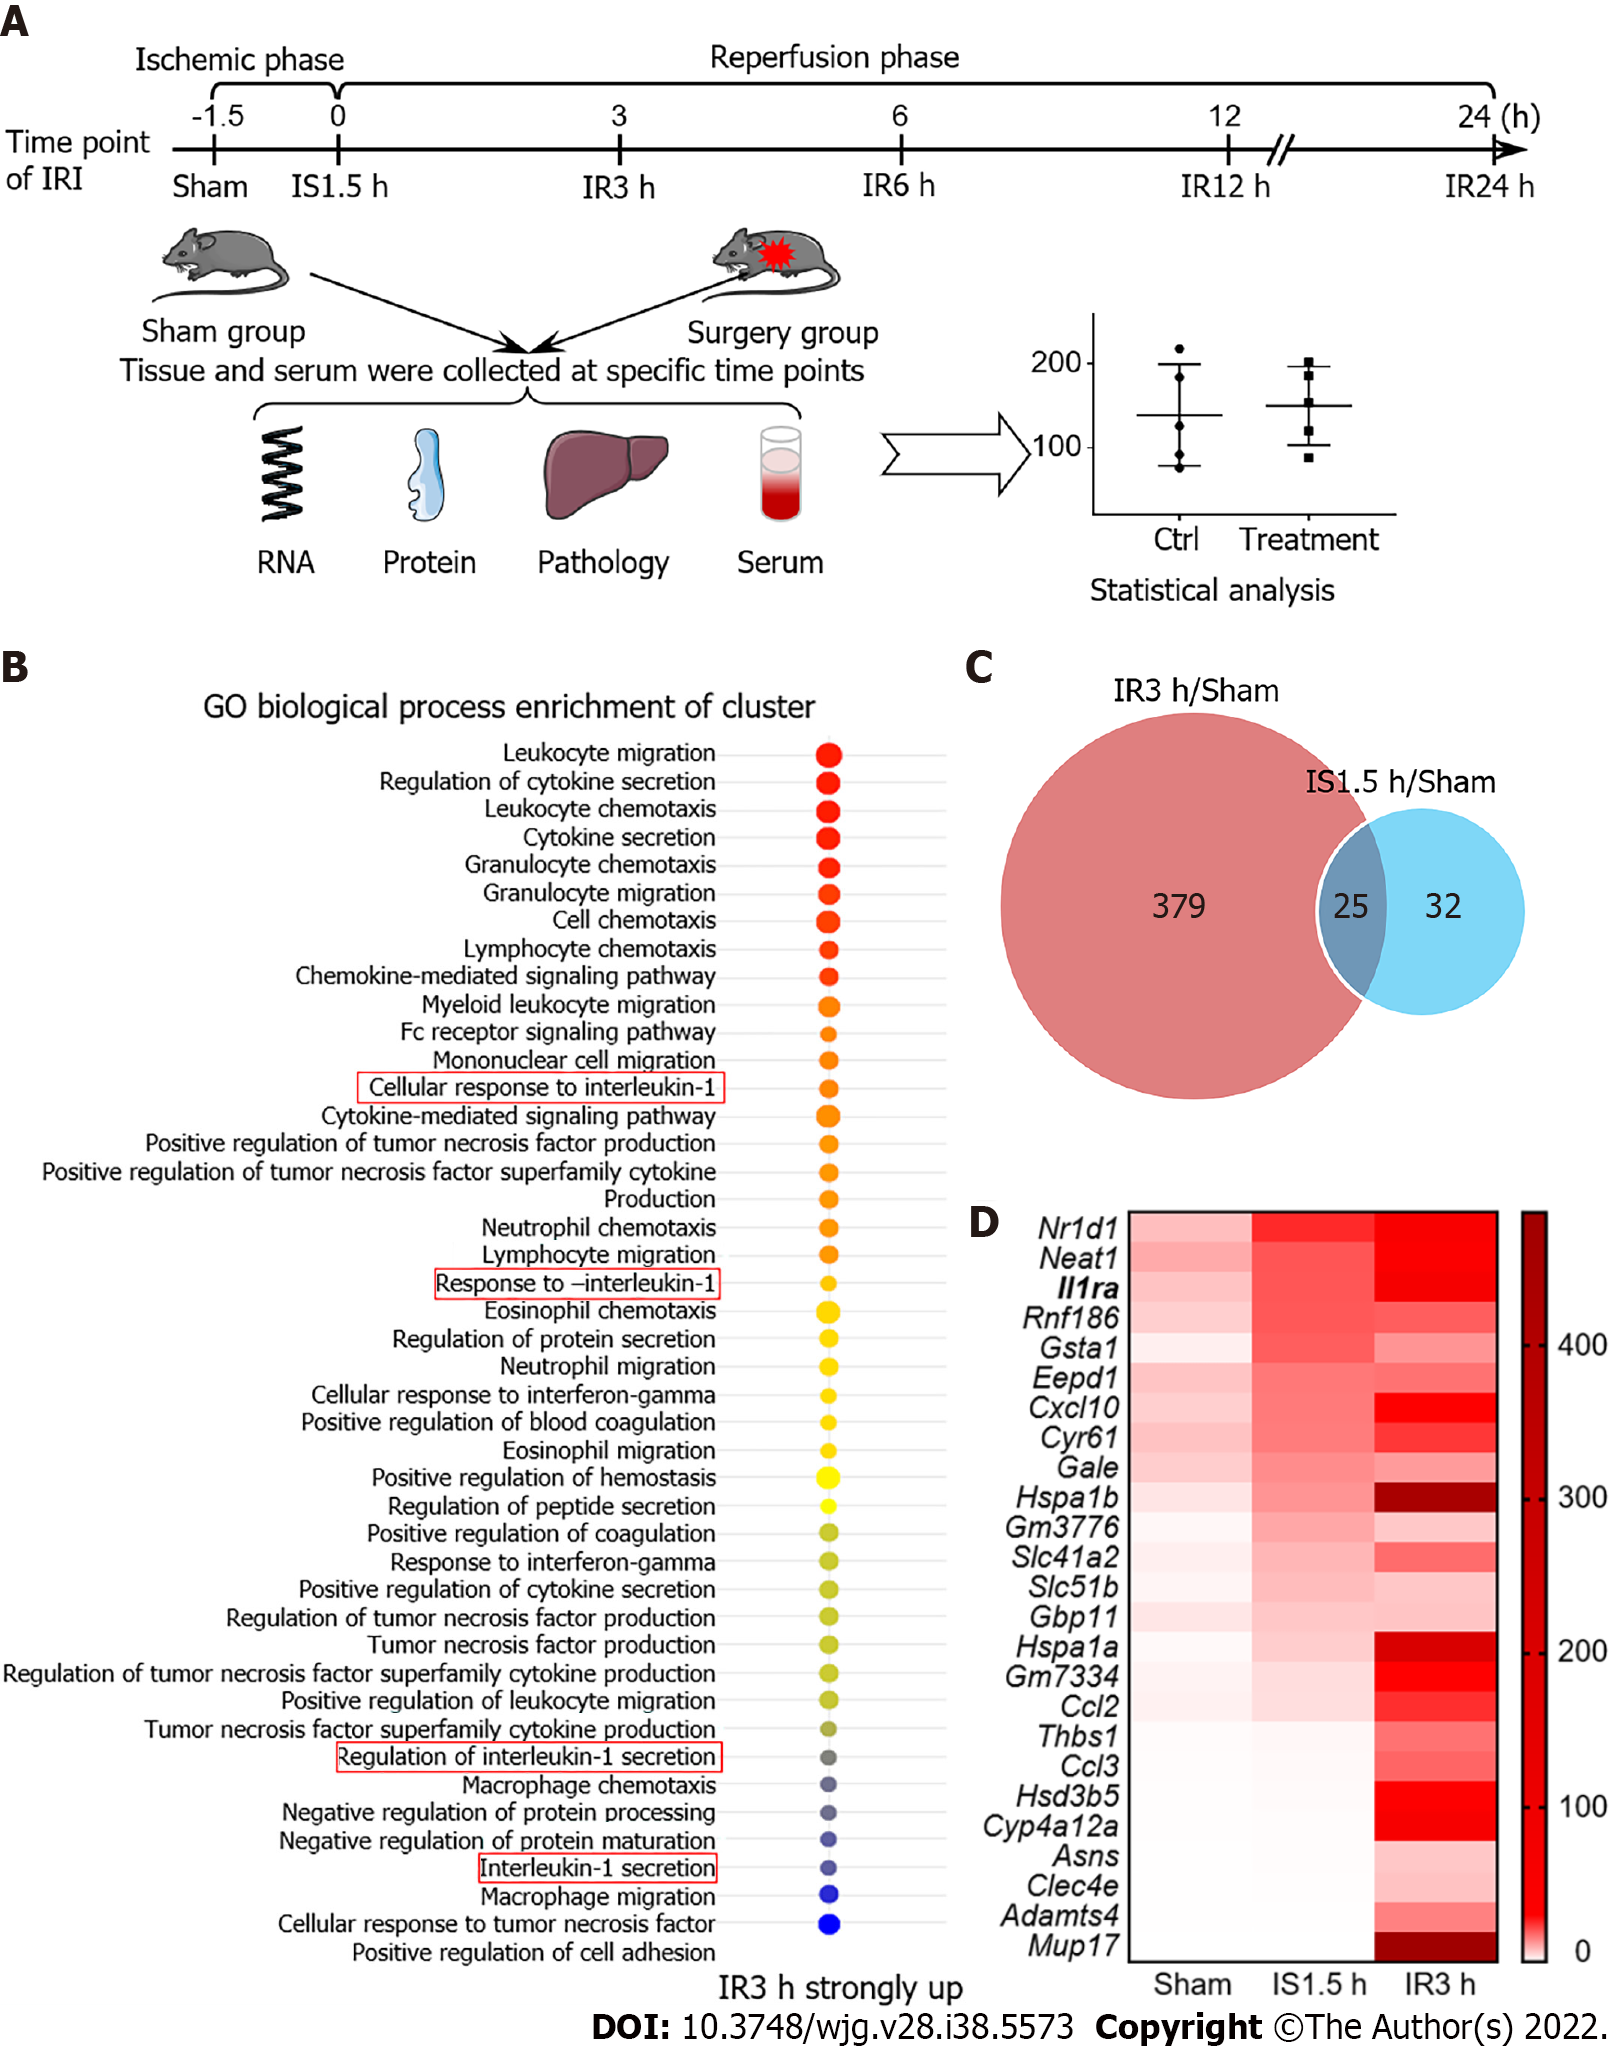
Figure 1 Construction of a mouse model of hepatic ischemia-reperfusion injury and gene enrichment analysis.
A: Model of ischemia-reperfusion injury (IRI) in mice; B: GO enrichment analysis upon IR for 3 h; C: Venn diagram shows that the expression of genes for IR 3 h and ischemia (IS) 1.5 h was more than 2-fold than that in the Sham group; D: Twenty-five genes were elevated in both IR 3 h and IS 1.5 h groups according to IS 1.5 h expression level. IS: Ischemia; IR: Ischemia-reperfusion; IRI: Ischemia-reperfusion injury.
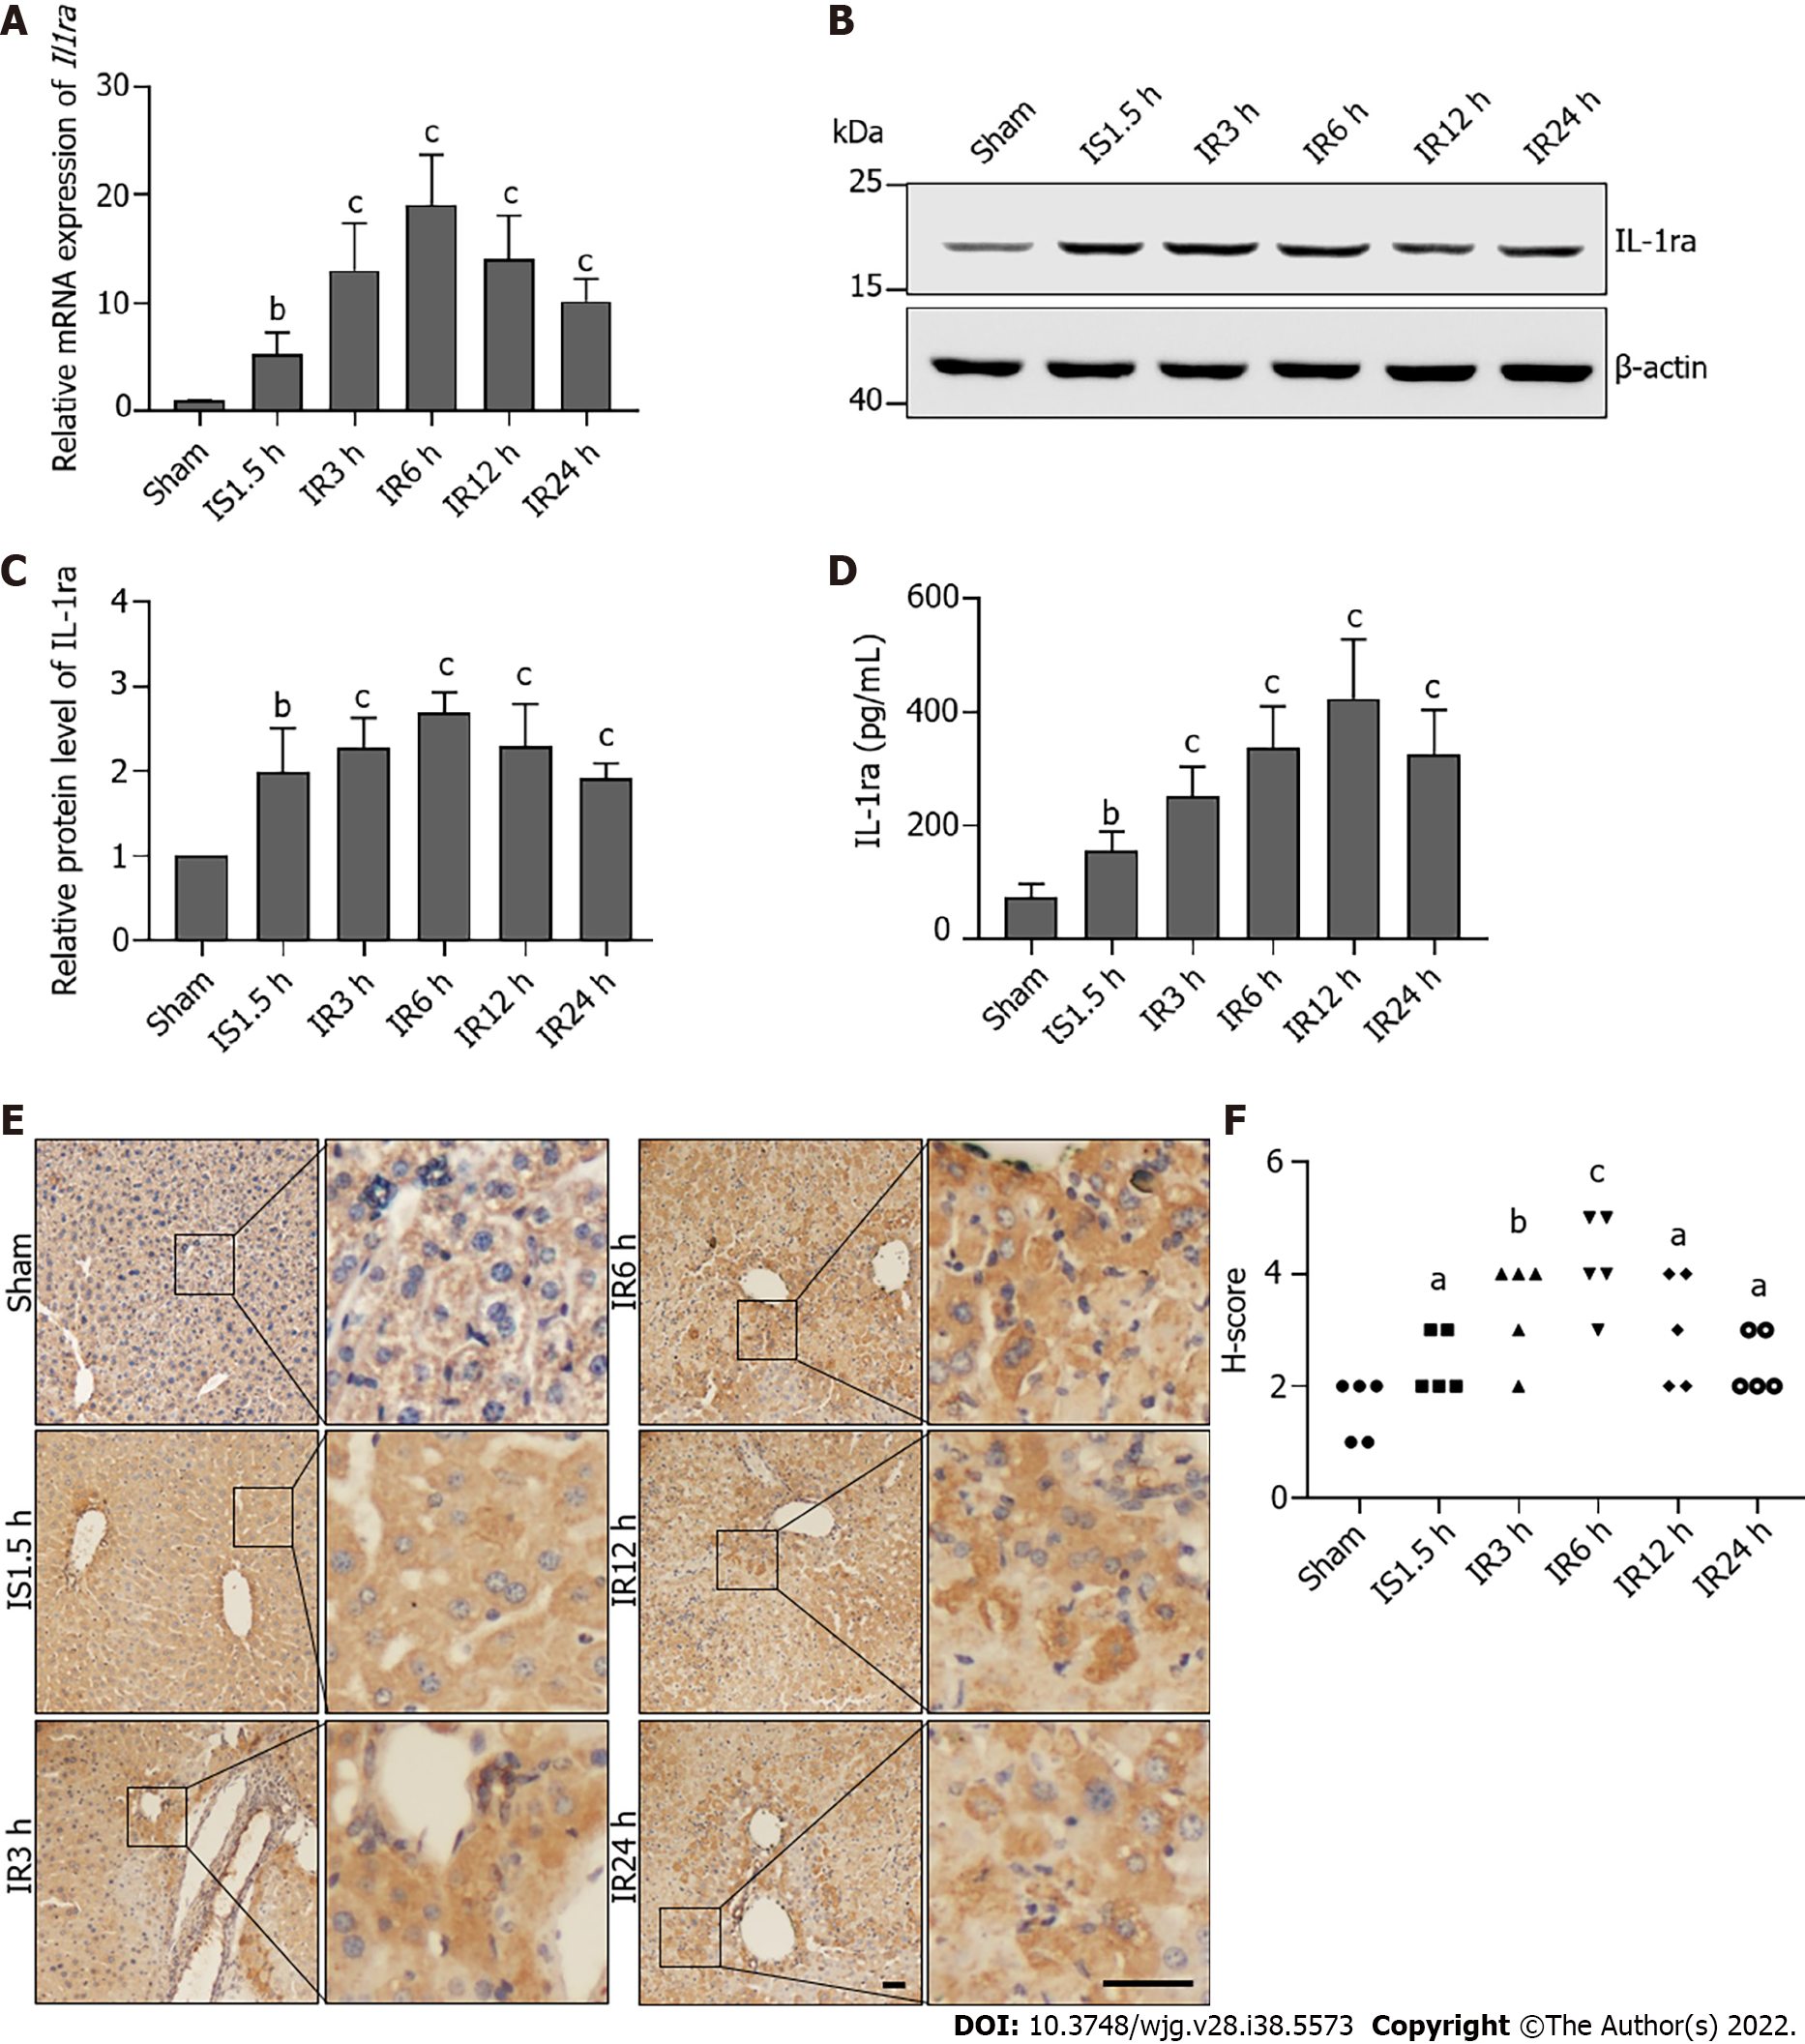
Figure 2 Interleukin-1 receptor antagonist expression is elevated after hepatic ischemia-reperfusion injury in mice.
A: Relative mRNA levels of interleukin-1 receptor antagonist (Il1ra) in the liver upon ischemia-reperfusion injury (IRI); B: Protein levels of IL-1ra in the liver upon IRI; C: Statistical analysis of protein levels of IL-1Ra upon IRI; D: Protein content of IL-1ra in serum upon IRI; E. Representative images of immunohistochemical staining for IL-1ra in the liver upon IRI. Scale bars, 100 μm; F: Statistical analysis of immunohistochemical scores. Indicated P values were calculated using a two-tailed unpaired Student’s t-test. Data are presented as the mean ± SEM. Data are representative of five independent experiments. aP < 0.05, bP < 0.01, cP < 0.001. IS: Ischemia; IR: Ischemia-reperfusion; IL-1ra: Interleukin-1 receptor antagonist.
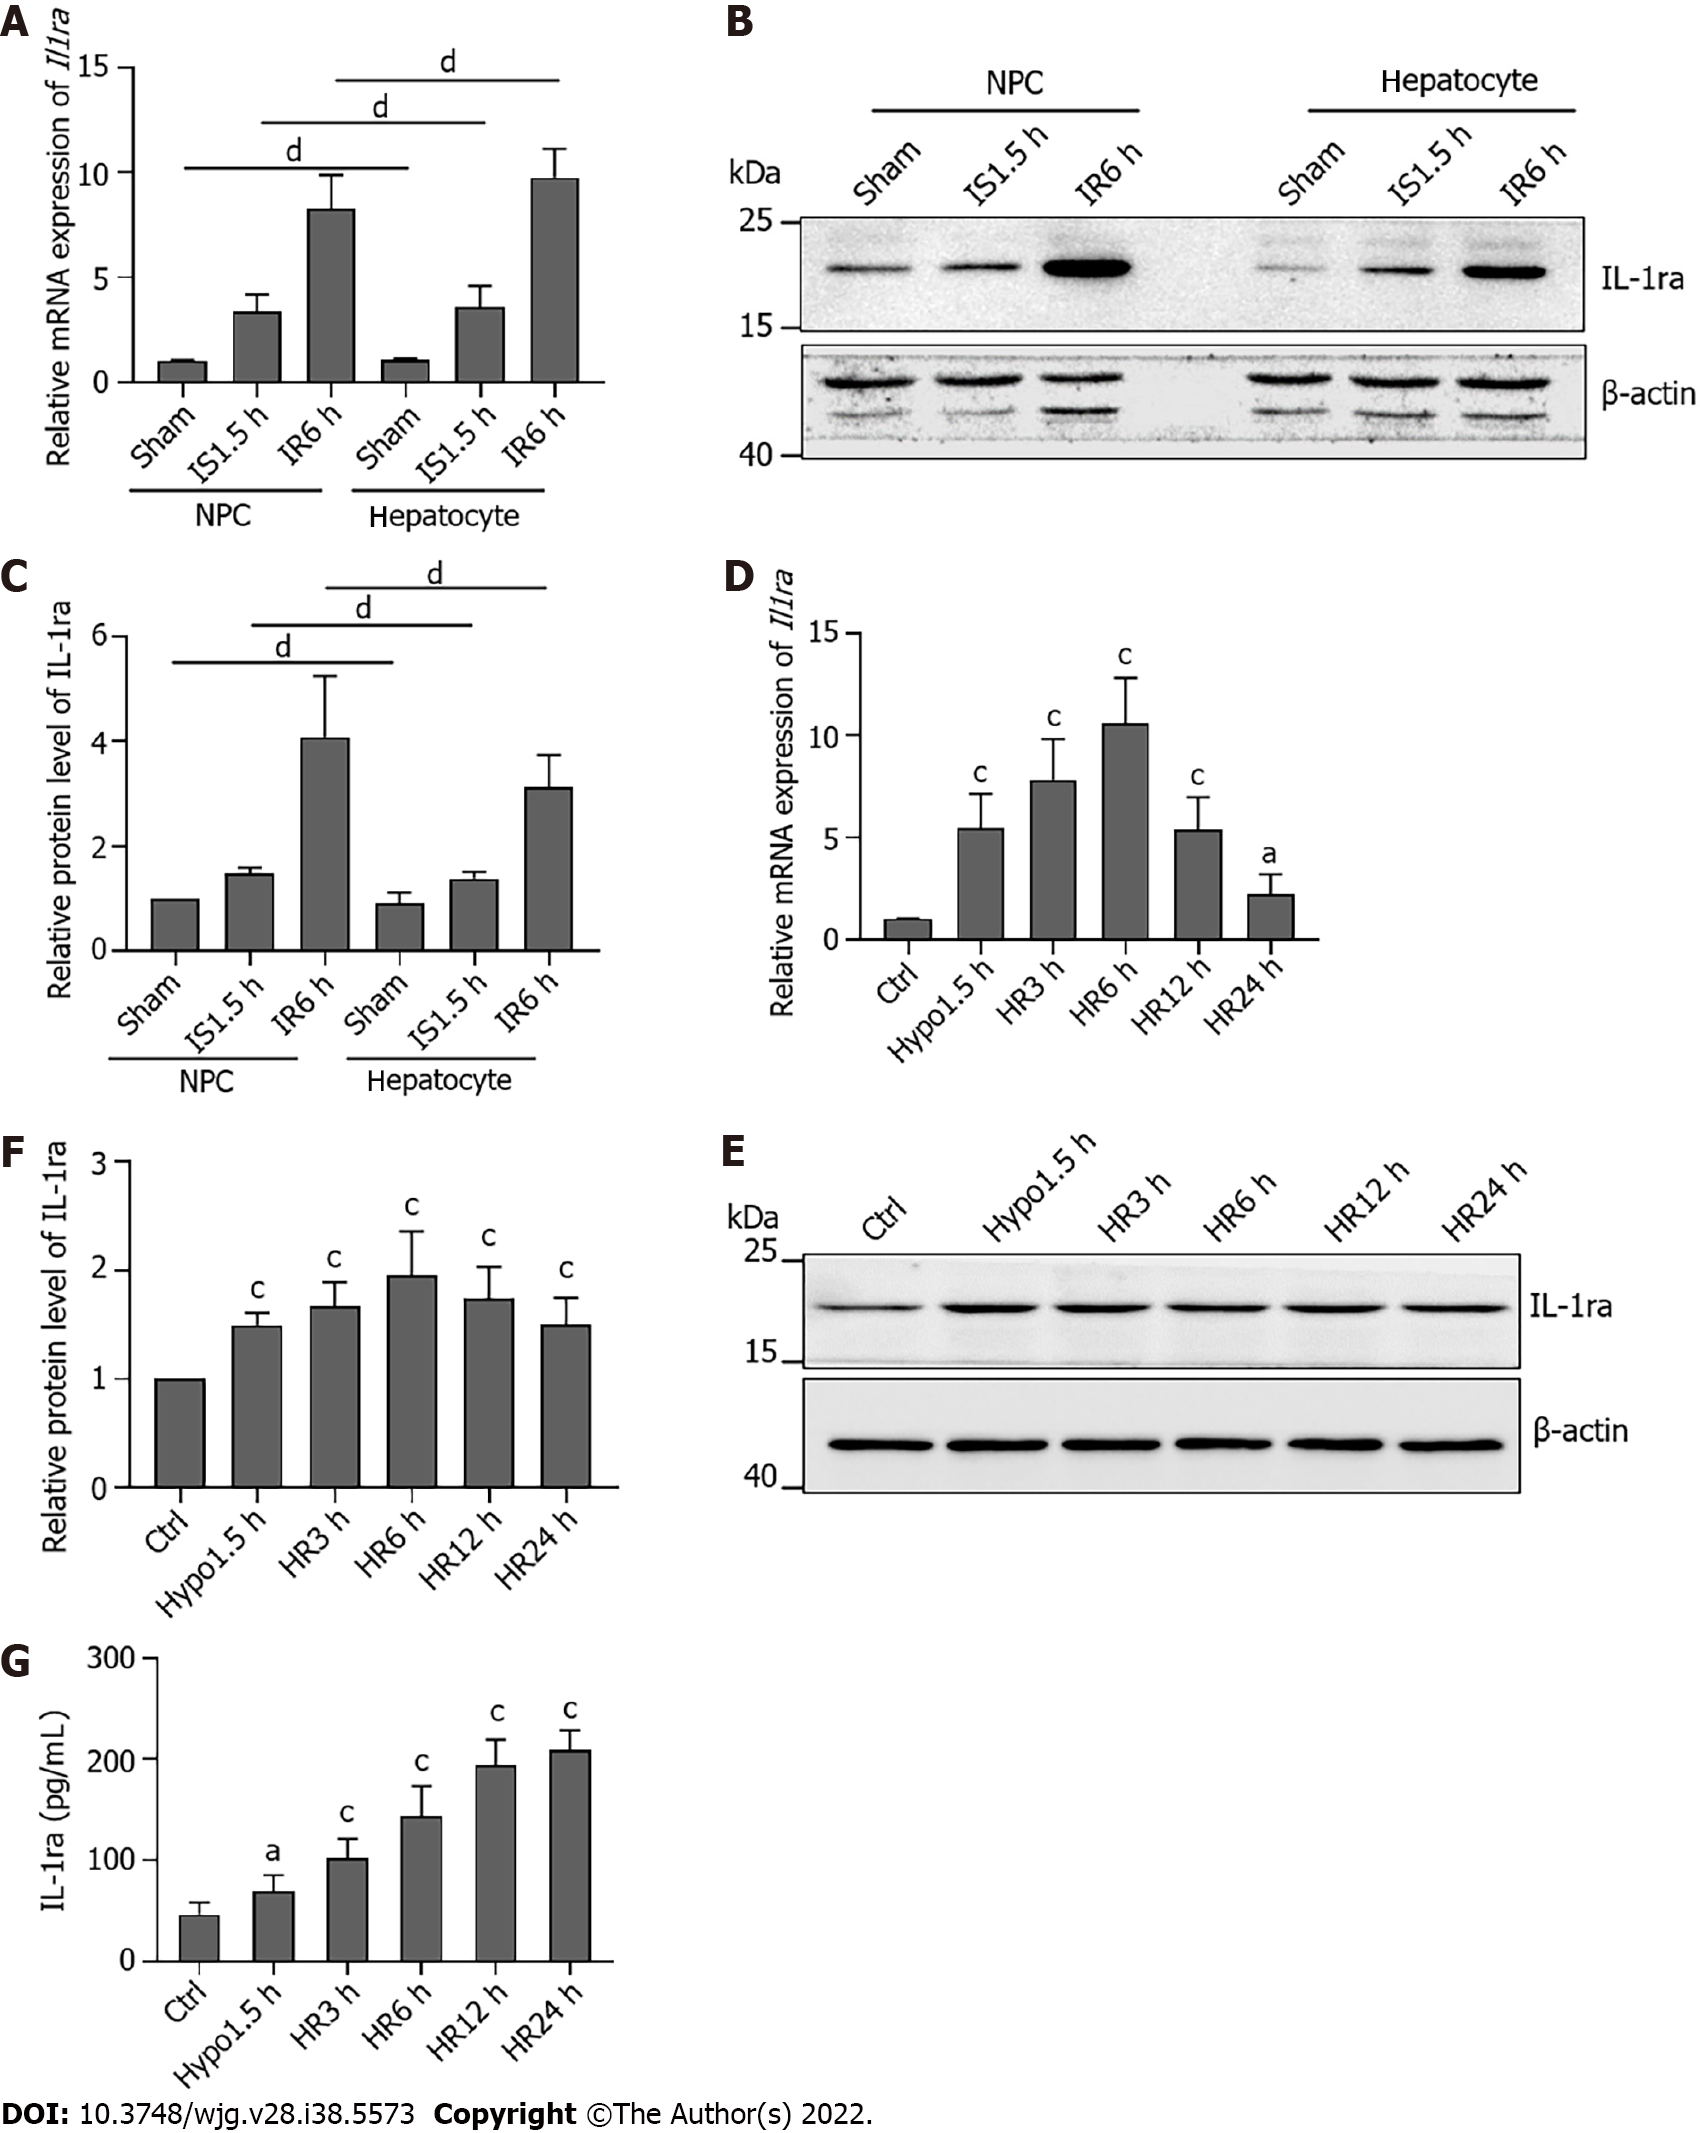
Figure 3 Interleukin-1 receptor antagonist is expressed in both mouse hepatocytes and nonparenchymal cells.
A: Relative mRNA levels of interleukin-1 receptor antagonist (Il1ra) in hepatocytes and nonparenchymal cells (NPCs) after ischemia-reperfusion injury (IRI); B: Protein levels of IL-1ra in hepatocytes and NPCs after IRI; C: Statistical analysis of protein levels of IL-1Ra in hepatocytes and NPCs after IRI; D: Relative mRNA levels of Il1ra in AML12 cells upon hypoxia-reoxygenation (HR); E: Protein levels of IL-1ra in AML12 cells upon HR; F: Statistical analysis of protein levels of IL-1Ra in AML12 cells upon HR; G: Protein content of IL-1ra in culture medium upon HR. Indicated P values were calculated using two-tailed unpaired Student’s t-tests. Data are presented as the mean ± SEM. Data are representative of five independent experiments. nsP > 0.05, aP < 0.05, bP < 0.001. HR: Hypoxia-reoxygenation; NPCs: Nonparenchymal cells; IL-1ra: Interleukin-1 receptor antagonist.
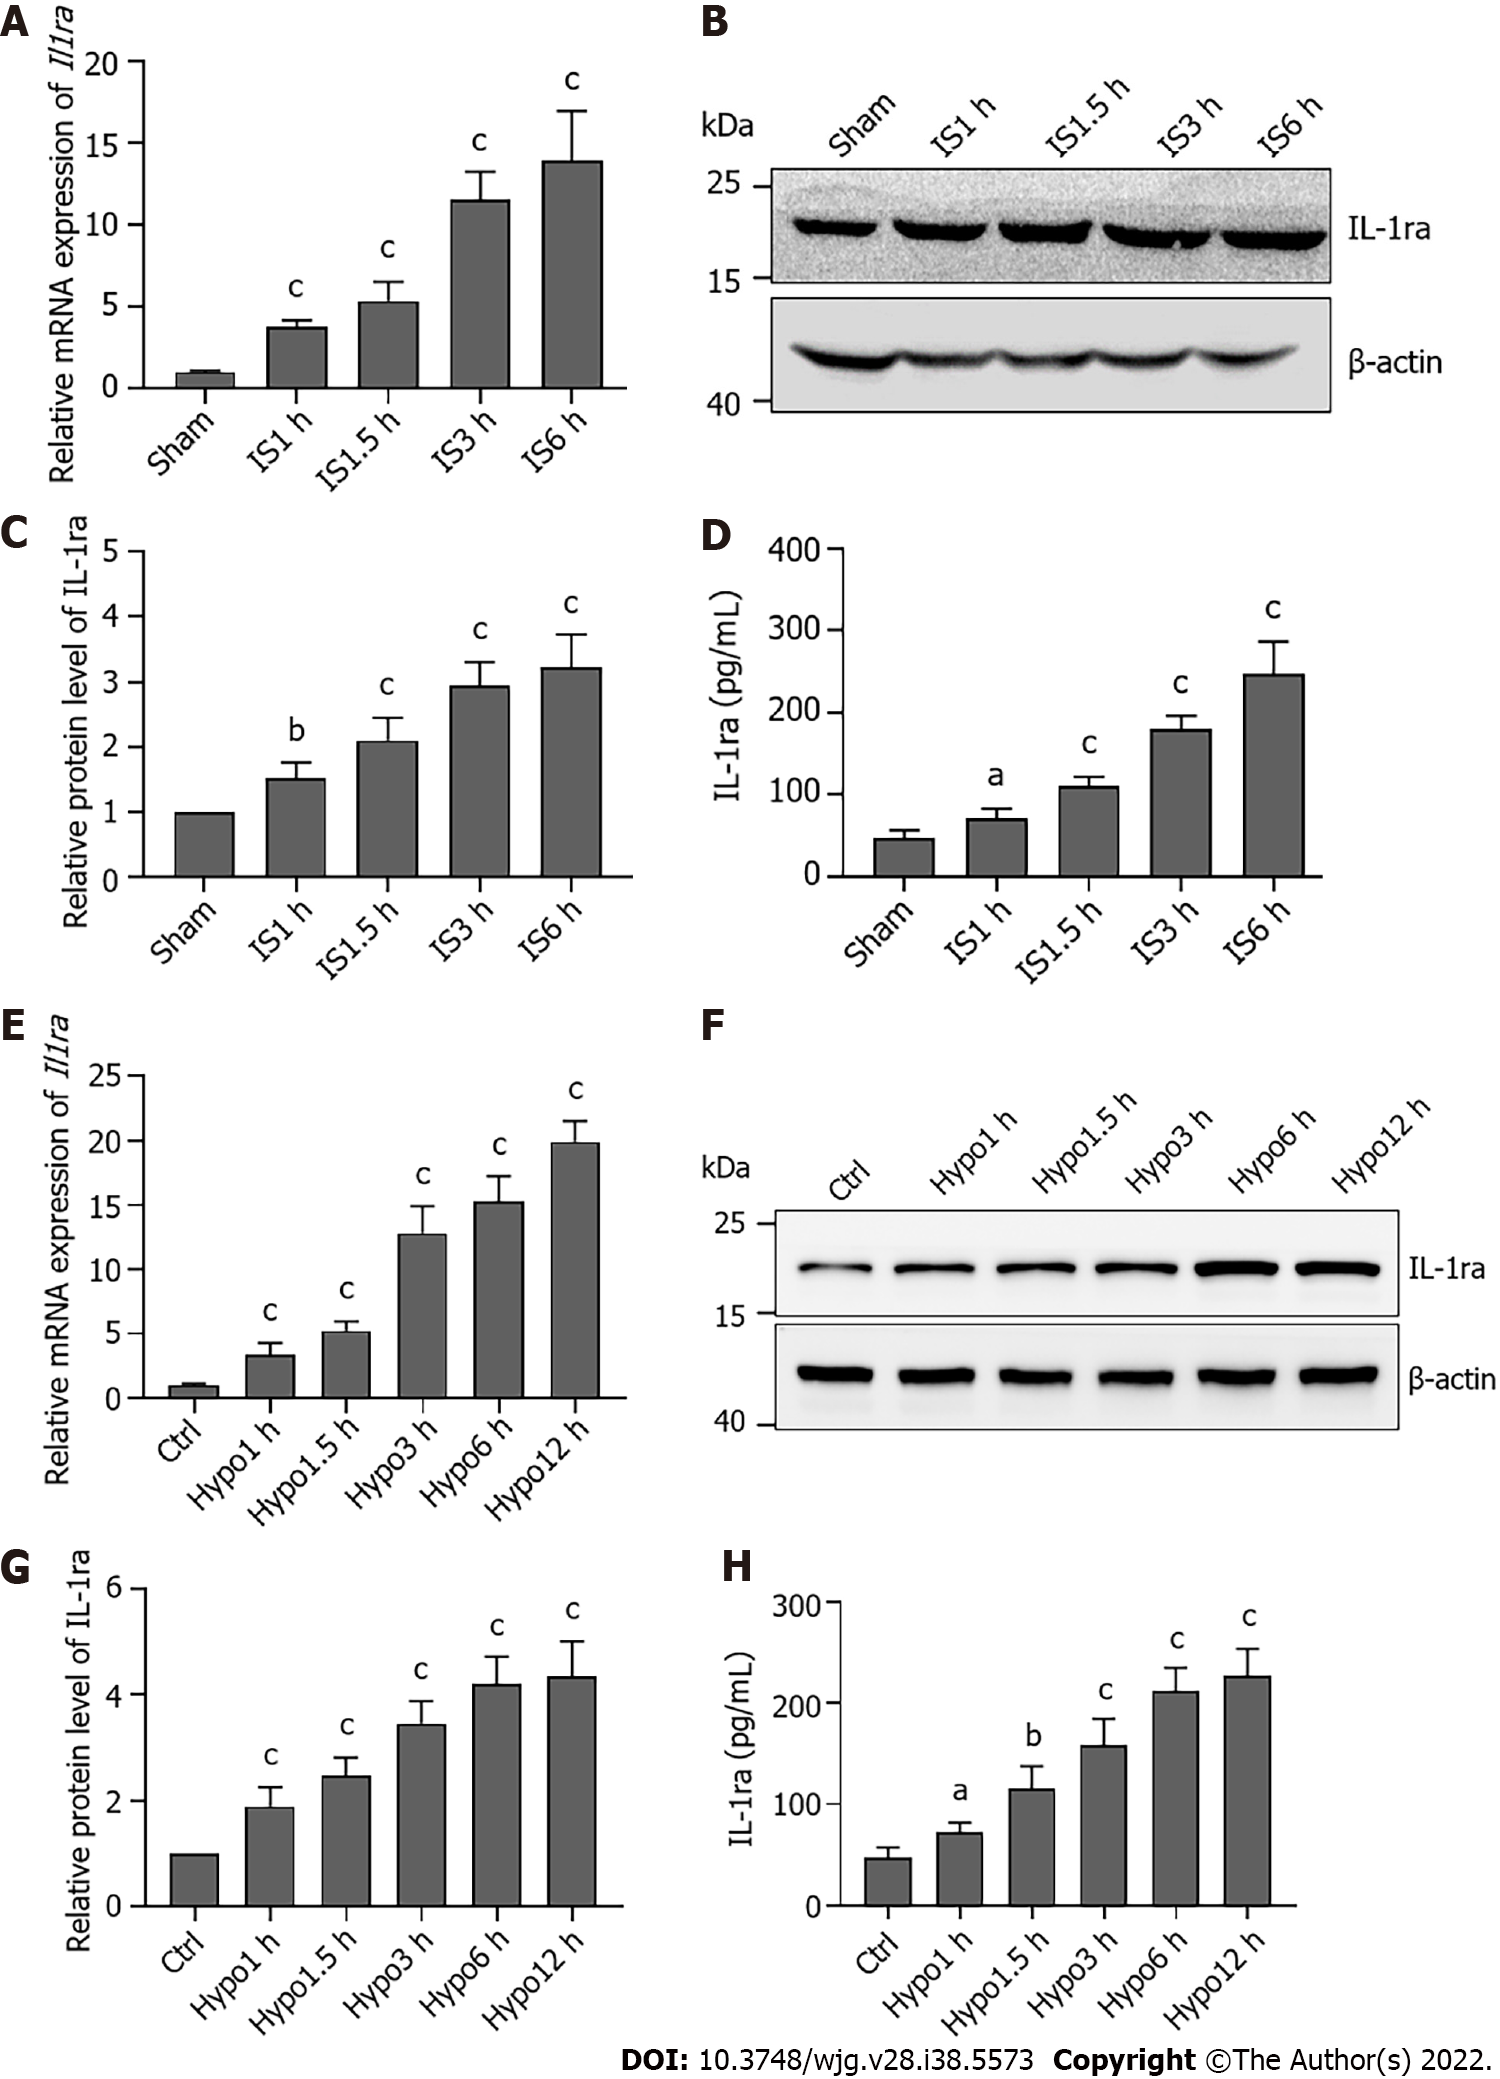
Figure 4 Interleukin-1 receptor antagonist expression is elevated during ischemia or hypoxia.
A: Relative mRNA levels of interleukin-1 receptor antagonist (Il1ra) in the liver upon ischemia; B: Protein levels of IL-1ra in the liver upon ischemia; C: Statistical analysis of protein levels of IL-1ra upon ischemia; D: Protein content of IL-1ra in serum upon ischemia; E: Relative mRNA levels of Il1ra in AML12 cells upon hypoxia; F: Protein levels of IL-1ra in AML12 cells upon hypoxia; G: Statistical analysis of protein levels of IL-1Ra in AML12 cells upon hypoxia; H: Protein content of IL-1ra in culture medium upon ischemia. Indicated P values were calculated using two-tailed unpaired Student’s t-tests. Data are presented as the mean ± SEM. Data are representative of five independent experiments. aP < 0.05, bP < 0.01, cP < 0.001. Hypo: Hypoxia; IS: Ischemia; IL-1ra: Interleukin-1 receptor antagonist.
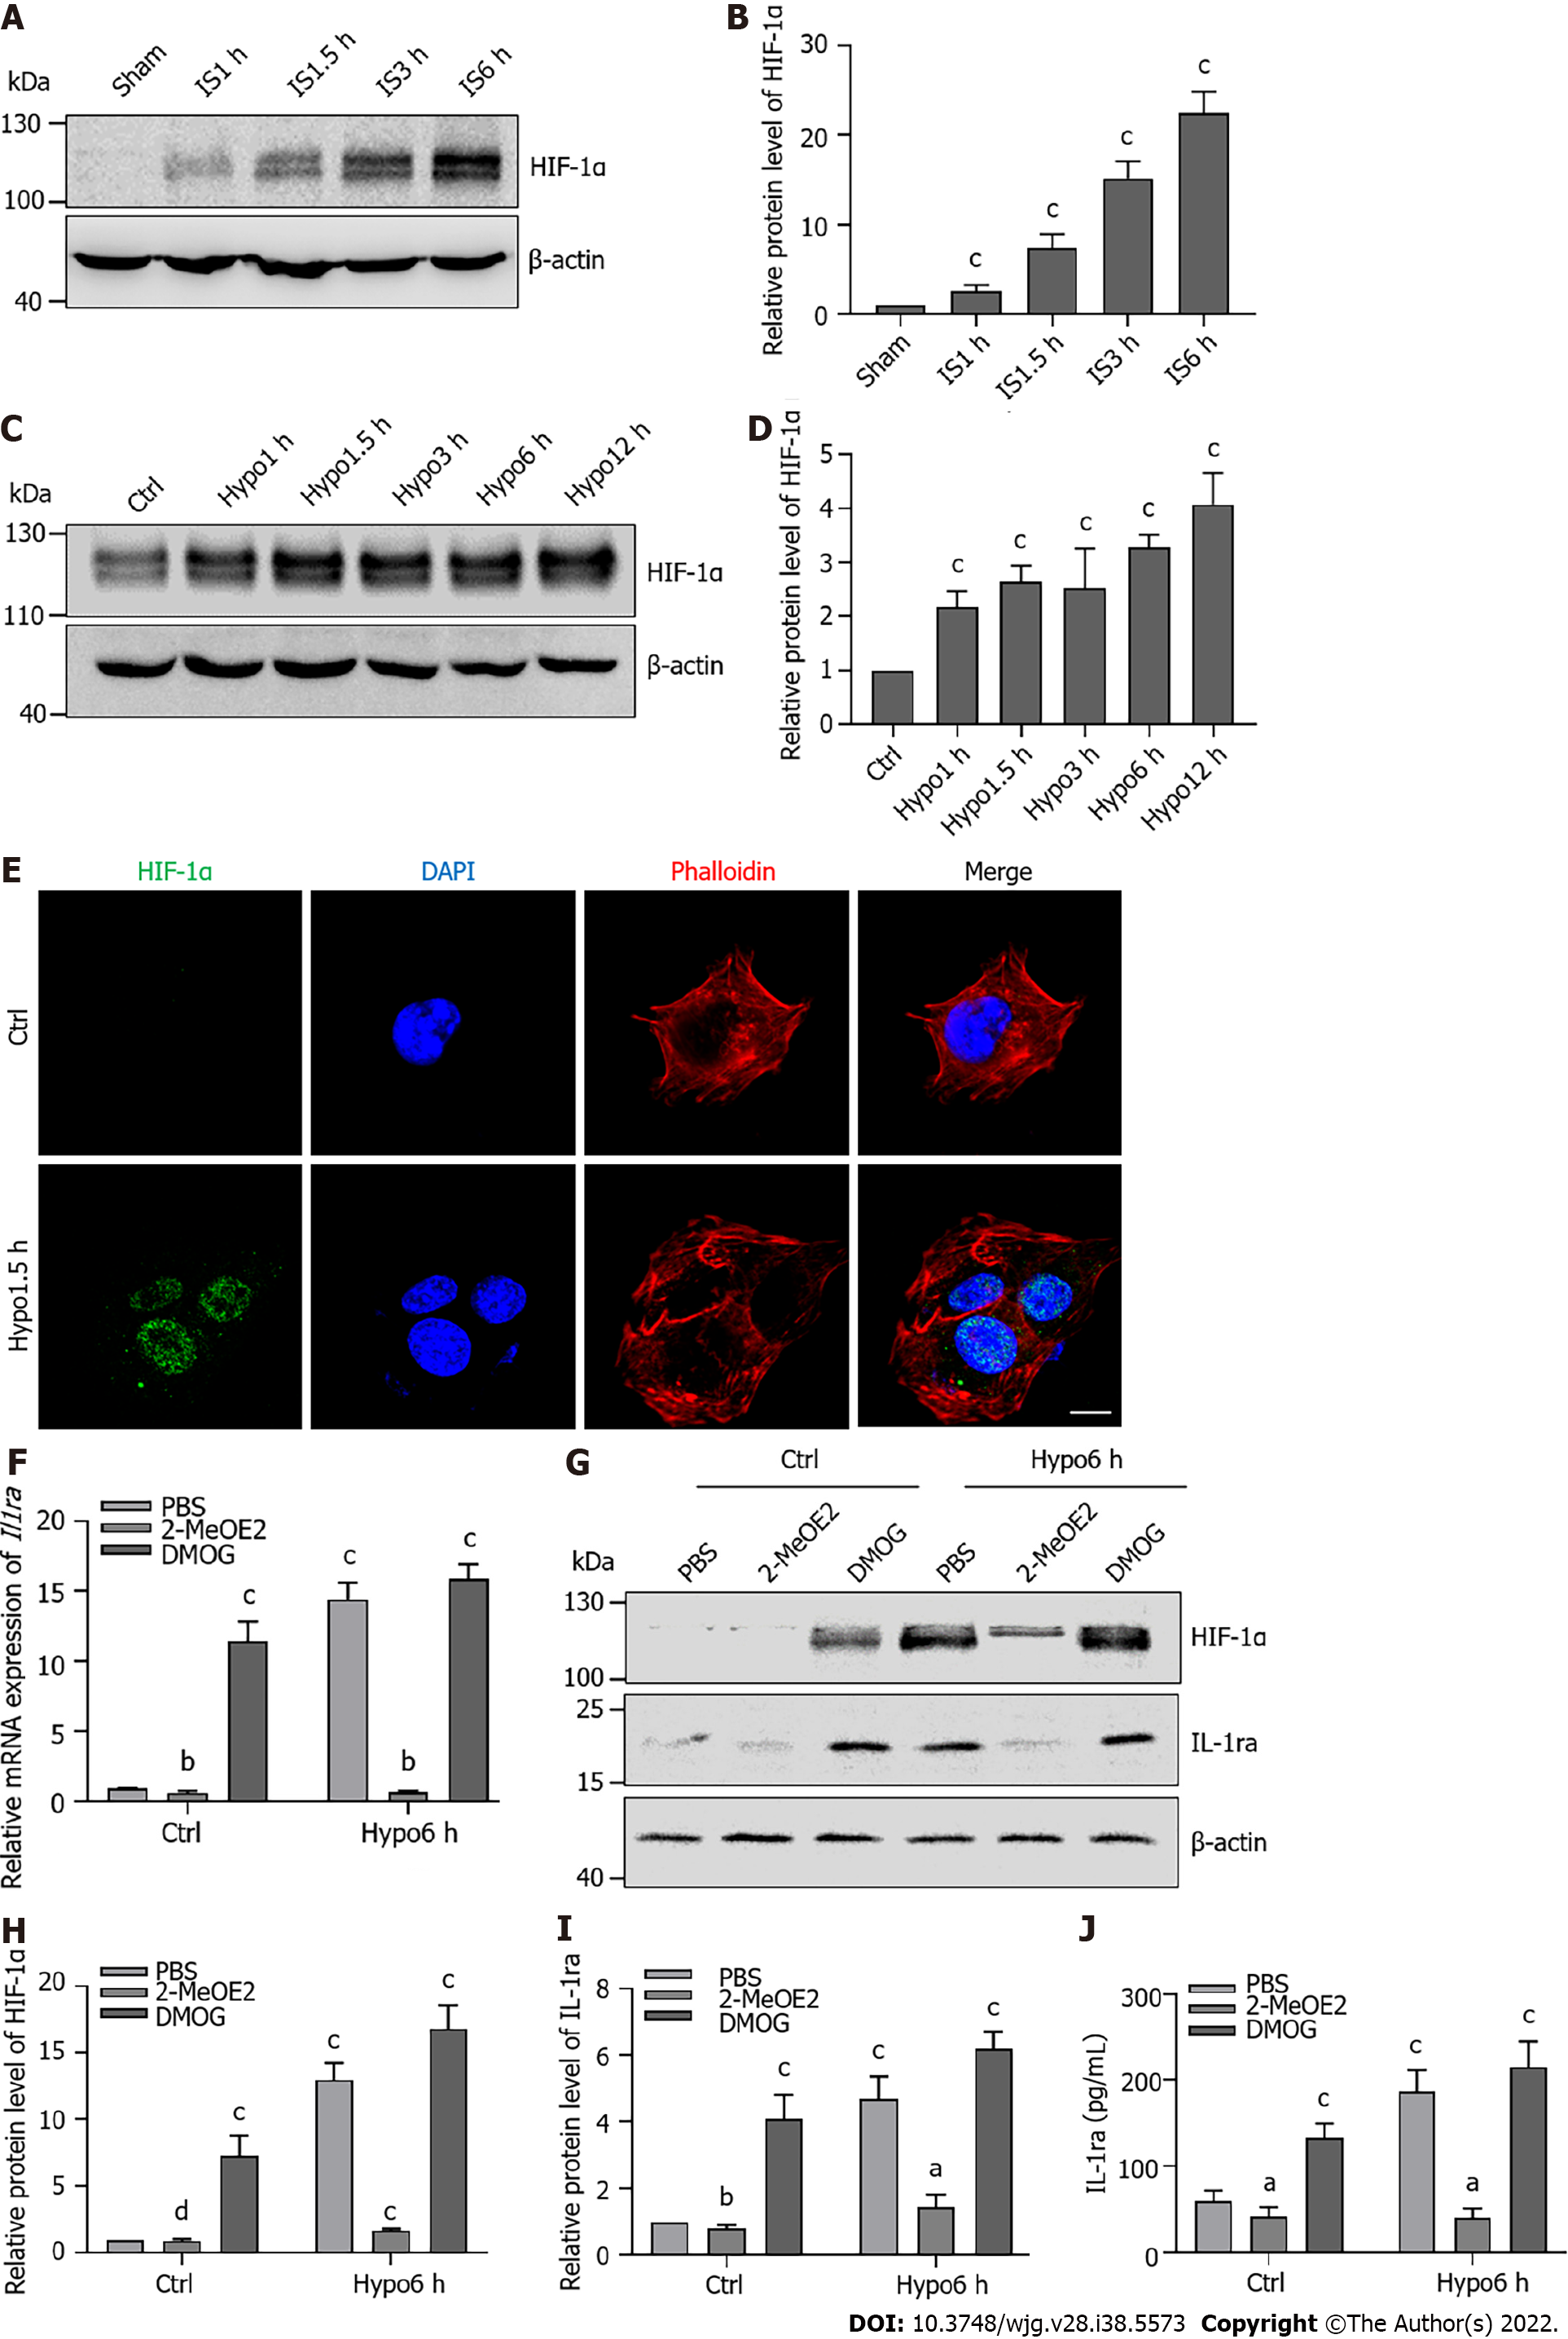
Figure 5 Hypoxia-inducible factor-1α promotes the expression of interleukin-1 receptor antagonist during ischemia or hypoxia.
A: Protein levels of hypoxia-inducible factor (HIF)-1α in the liver upon ischemia; B: Statistical analysis of protein levels of HIF-1α in the liver upon ischemia; C: Protein levels of HIF-1α in AML12 cells upon hypoxia; D: Statistical analysis of protein levels of HIF-1α in AML12 cells upon hypoxia; E: Immunofluorescence staining for HIF-1α in AML12 cells upon hypoxia for 1.5 h. Scale bars, 10 μm; F: Relative mRNA levels of interleukin-1 receptor antagonist (Il1ra) in AML12 cells treated with 2-MeOE2 (100 μΜ) and DMOG (100 μΜ) upon hypoxia; G: Protein levels of HIF-1α and IL-1ra in AML12 cells treated with 2-MeOE2 and DMOG upon hypoxia; H: Statistical analysis of protein levels of HIF-1α in AML12 cells treated with 2-MeOE2 and DMOG upon hypoxia; I: Statistical analysis of protein levels of IL-1ra in AML12 cells treated with 2-MeOE2 and DMOG upon hypoxia; J: Protein content of IL-1ra in culture medium of in AML12 cells treated with 2-MeOE2 and DMOG upon hypoxia. Indicated P-values were calculated using two-tailed unpaired Student’s t-tests. Data are presented as the mean ± SEM. Dots depict individual samples. nsP > 0.05, aP < 0.05, bP < 0.01, cP < 0.001. Hypo: Hypoxia; IS: Ischemia; HIF: Hypoxia-inducible factor; IL-1ra: Interleukin-1 receptor antagonist; IgG: Immunoglobulin G.
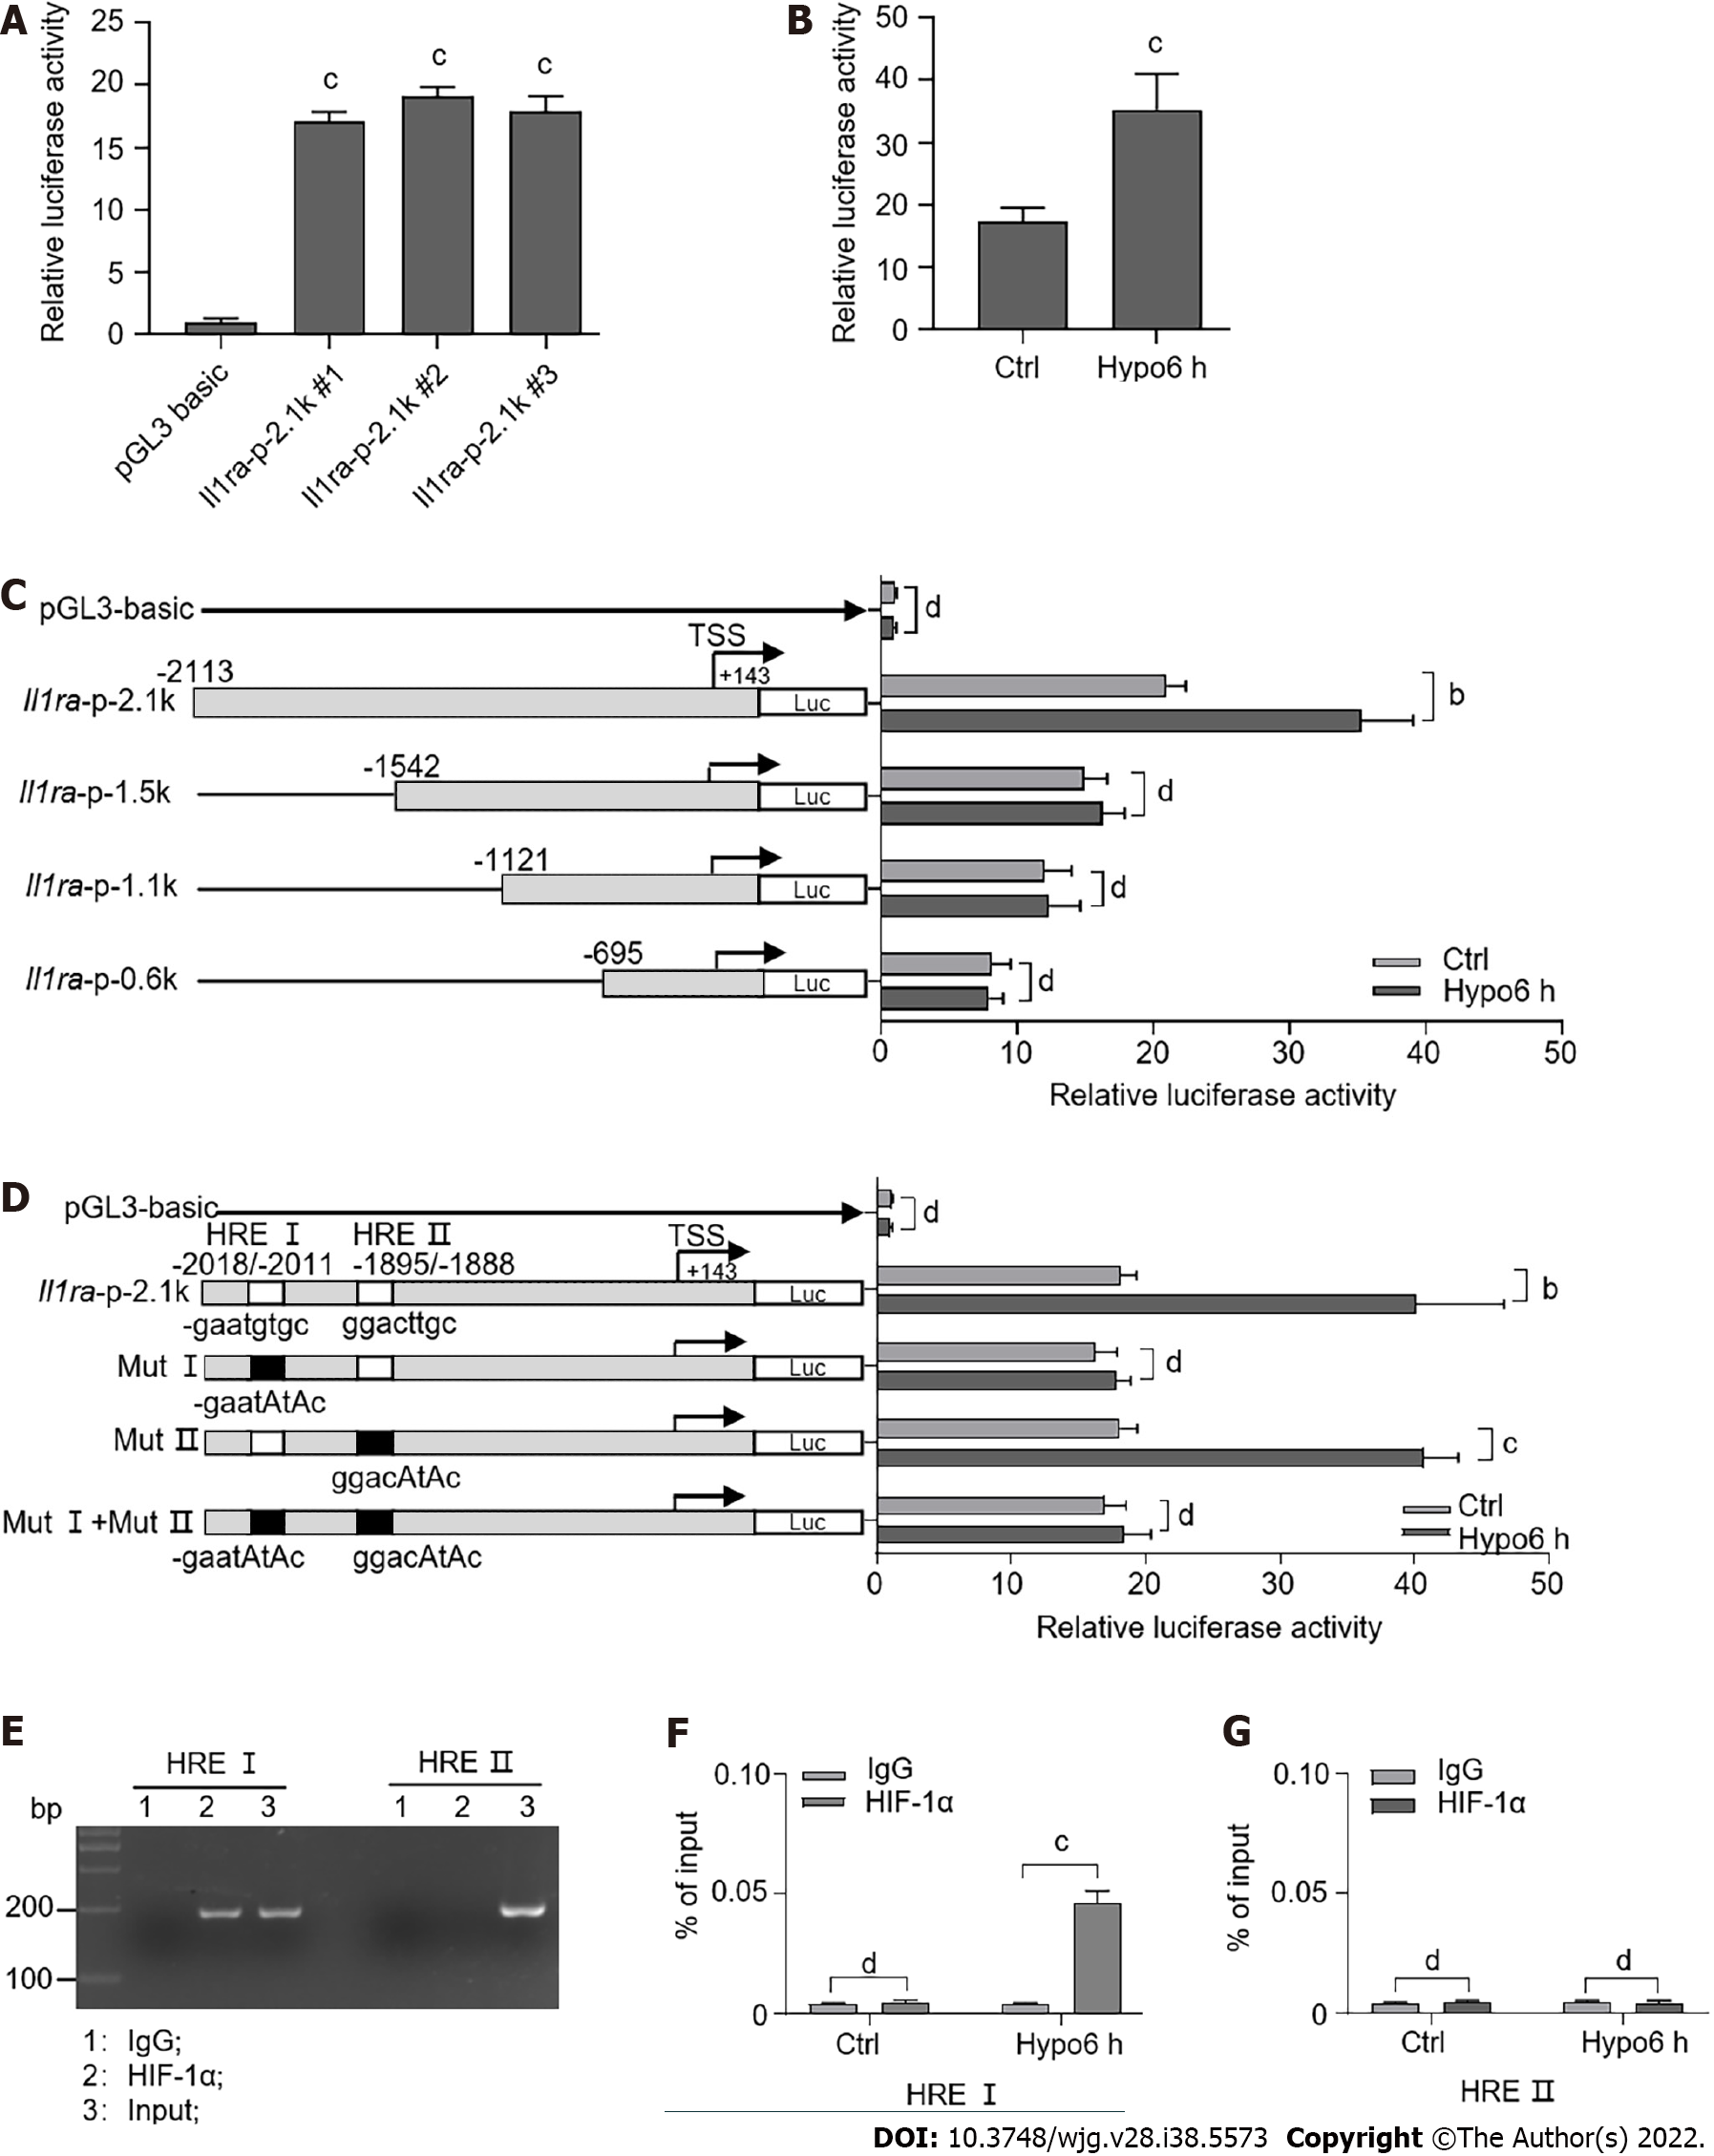
Figure 6 Hypoxia-inducible factor transcriptionally upregulates interleukin-1 receptor antagonist expression.
A: Luciferase assay for the wild-type promoter (-2113/+143) of interleukin-1 receptor antagonist (Il1ra) in AML12 cells; B: Luciferase assay for the wild-type promoter of Il1ra in AML12 cells upon hypoxia; C: Luciferase assay for wild-type and truncated promoters of Il1ra in AML12 cells upon hypoxia; D: Luciferase assay for wild-type (-2113/+143) and HRE-mutated promoters of Il1ra upon hypoxia; E: Chromatin immunoprecipitation assay for hypoxia-inducible factor (HIF)-1α binding to HRE sites upon hypoxia; F and G: Quantitative polymerase chain reaction analysis for the recruitment of HIF-1α to the endogenous Il1ra promoter in AML12 cells upon hypoxia. Indicated P-values were calculated using two-tailed unpaired Student’s t-tests. Data are presented as the mean ± SEM. Data are representative of independent experiments. nsP > 0.05, aP < 0.01, bP < 0.001. Hypo: Hypoxia; IS: Ischemia; HIF: Hypoxia-inducible factor; IL-1ra: Interleukin-1 receptor antagonist; IgG: Immunoglobulin G.
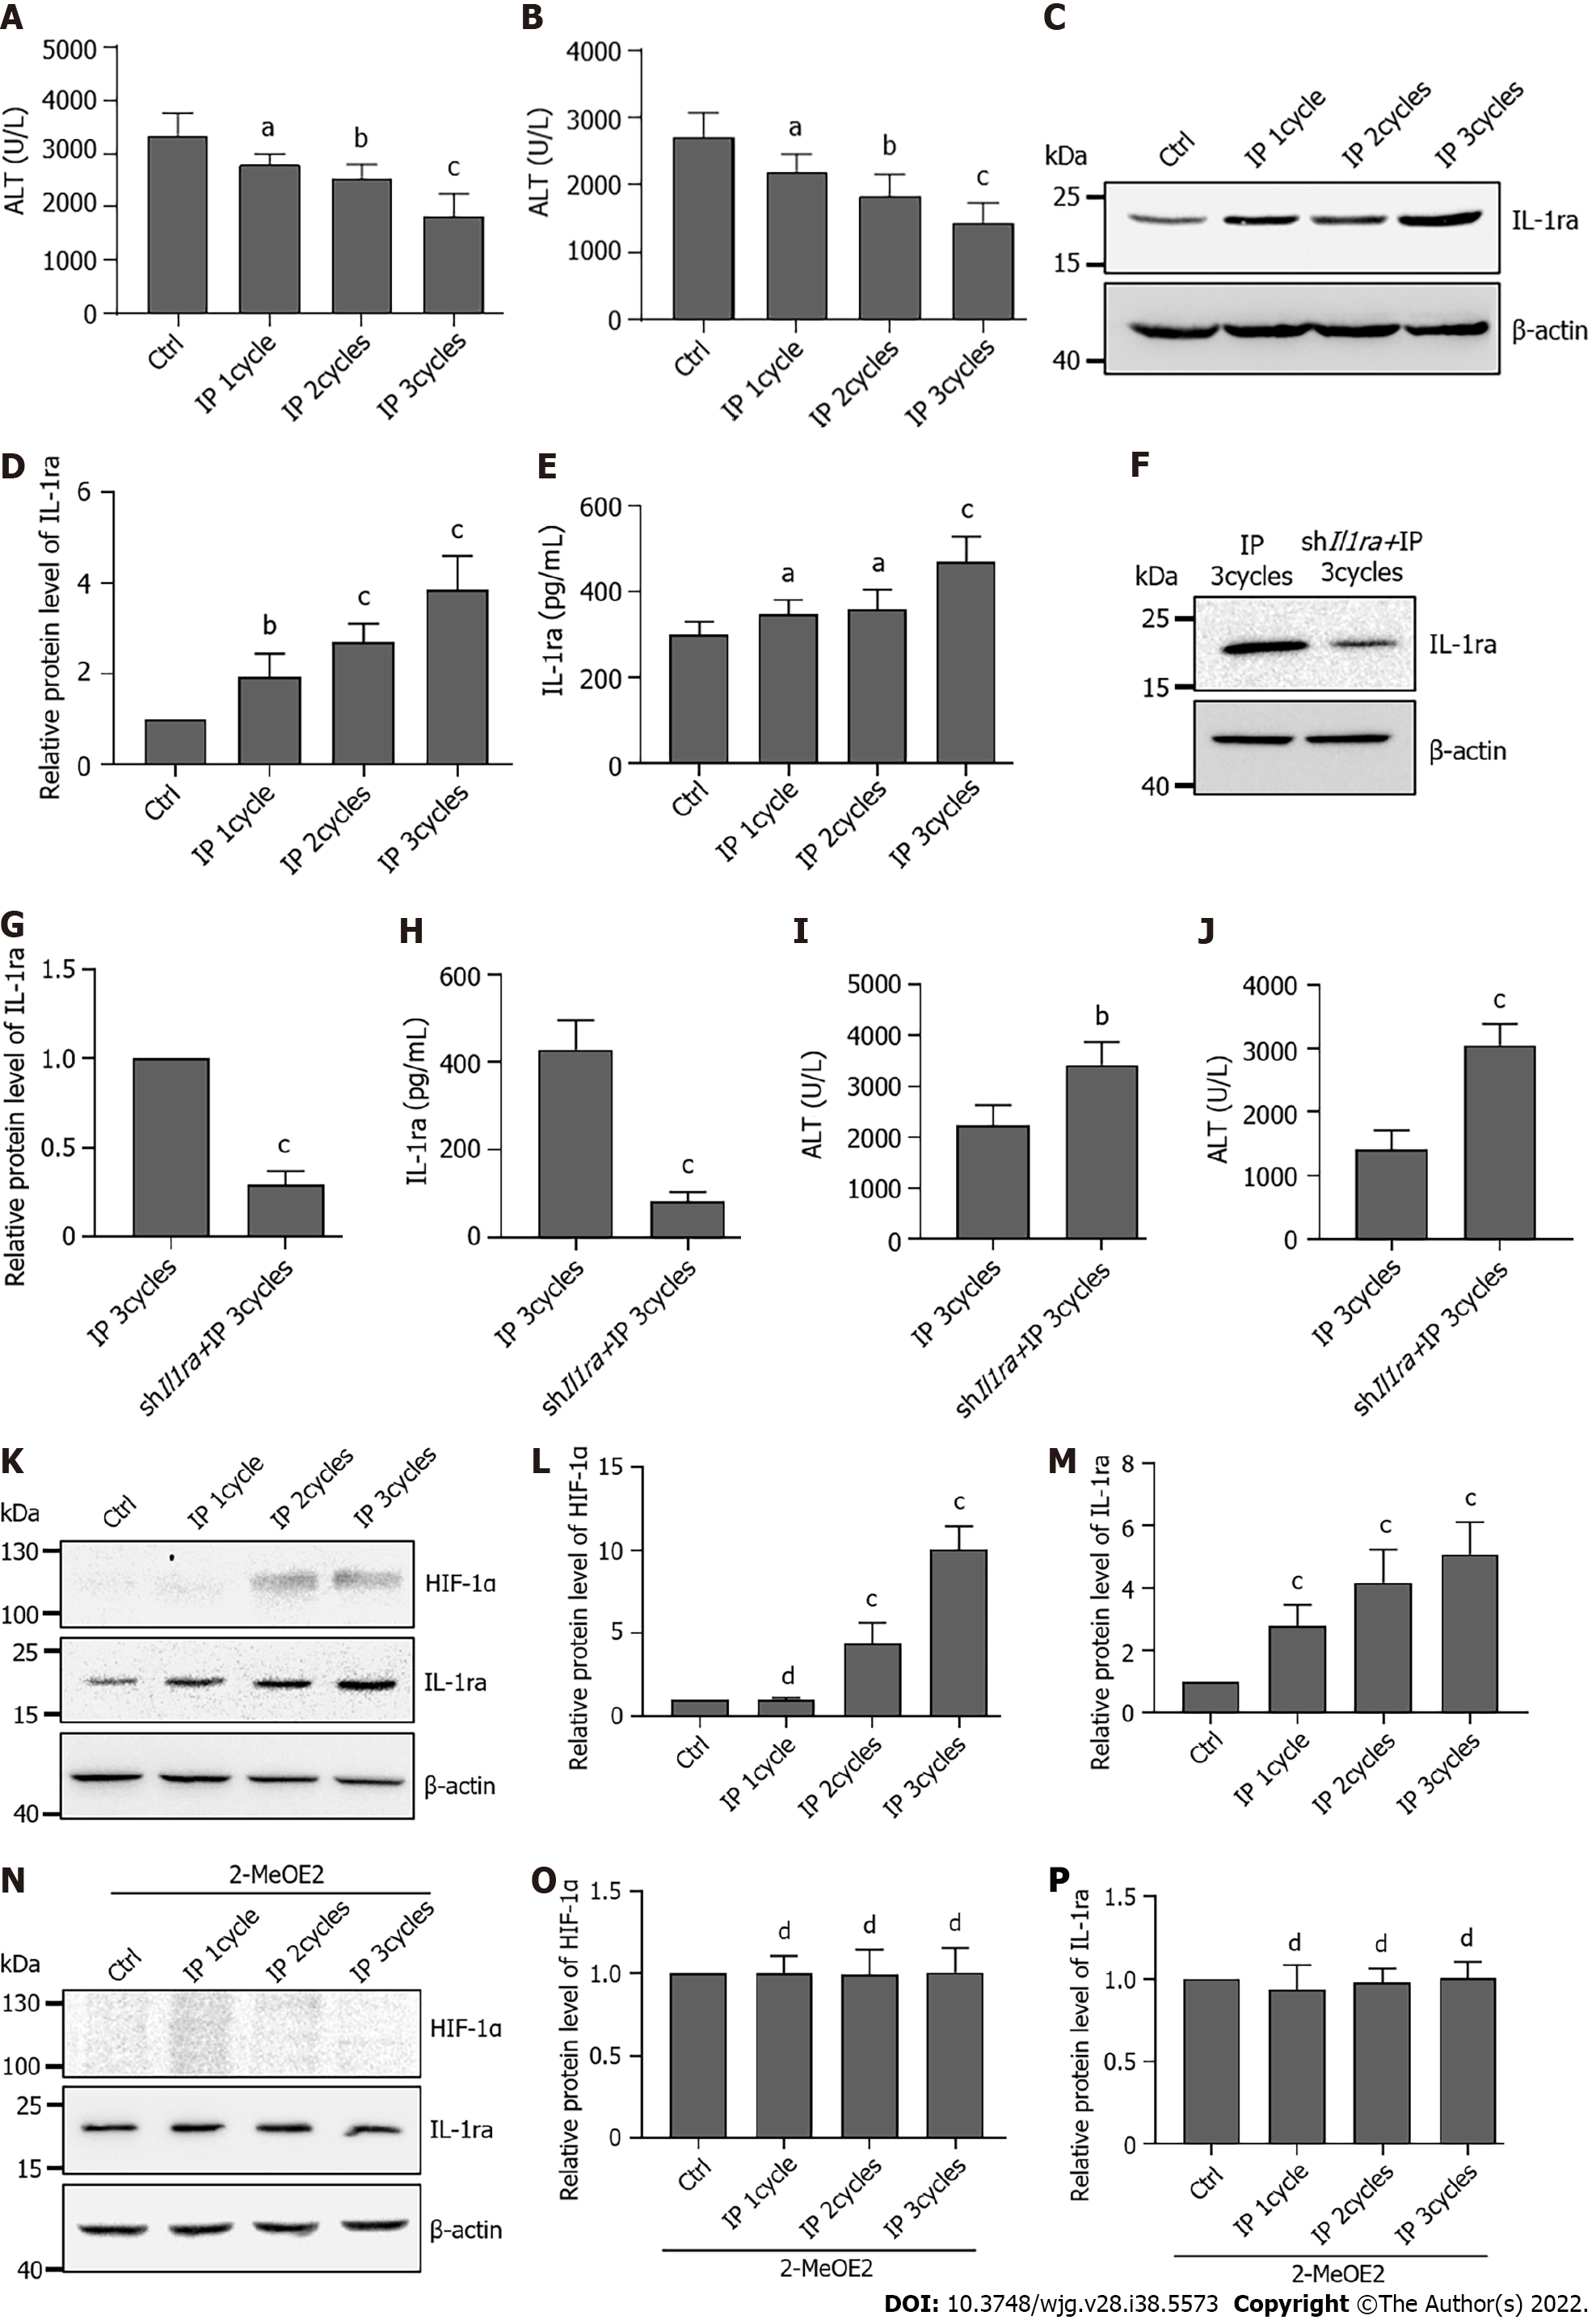
Figure 7 Ischemic preconditioning protects the liver by promoting interleukin-1 receptor antagonist expression via hypoxia-inducible factor-1α.
A: Serum alanine transaminase (ALT) levels in mice undergoing ischemia-reperfusion injury (IRI) after different ischemic preconditioning (IP) cycles; B: Serum aspartate transaminase (AST) levels in mice undergoing IRI after different IP cycles; C: Protein levels of interleukin-1 receptor antagonist (IL-1ra) in the liver after different IP cycles; D: Statistical analysis of protein levels of IL-1ra after different IP cycles; E: Protein content of IL-1ra in serum after different IP cycles; F: Protein levels of IL-1ra in the liver with shIl1ra injection after three IP cycles; G: Statistical analysis of protein levels of IL-1ra with shIl1ra injection after three IP cycles; H: Protein content of IL-1ra in serum with shIl1ra injection after three IP cycles; I: Serum ALT levels in mice with shIl1ra injection after three IP cycles; J: Serum AST levels in mice with shIl1ra injection after three IP cycles; K: Protein levels of hypoxia-inducible factor (HIF)-1α and IL-1ra in the liver after different IP cycles; L: Statistical analysis of protein levels of HIF-1α after different IP cycles; M: Statistical analysis of protein levels of IL-1ra after different IP cycles; N: Protein levels of HIF-1α and IL-1ra in the liver with 2-MeOE2 treatment after different IP cycles; O: Statistical analysis of protein levels of HIF-1α with 2-MeOE2 treatment after different IP cycles; P: Statistical analysis of protein levels of IL-1ra with 2-MeOE2 treatment after different IP cycles; Indicated P values were calculated using two-tailed unpaired Student’s t-tests. Data are presented as the mean ± SEM. Data are representative of five independent experiments. nsP > 0.05, aP < 0.05, bP < 0.01, cP < 0.001 . IP: Ischemic preconditioning; AST: Aspartate transaminase; ALT: Alanine transaminase; IL-1ra: Interleukin-1 receptor antagonist; HIF: Hypoxia-inducible factor.
Figure 8 Model of ischemic preconditioning-induced hypoxia-inducible factor-1α-interleukin-1 receptor antagonist signaling to alleviate hepatic ischemia-reperfusion injury.
Ischemic preconditioning promotes the accumulation of hypoxia-inducible factor (HIF)-1α, which subsequently increases HIF-1α entry into the nucleus and promotes the transcriptional expression of interleukin-1 receptor antagonist (IL-1ra). In turn, this inhibits the pro-inflammatory effects of IL-1β and eventually protects against hepatic ischemia-reperfusion injury. HIF: Hypoxia-inducible factor; IL-1ra: Interleukin-1 receptor antagonist.
- Citation: Wang ZY, Liu Y, Li SP, Li JJ, Zhang Z, Xiao XC, Ou Y, Wang H, Cai JZ, Yang S. Hypoxia inducible factor 1α promotes interleukin-1 receptor antagonist expression during hepatic ischemia-reperfusion injury. World J Gastroenterol 2022; 28(38): 5573-5588
- URL: https://www.wjgnet.com/1007-9327/full/v28/i38/5573.htm
- DOI: https://dx.doi.org/10.3748/wjg.v28.i38.5573


