Copyright
©The Author(s) 2022.
World J Gastroenterol. Oct 14, 2022; 28(38): 5557-5572
Published online Oct 14, 2022. doi: 10.3748/wjg.v28.i38.5557
Published online Oct 14, 2022. doi: 10.3748/wjg.v28.i38.5557
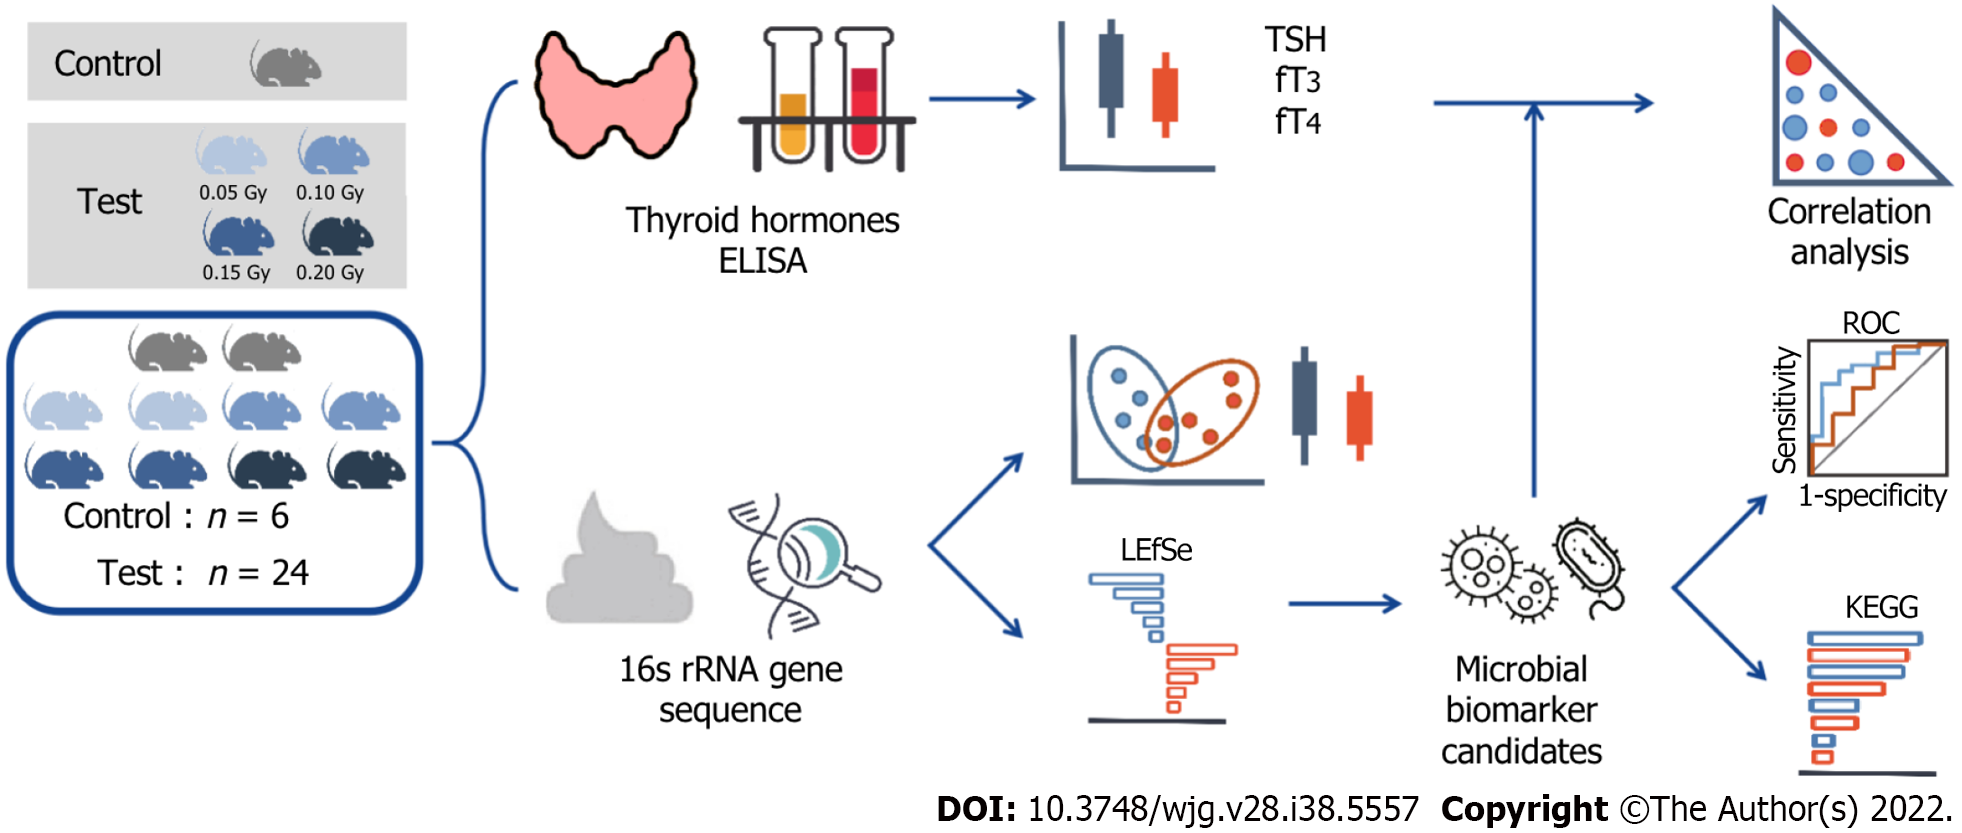
Figure 1 Graphical abstract.
Schematic showing sample workflow from sequencing to analysis. TSH: Thyroid stimulating hormone; ELISA: Enzyme-linked immunosorbent assay; ROC: Receiver operating characteristic; KEGG: Kyoto Encyclopedia of Genes and Genomes; LEfSe: Linear discriminant analysis effect size.
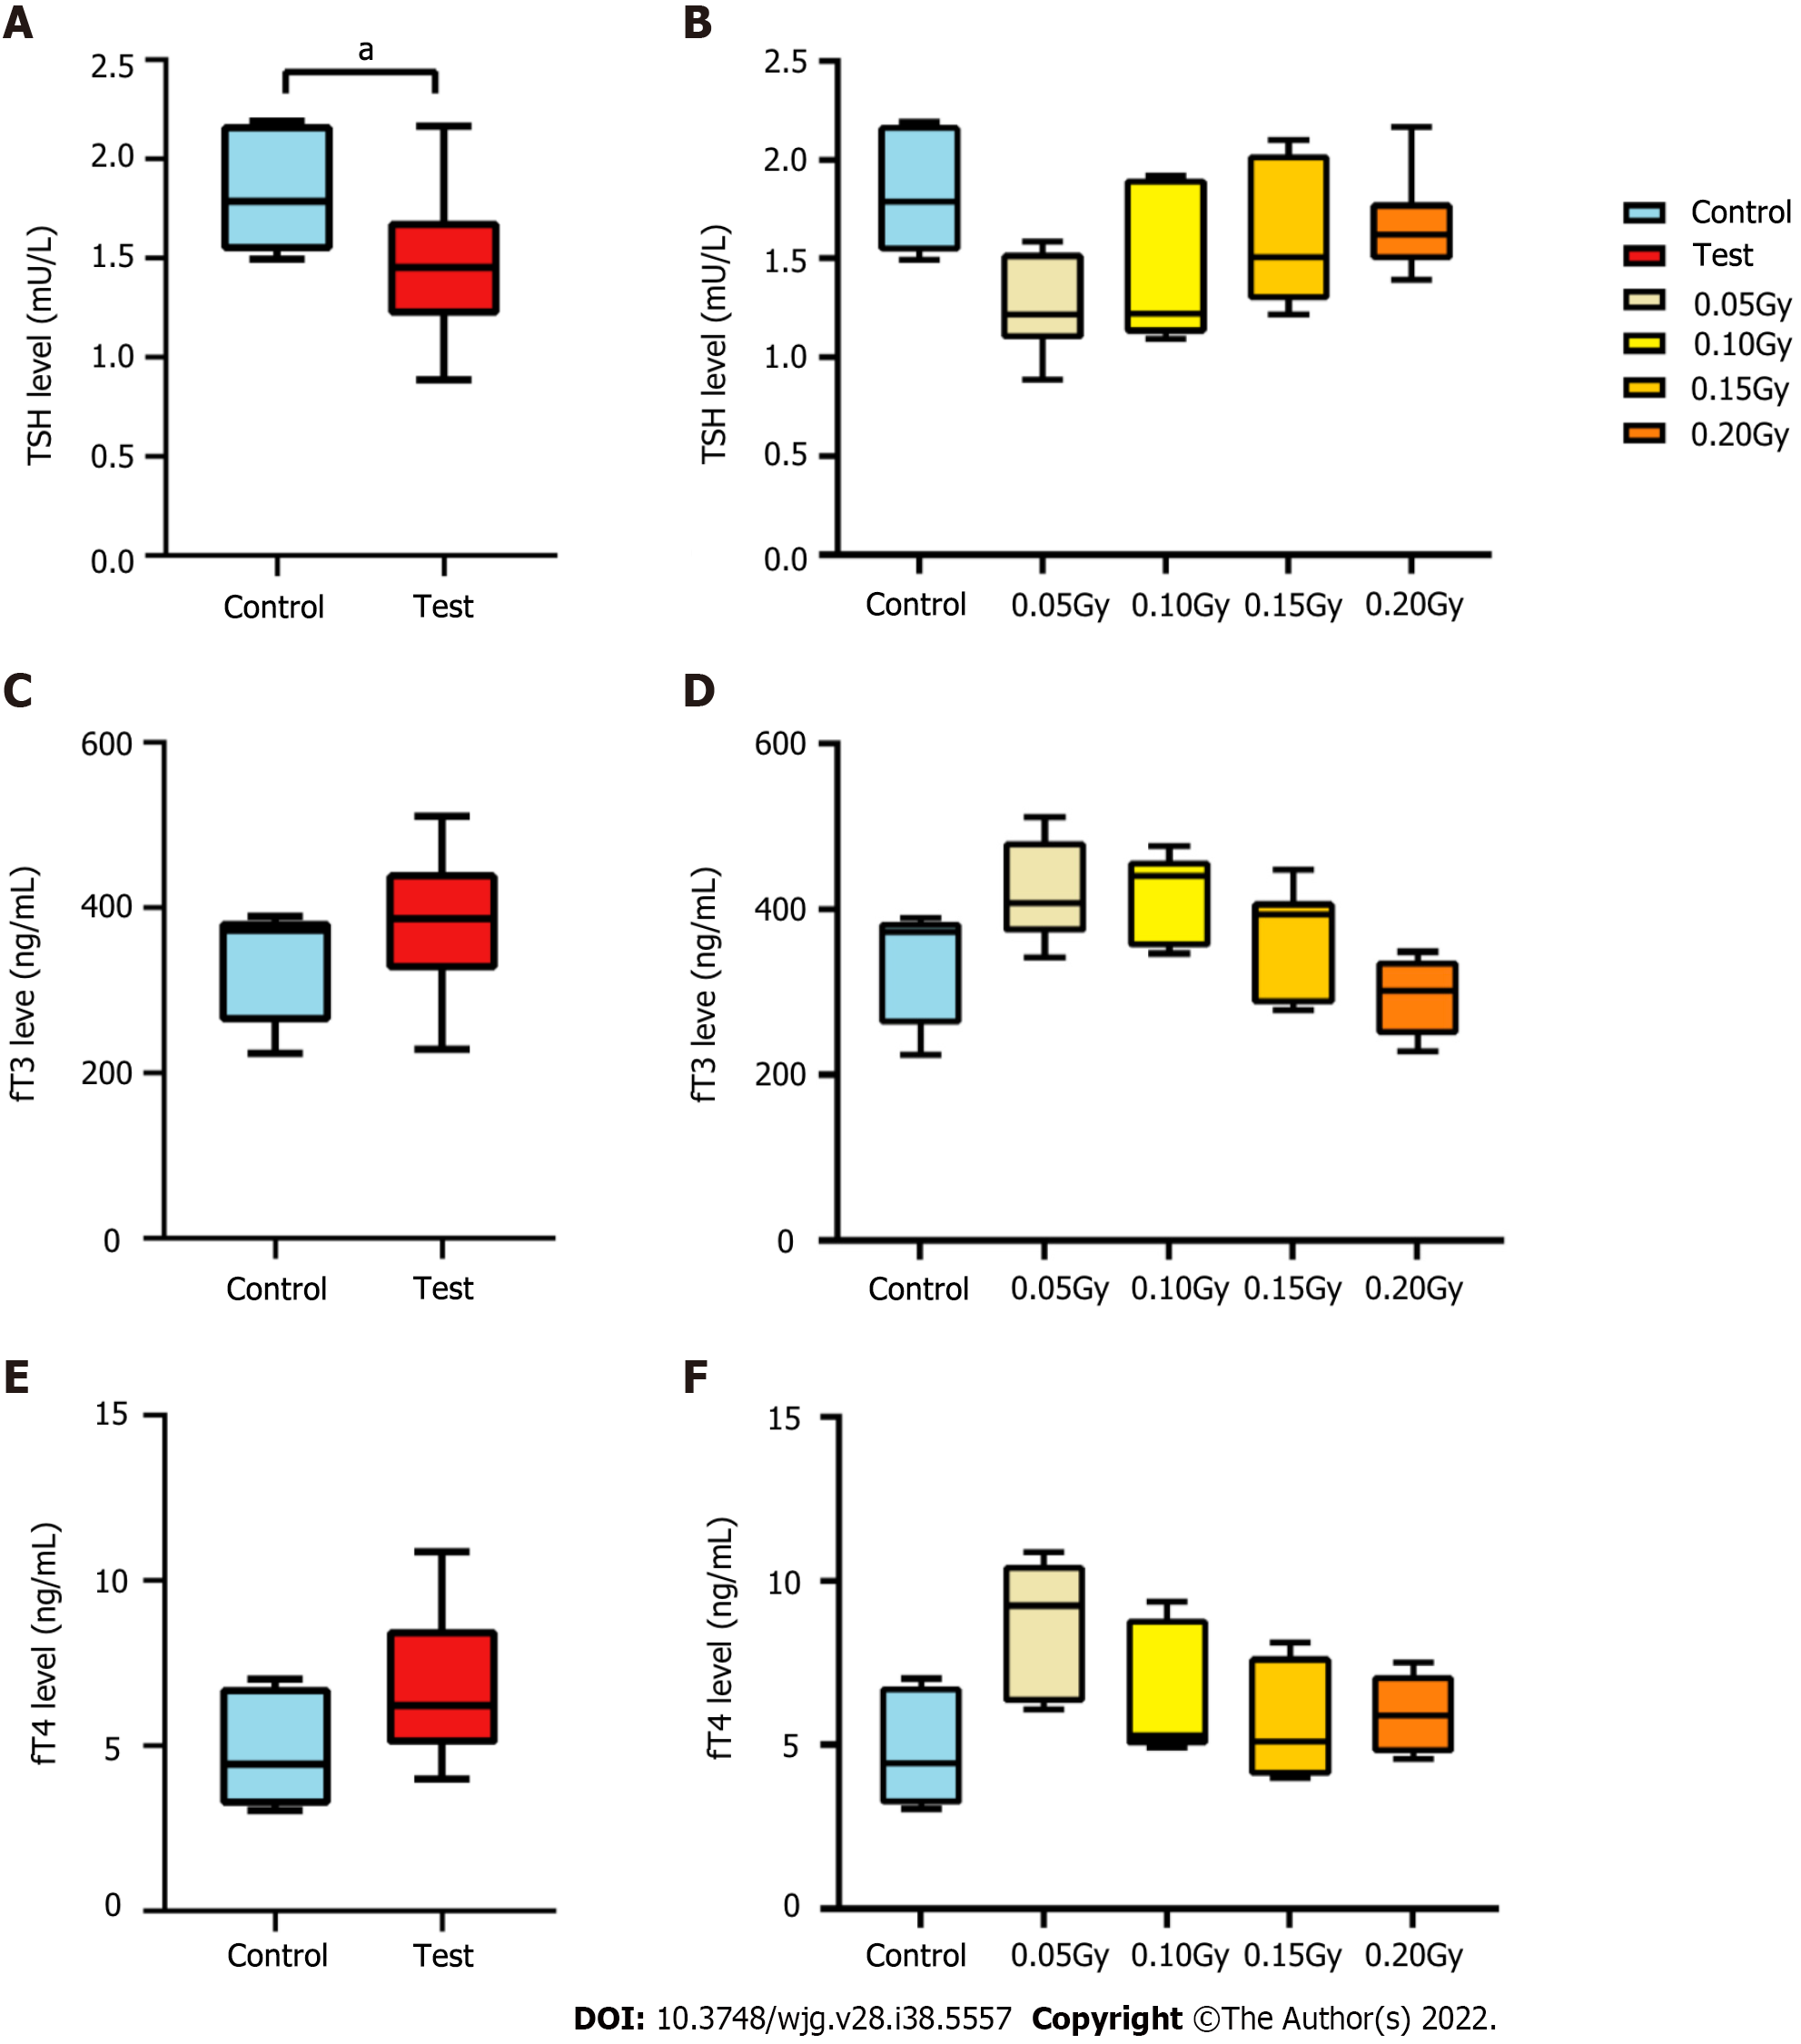
Figure 2 The level of thyroid hormone in mice exposed to radiation.
A: Box and whisker plots of the levels of thyroid stimulating hormone (TSH) in the control (n = 6) and test (n = 24) groups. The TSH level of the mice in the test group was lower than that in the control mice (t = 2.188, P = 0.037); B: Histogram of the levels of TSH from the control and test groups. Statistically significant differences were not confirmed between the two groups; C: Box and whisker plots of the level of fT3 in the control (n = 6) and test groups (n = 24); D: Histogram of the level of fT3 in the control and test subgroups; E: Box and whisker plots of the level of fT4 in the control (n = 6) and test groups (n = 24); F: Histogram of the level of fT4 in the control and test subgroups. TSH: Thyroid stimulating hormone. aP < 0.05.
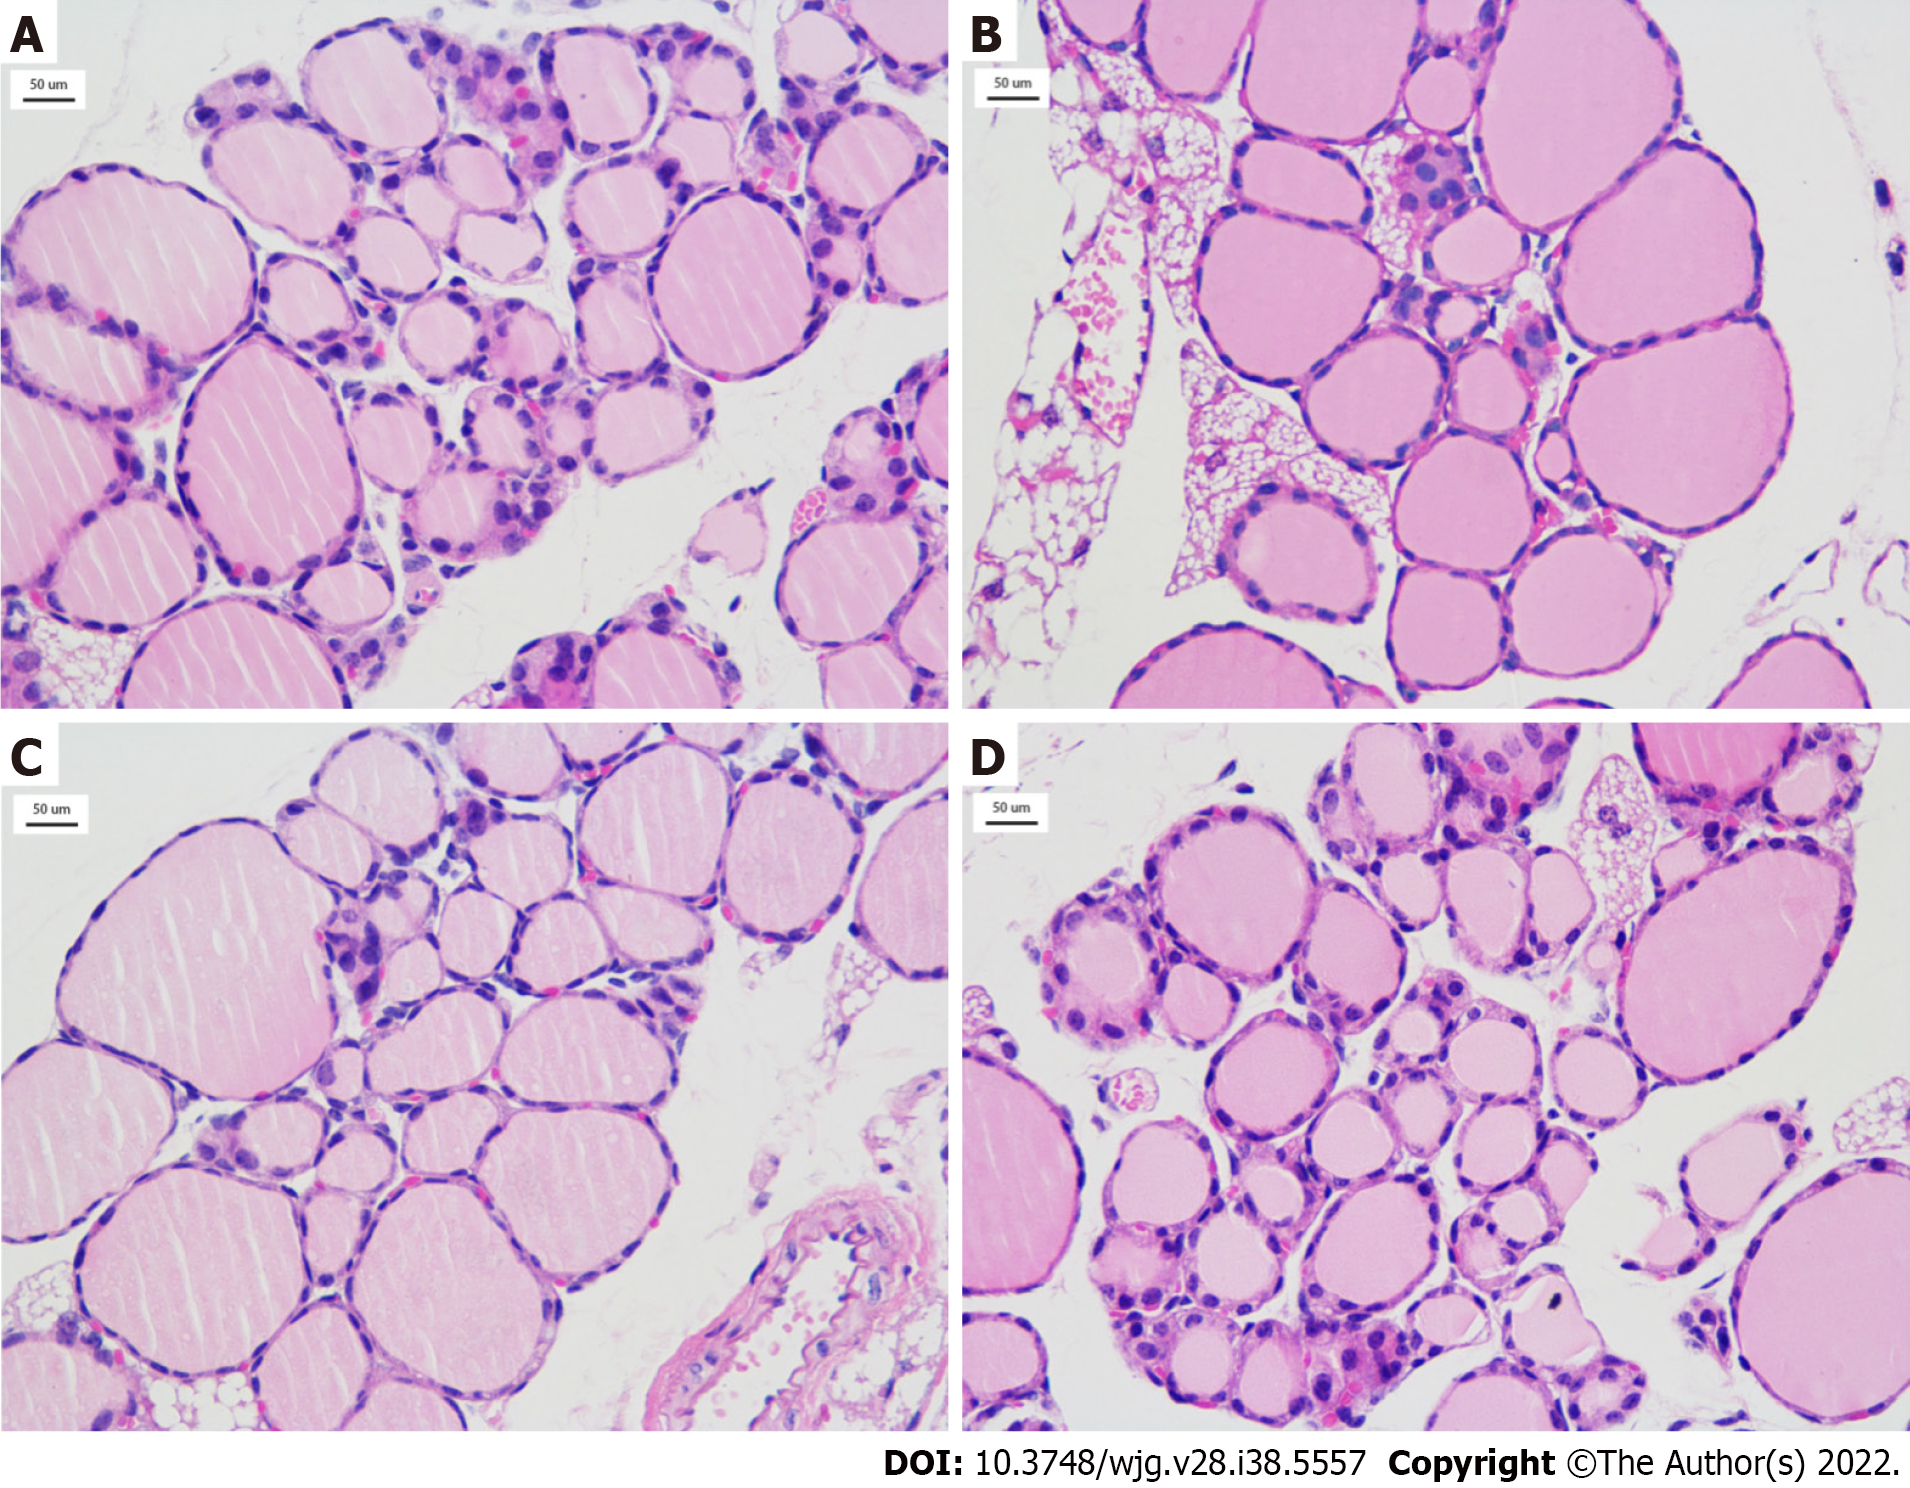
Figure 3 Thyroid tissue from the mice exposed to radiation (HE, × 400).
A-D: Thyroid tissue of radiation-exposed mice from the 0.05 Gy group, 0.10 Gy group, 0.15 Gy group, and 0.20 Gy group. TSH: Thyroid stimulating hormone.
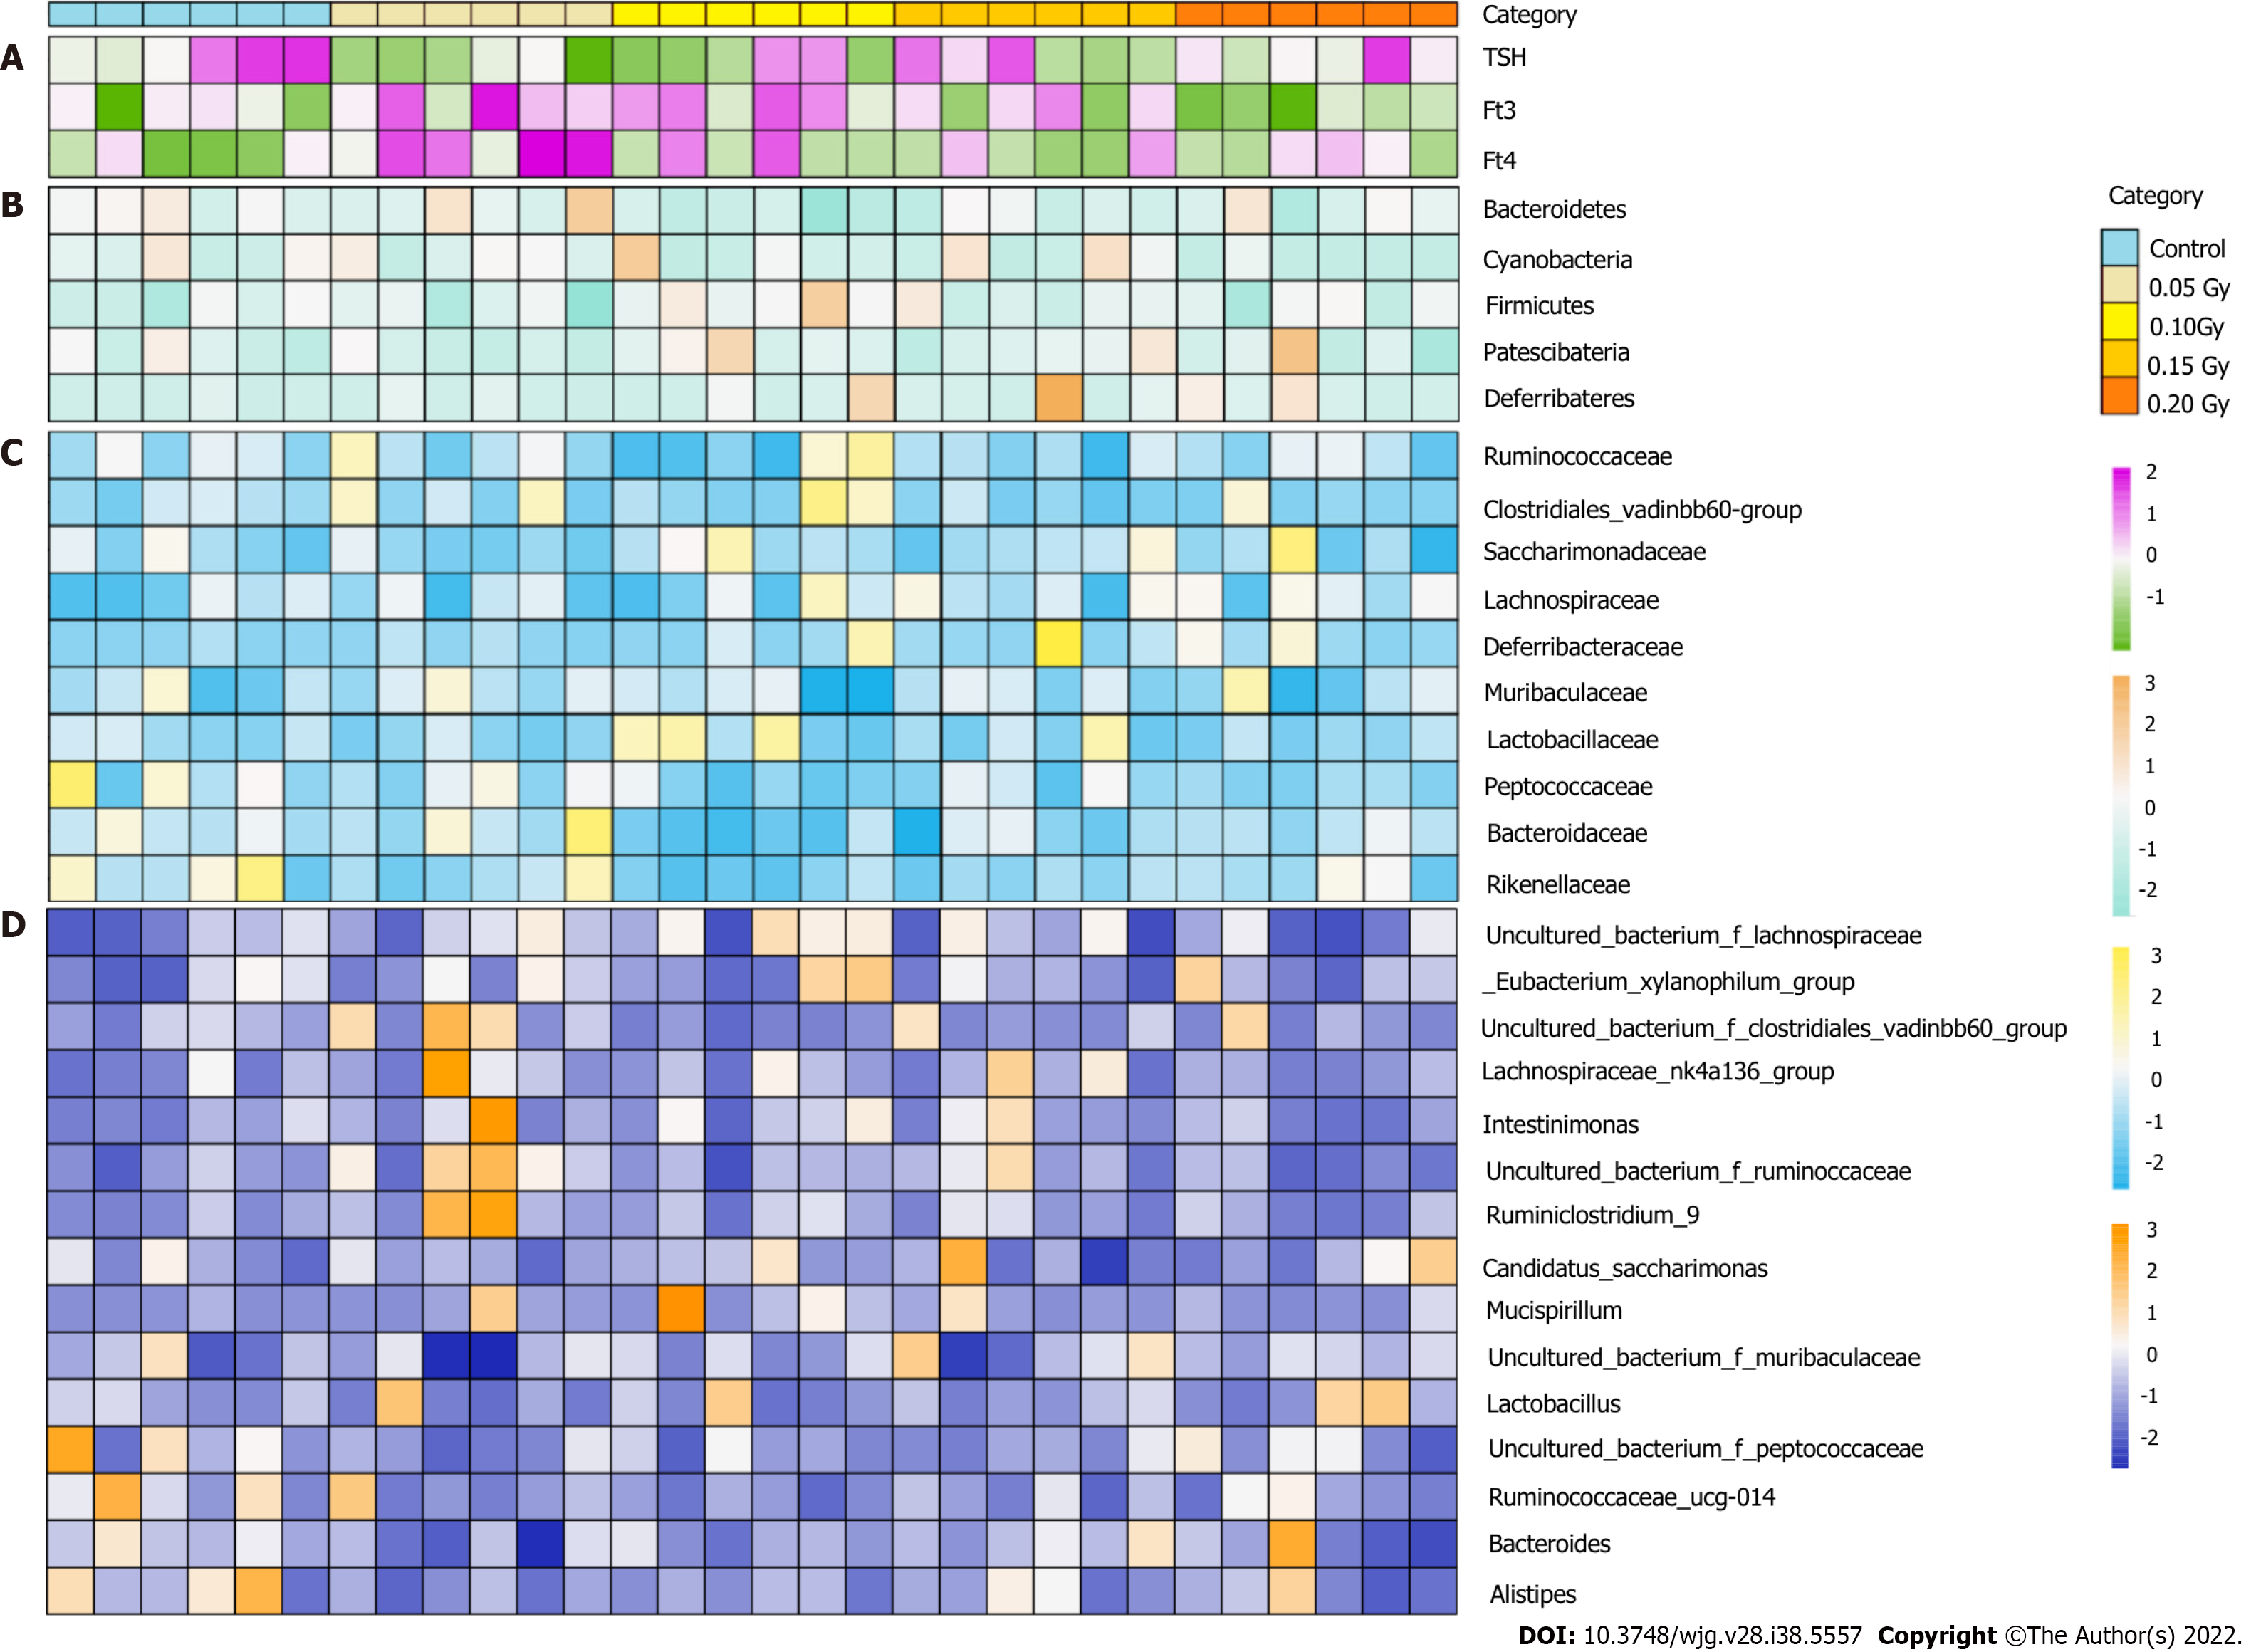
Figure 4 Taxonomic features of the thyroid hormone level and gut microbiota in the control mice (n = 6) and radiation-exposed group (n = 24).
A-D: The thyroid hormone level for all subjects (A), with an overview of the 5 most abundant phyla (B), 10 most abundant families (C) and 15 most abundant genera (D) in fecal samples identified by 16S rRNA gene sequencing. The taxa levels were determined by summing the operational taxonomic units and are presented by relative abundance.
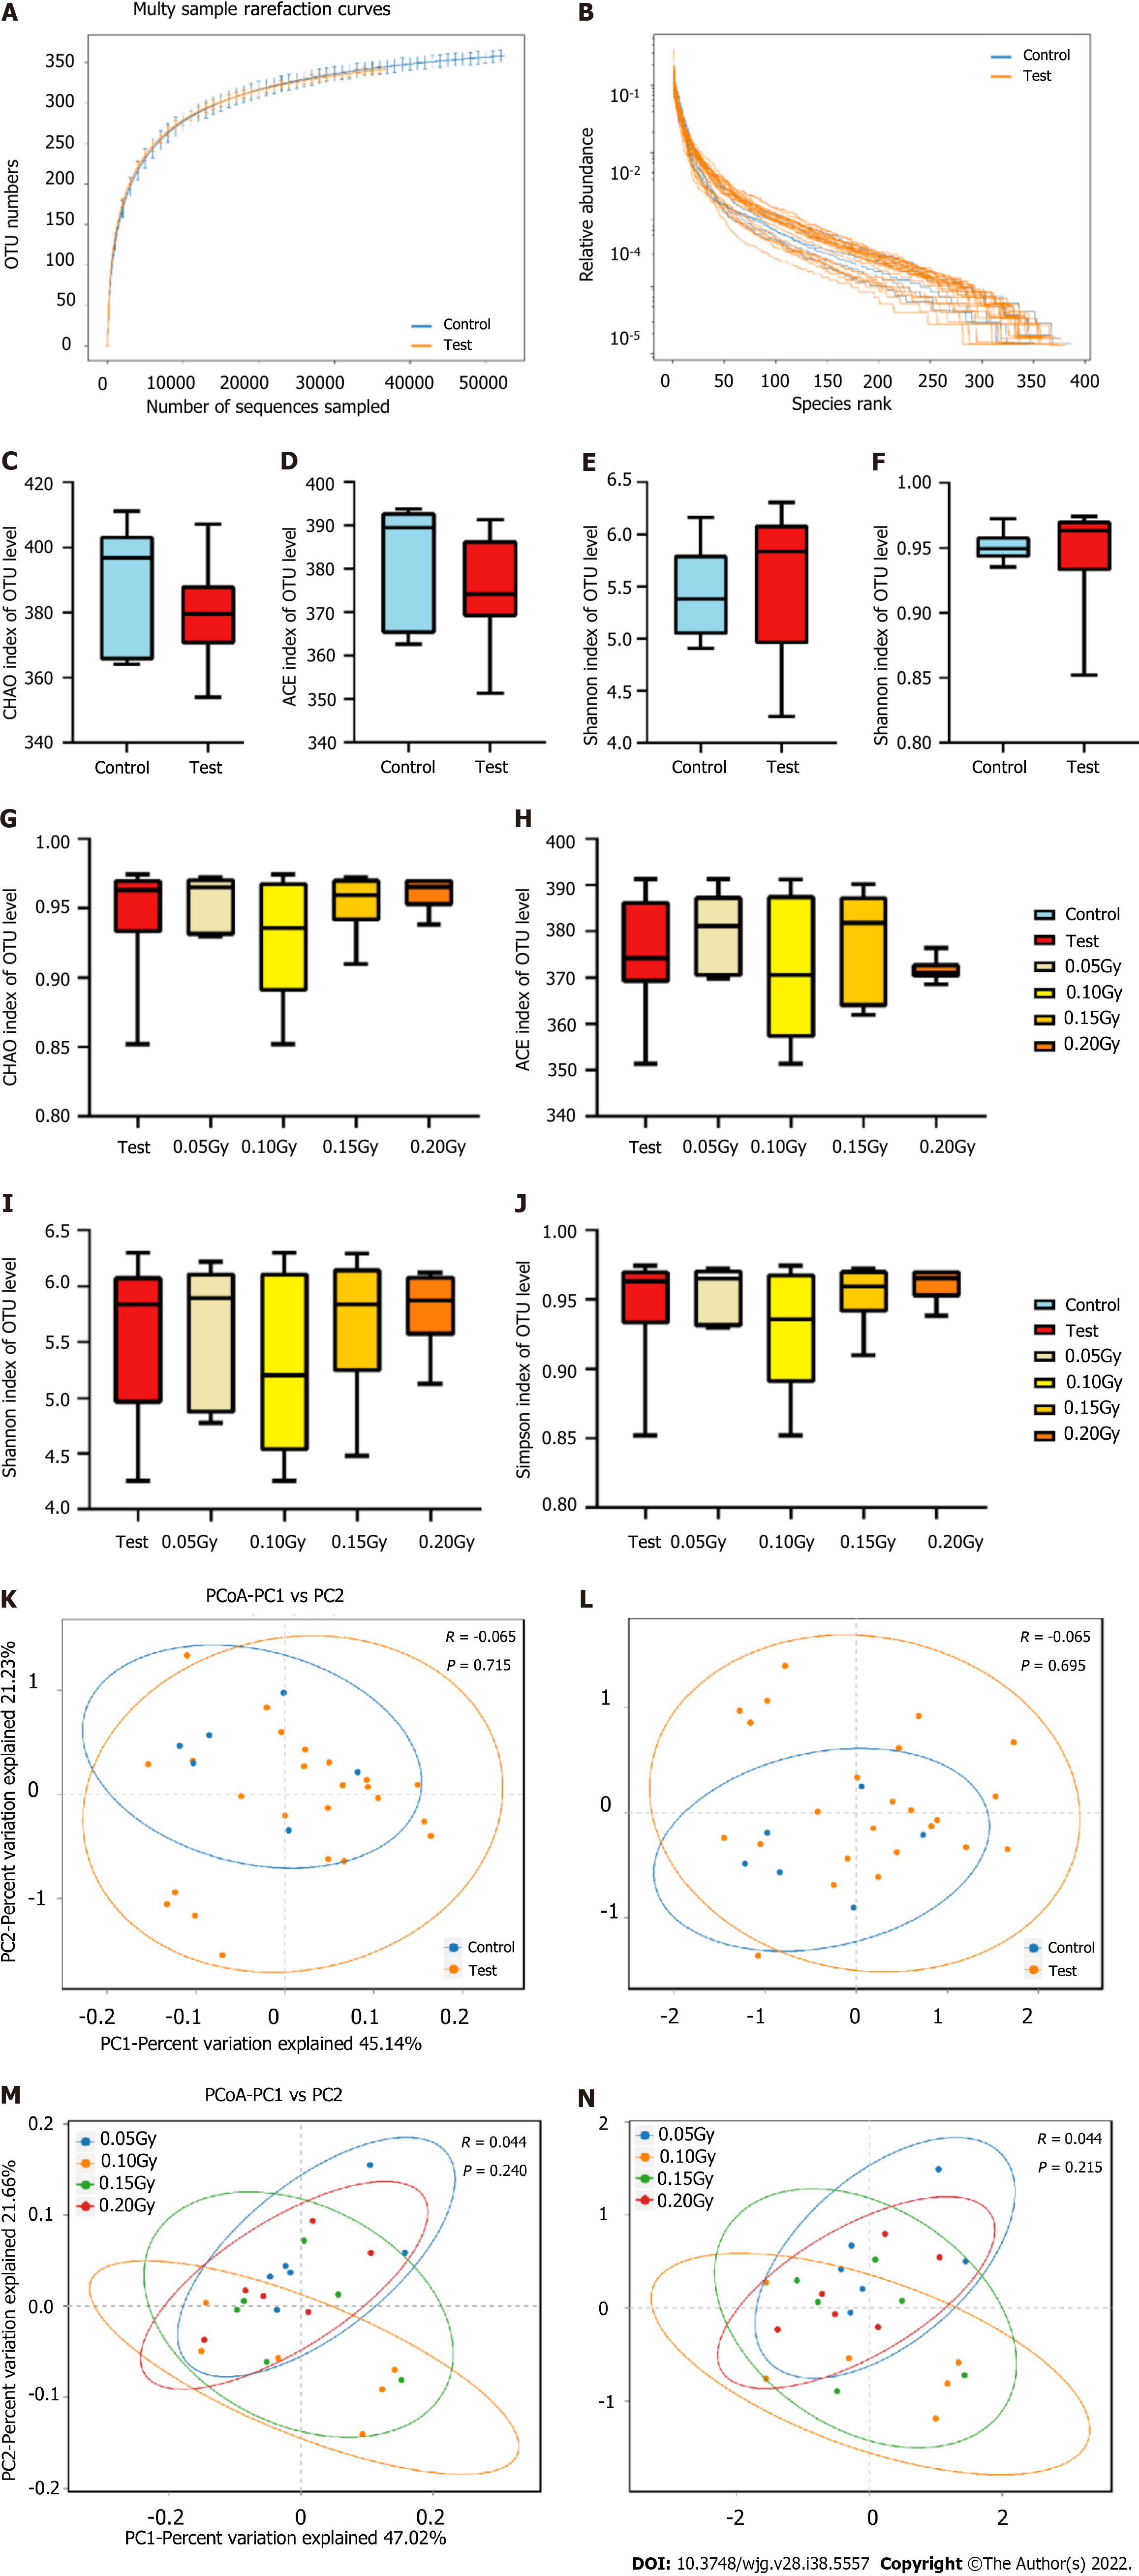
Figure 5 Bioinformatic analysis of 16S rRNA gene sequencing data in the exploratory cohort at the operational taxonomic units level.
A and B: Rank-abundance curves and rarefaction curves (SOB index) of the gut microbiota; C-F: Box and whisker plots of the alpha diversity indices for richness (Chao index and Ace index) and diversity (Shannon index and Simpson index) of the bacterial communities in control mice (n = 6) and the test mice (n = 24); G-J: Box and whisker plots of the alpha diversity indices for richness (Chao index and Ace index) and diversity (Shannon index and Simpson index) of the bacterial communities among the test subgroups (0.05 Gy, 0.10 Gy, 0.15 Gy, and 0.20 Gy; n = 6 in each group); K and L: Principal coordinates analysis (PCoA) and nonmetric multidimensional scaling (NMDS) analyses indicated that the microbial diversity differed nonsignificantly between the control and test groups based on the unweighted UniFrac distance (PCoA, R = -0.065, P = -0.715; NMDS, R = -0.065, P = 0.695); M and N: PCoA and NMDS analyses indicated that the microbial diversity differed nonsignificantly among the test subgroups based on the unweighted UniFrac distance (PCoA, R = 0.004, P = 0.24; NMDS, R = 0.215, P = 0.695).
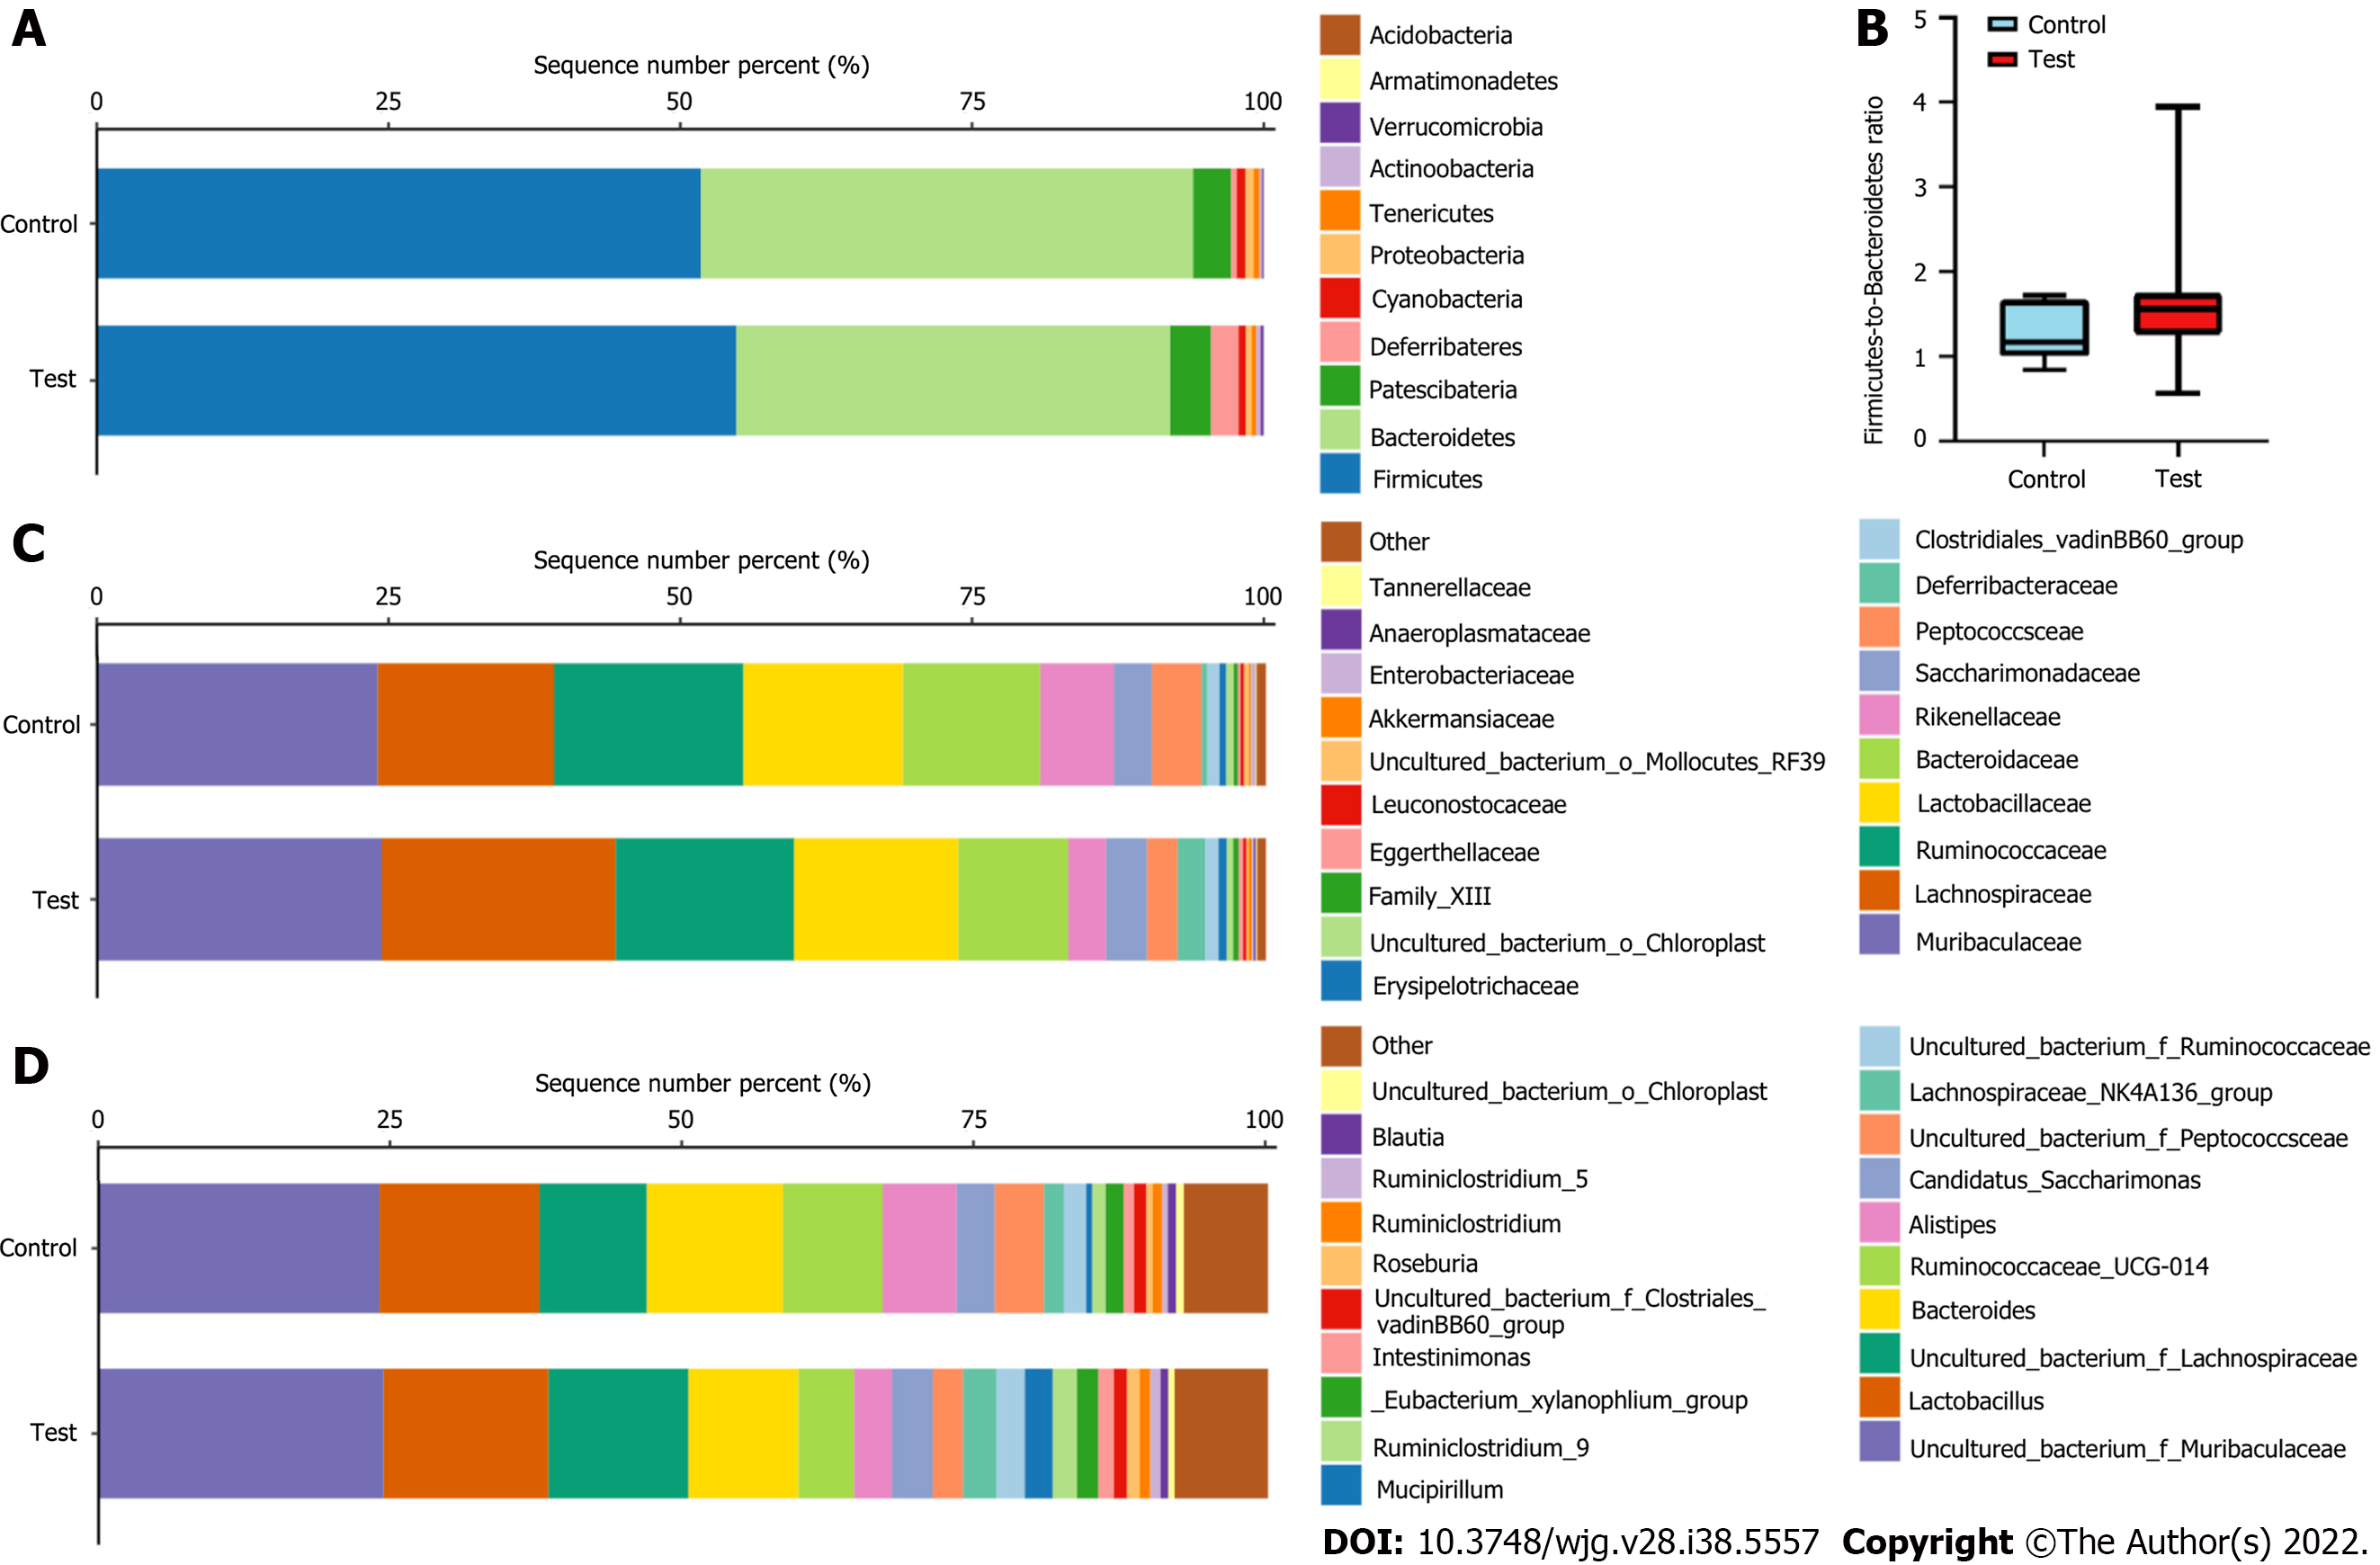
Figure 6 The gut microbiota composition in the control and test groups.
A: Bar plots show the gut microbiota composition at the phylum level; B: Box and whisker plots of the Firmicutes/Bacteroidetes ratio in the control (n = 6) and test groups (n = 24), and there was no difference between the groups; C: Bar plots show the gut microbiota composition at the family level; D: Bar plots show the gut microbiota composition at the genus level.
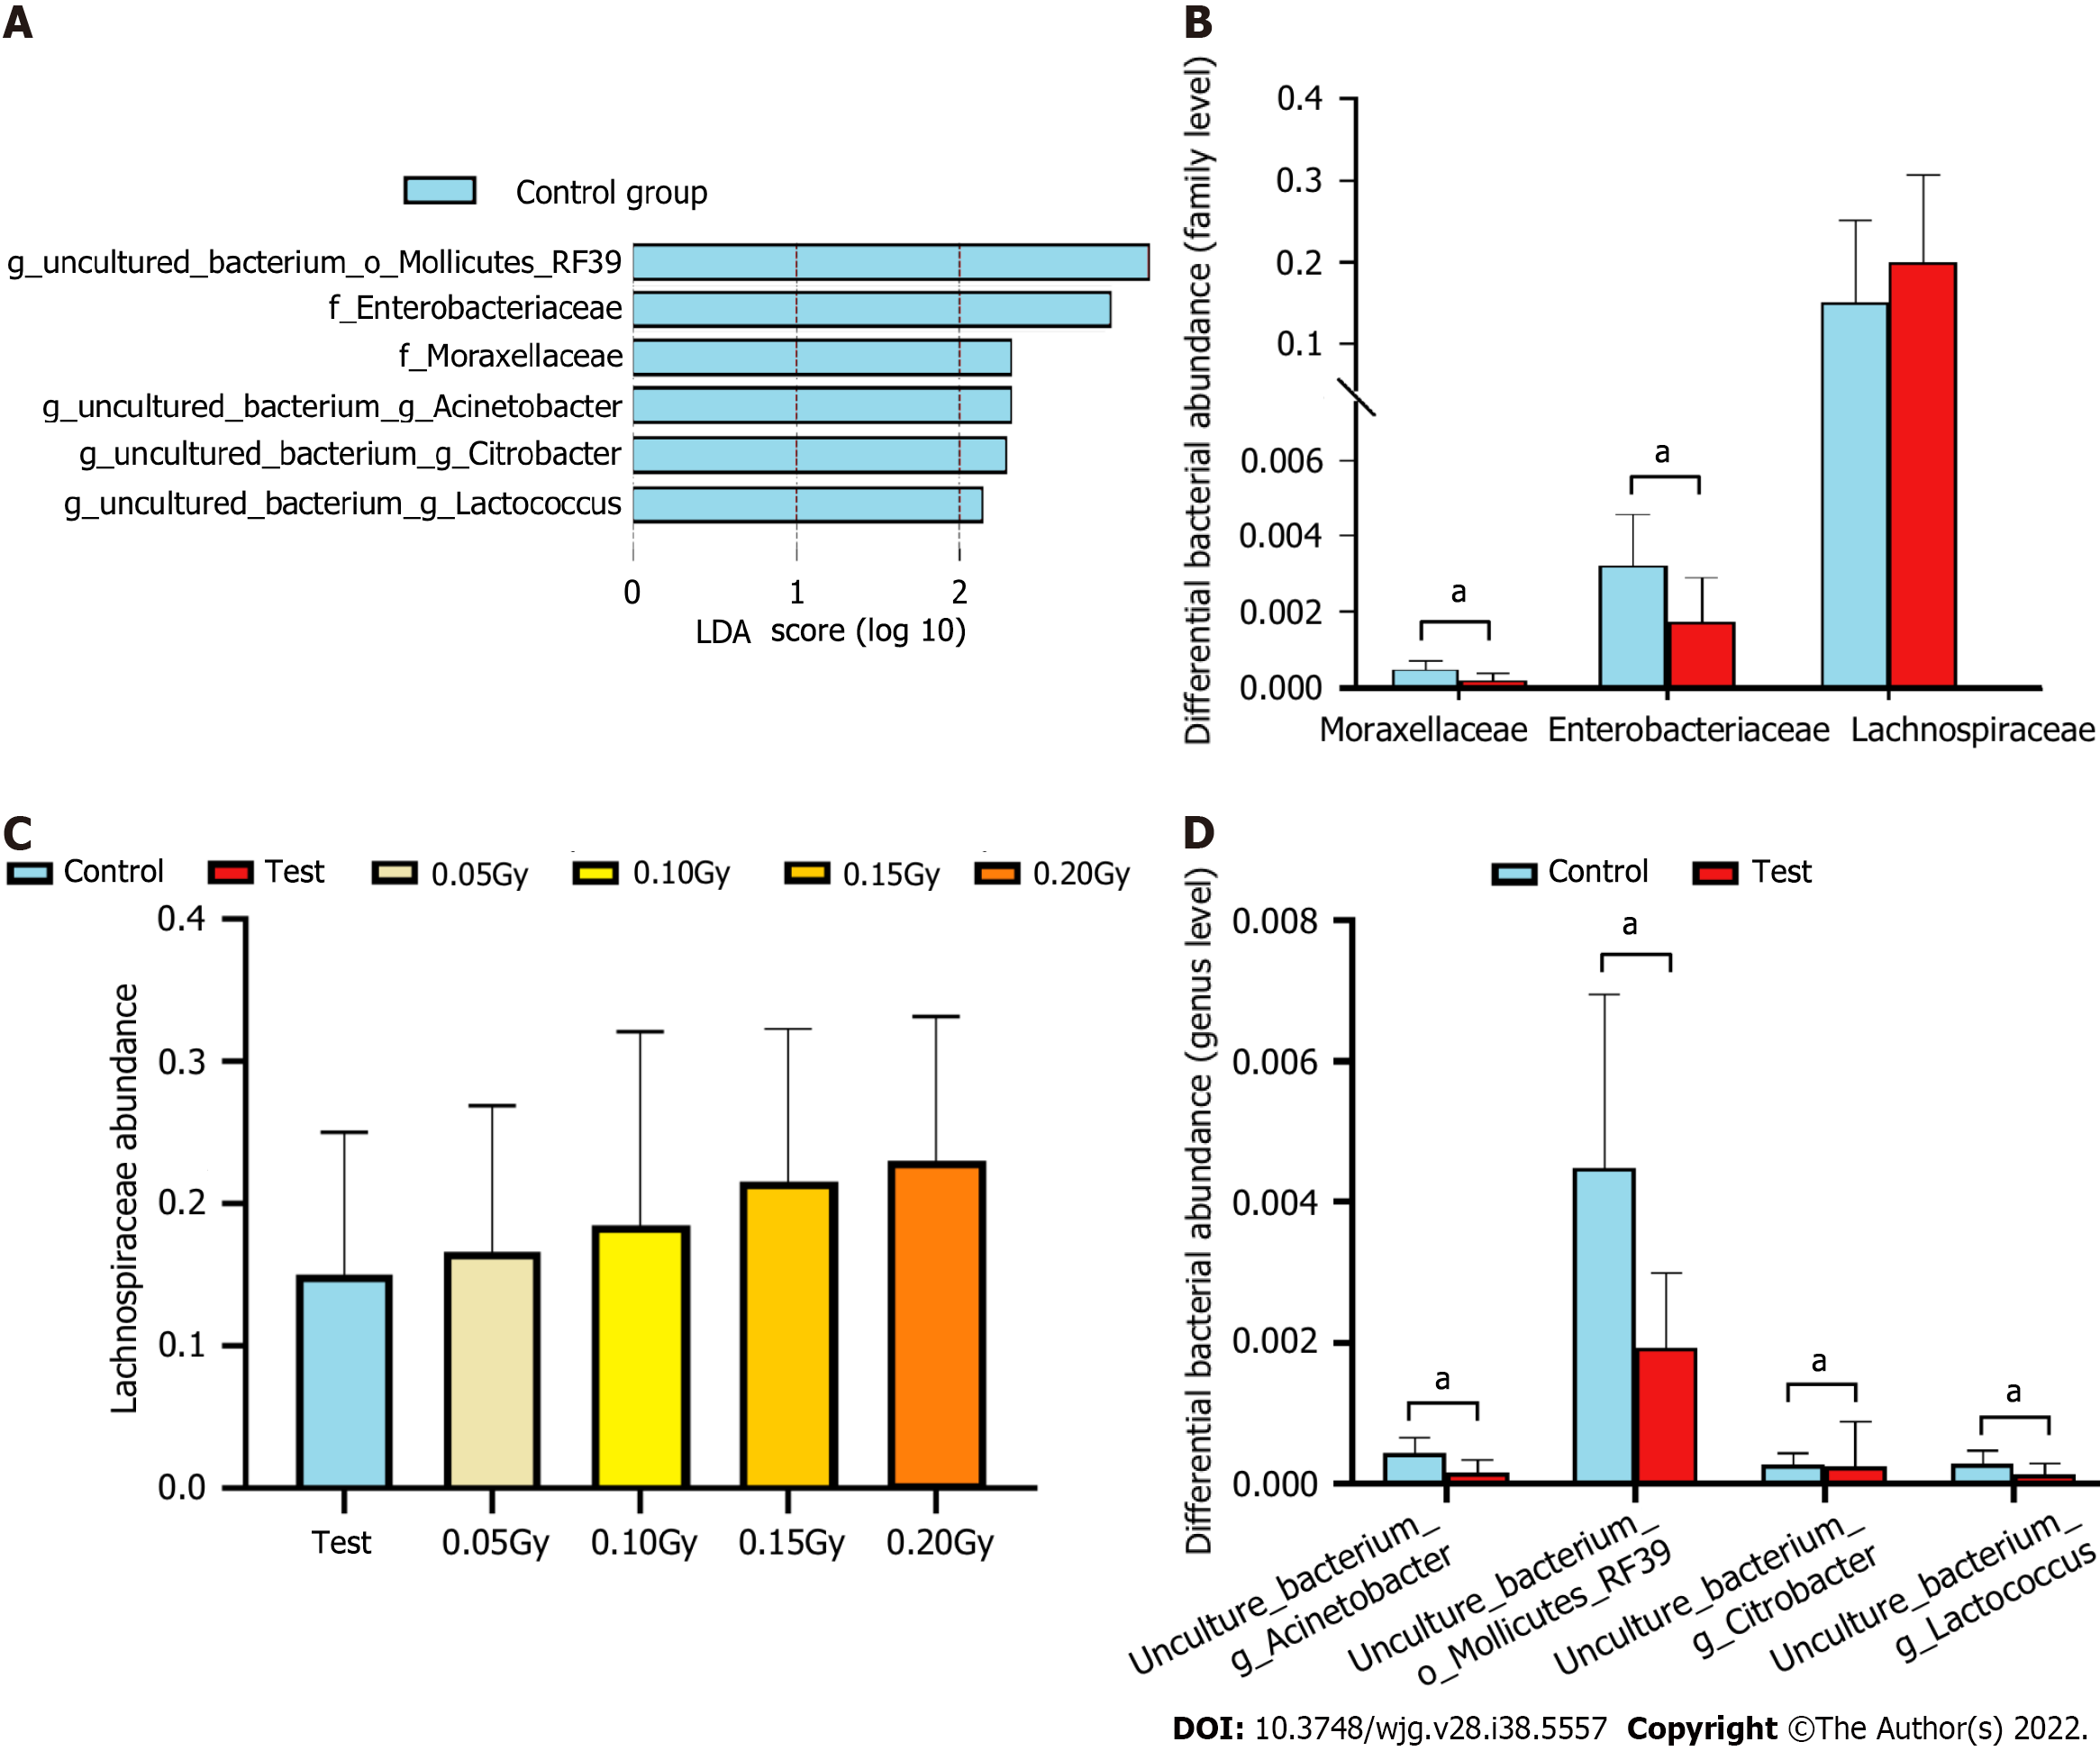
Figure 7 Altered gut microbiota composition in the radiation-exposed group compared with the control group.
A: Identification of the significantly different species in the radiation-exposed group and controls at the family and genus levels as determined by linear discriminant analysis (LDA) effect size (LEfSe). Only taxa meeting a significant linear discriminant analysis threshold value of > 2.0 and P < 0.05 are shown; B: Comparison of Moraxellaceae, Enterobacteriaceae, and Lachnospiraceae abundances between the test group and control group at the family level; C: Histogram of the abundance of Lachnospiraceae in the control and test subgroups; D: Comparison of the differential bacterial abundances between the test group and controls at the genus level, including uncultured_bacterium_g_Acinetobacter, uncultured_bacterium_o_Mollicutes_RF39, uncultured_bacterium_g_Citrobacter, and uncultured_bacterium_g_Lactococcus. aP < 0.05.
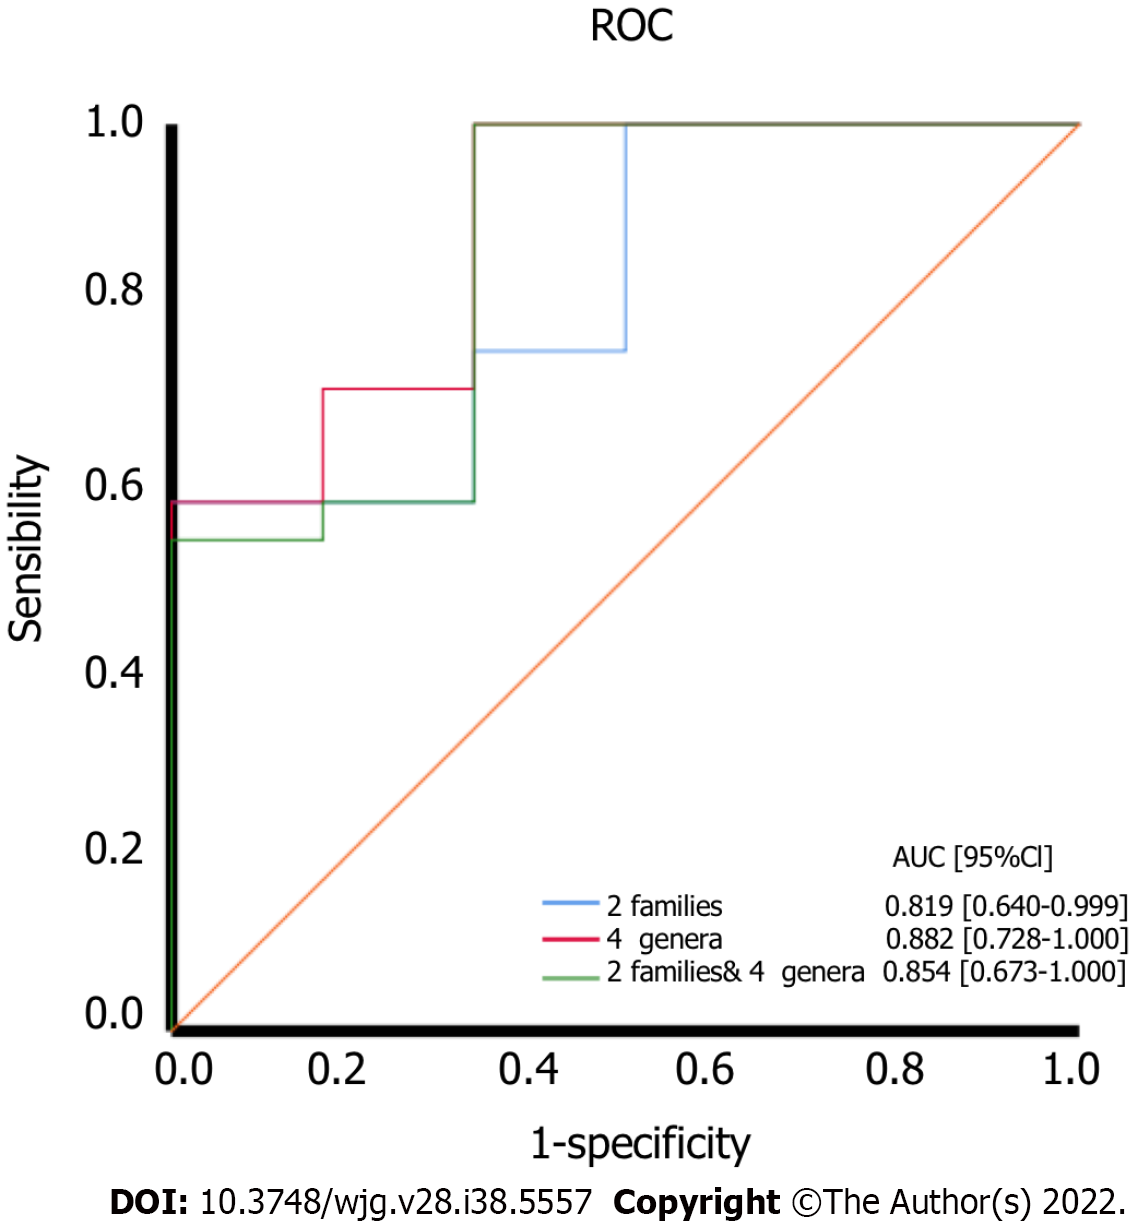
Figure 8 The diagnostic accuracy of the bacteria based on the linear discriminant analysis effect size results.
ROC: Receiver operating characteristic.
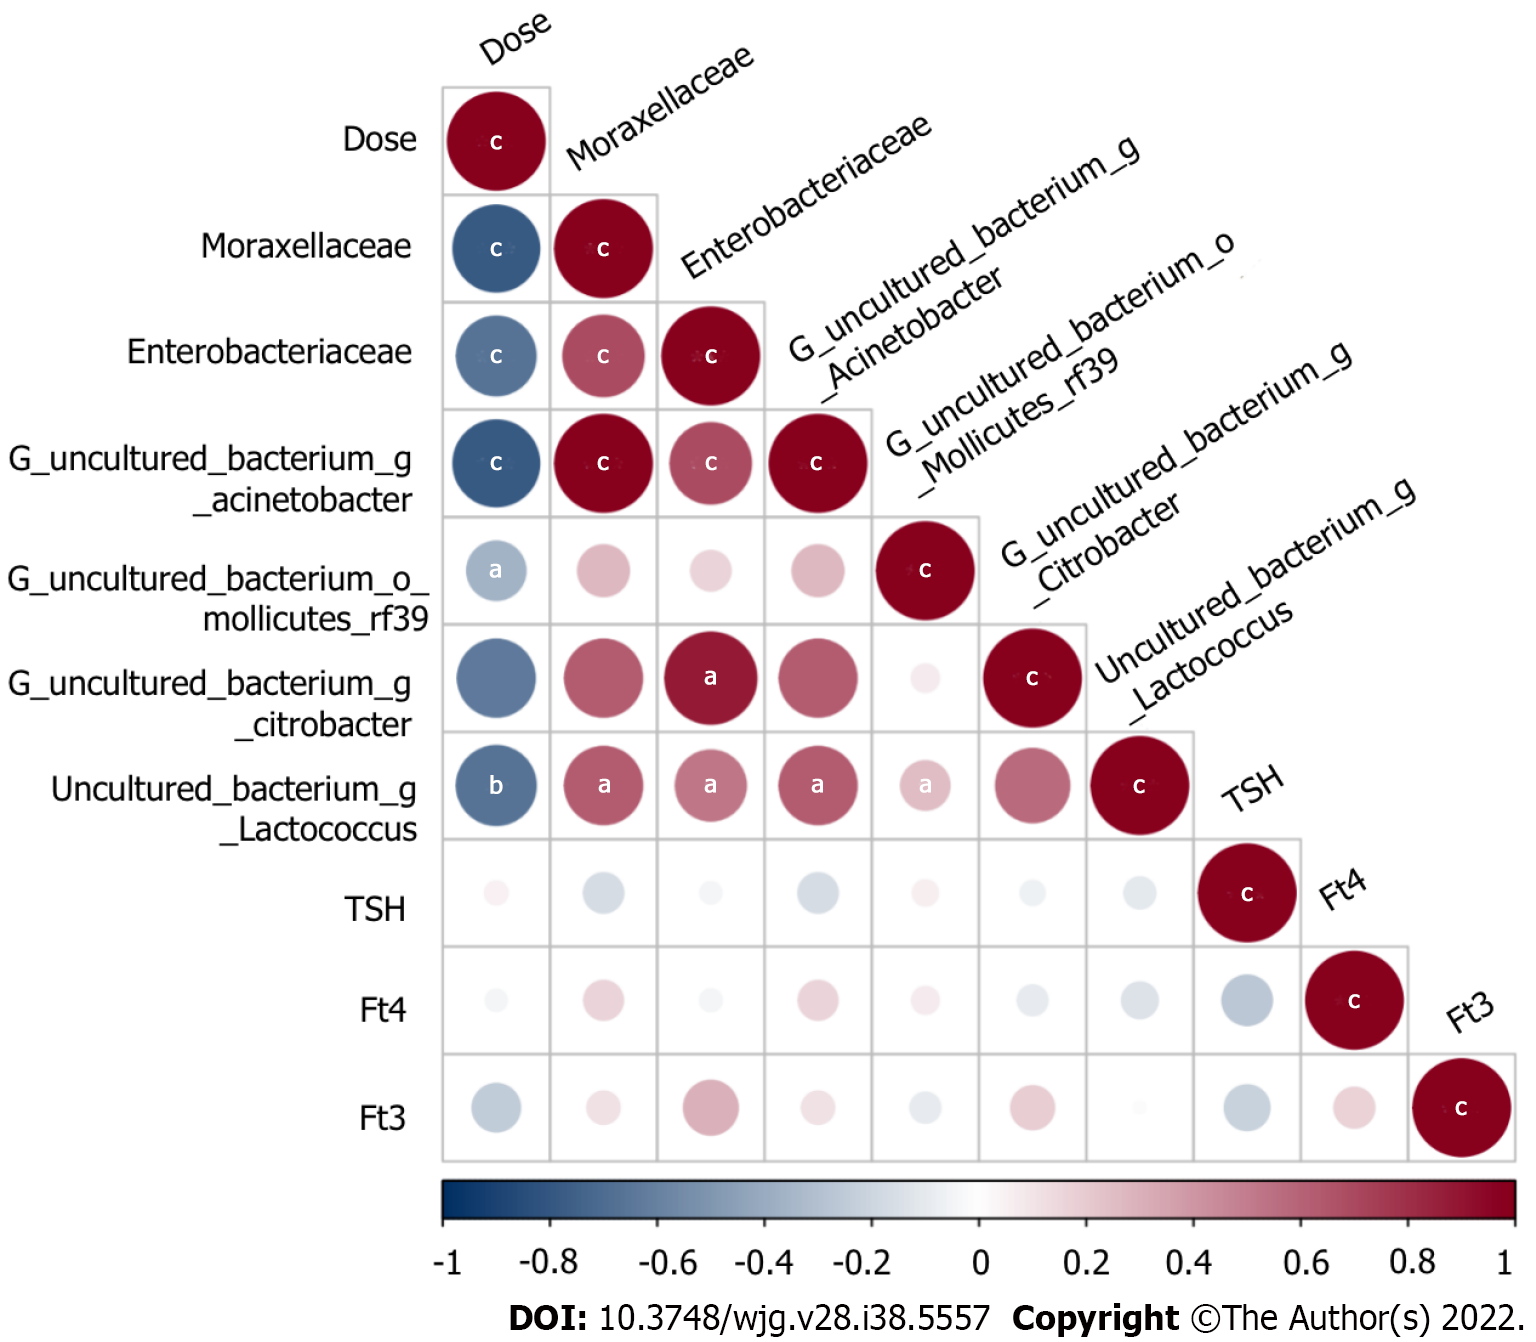
Figure 9 The relationship between the dose and predictive bacteria as well as thyroid function tests.
Positive correlations are represented in red, negative correlations are colored in blue. aP < 0.05; bP < 0.01; cP < 0.001.
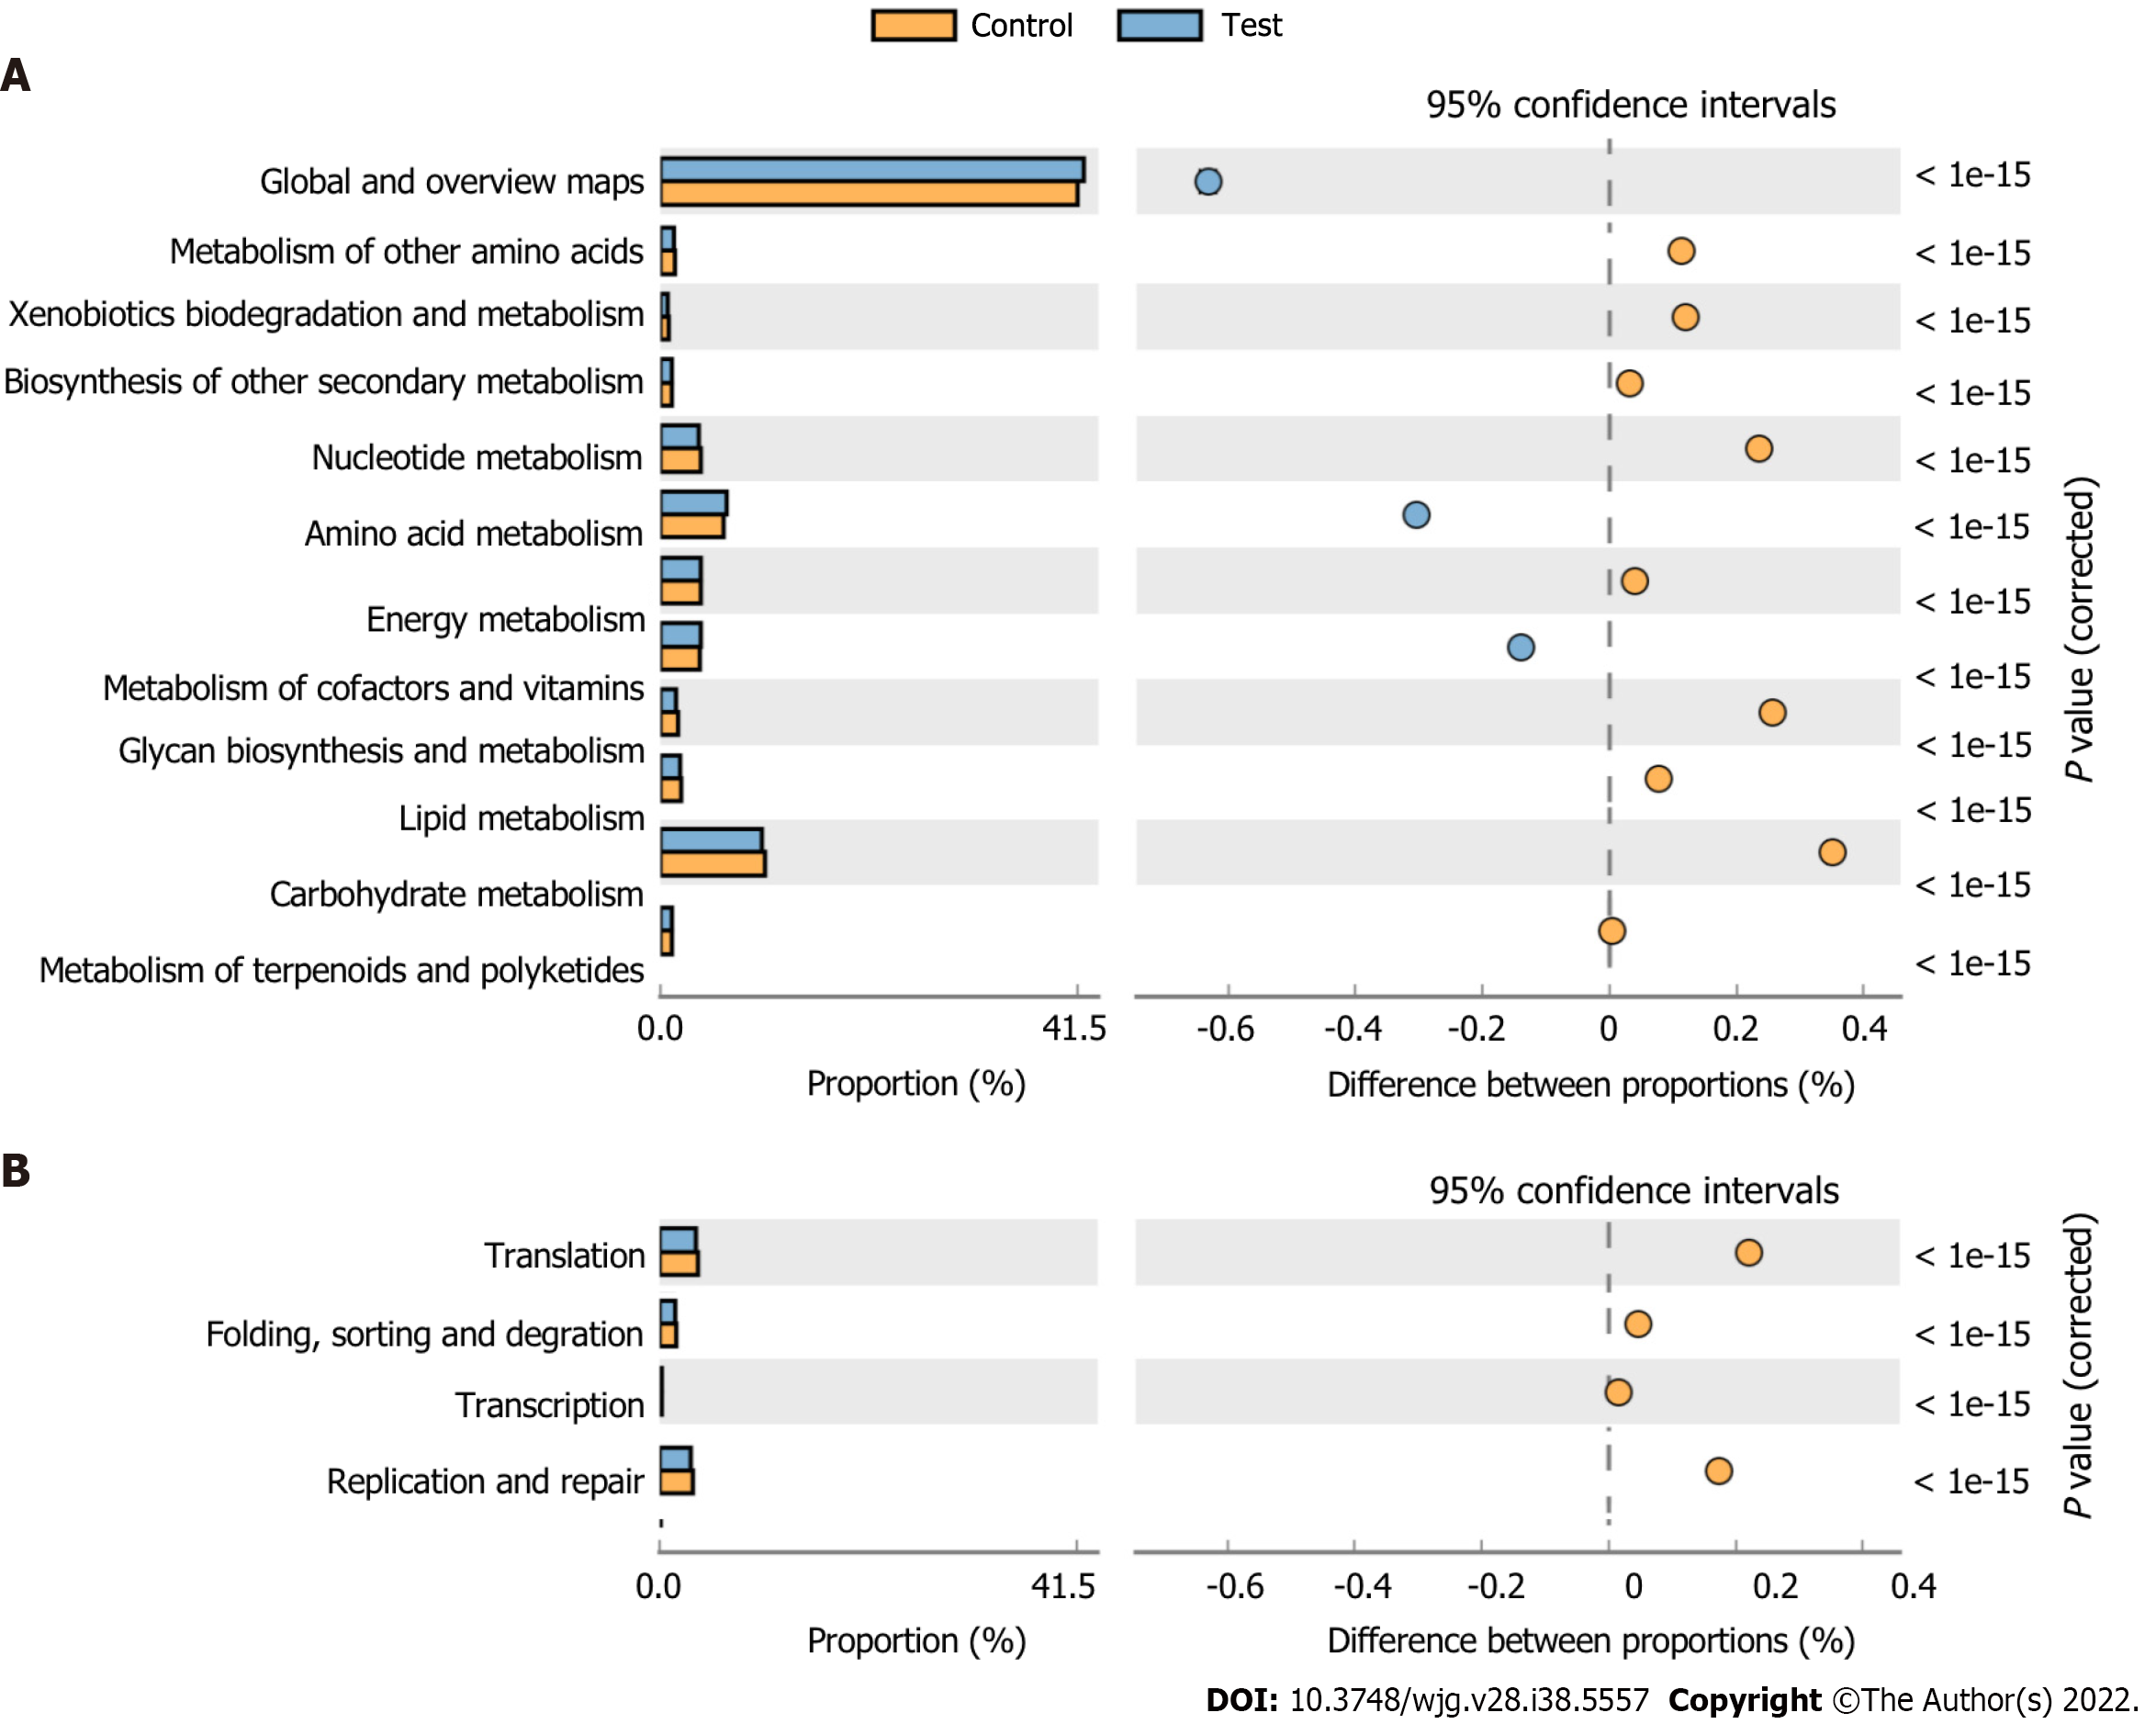
Figure 10 The histogram shows the Kyoto Encyclopedia of Genes and Genomes categories that differed significantly between the test group and controls.
A: Metabolic function; B: Processing function.
- Citation: Tong JY, Jiang W, Yu XQ, Wang R, Lu GH, Gao DW, Lv ZW, Li D. Effect of low-dose radiation on thyroid function and the gut microbiota. World J Gastroenterol 2022; 28(38): 5557-5572
- URL: https://www.wjgnet.com/1007-9327/full/v28/i38/5557.htm
- DOI: https://dx.doi.org/10.3748/wjg.v28.i38.5557


