Copyright
©The Author(s) 2022.
World J Gastroenterol. Sep 14, 2022; 28(34): 4973-4992
Published online Sep 14, 2022. doi: 10.3748/wjg.v28.i34.4973
Published online Sep 14, 2022. doi: 10.3748/wjg.v28.i34.4973
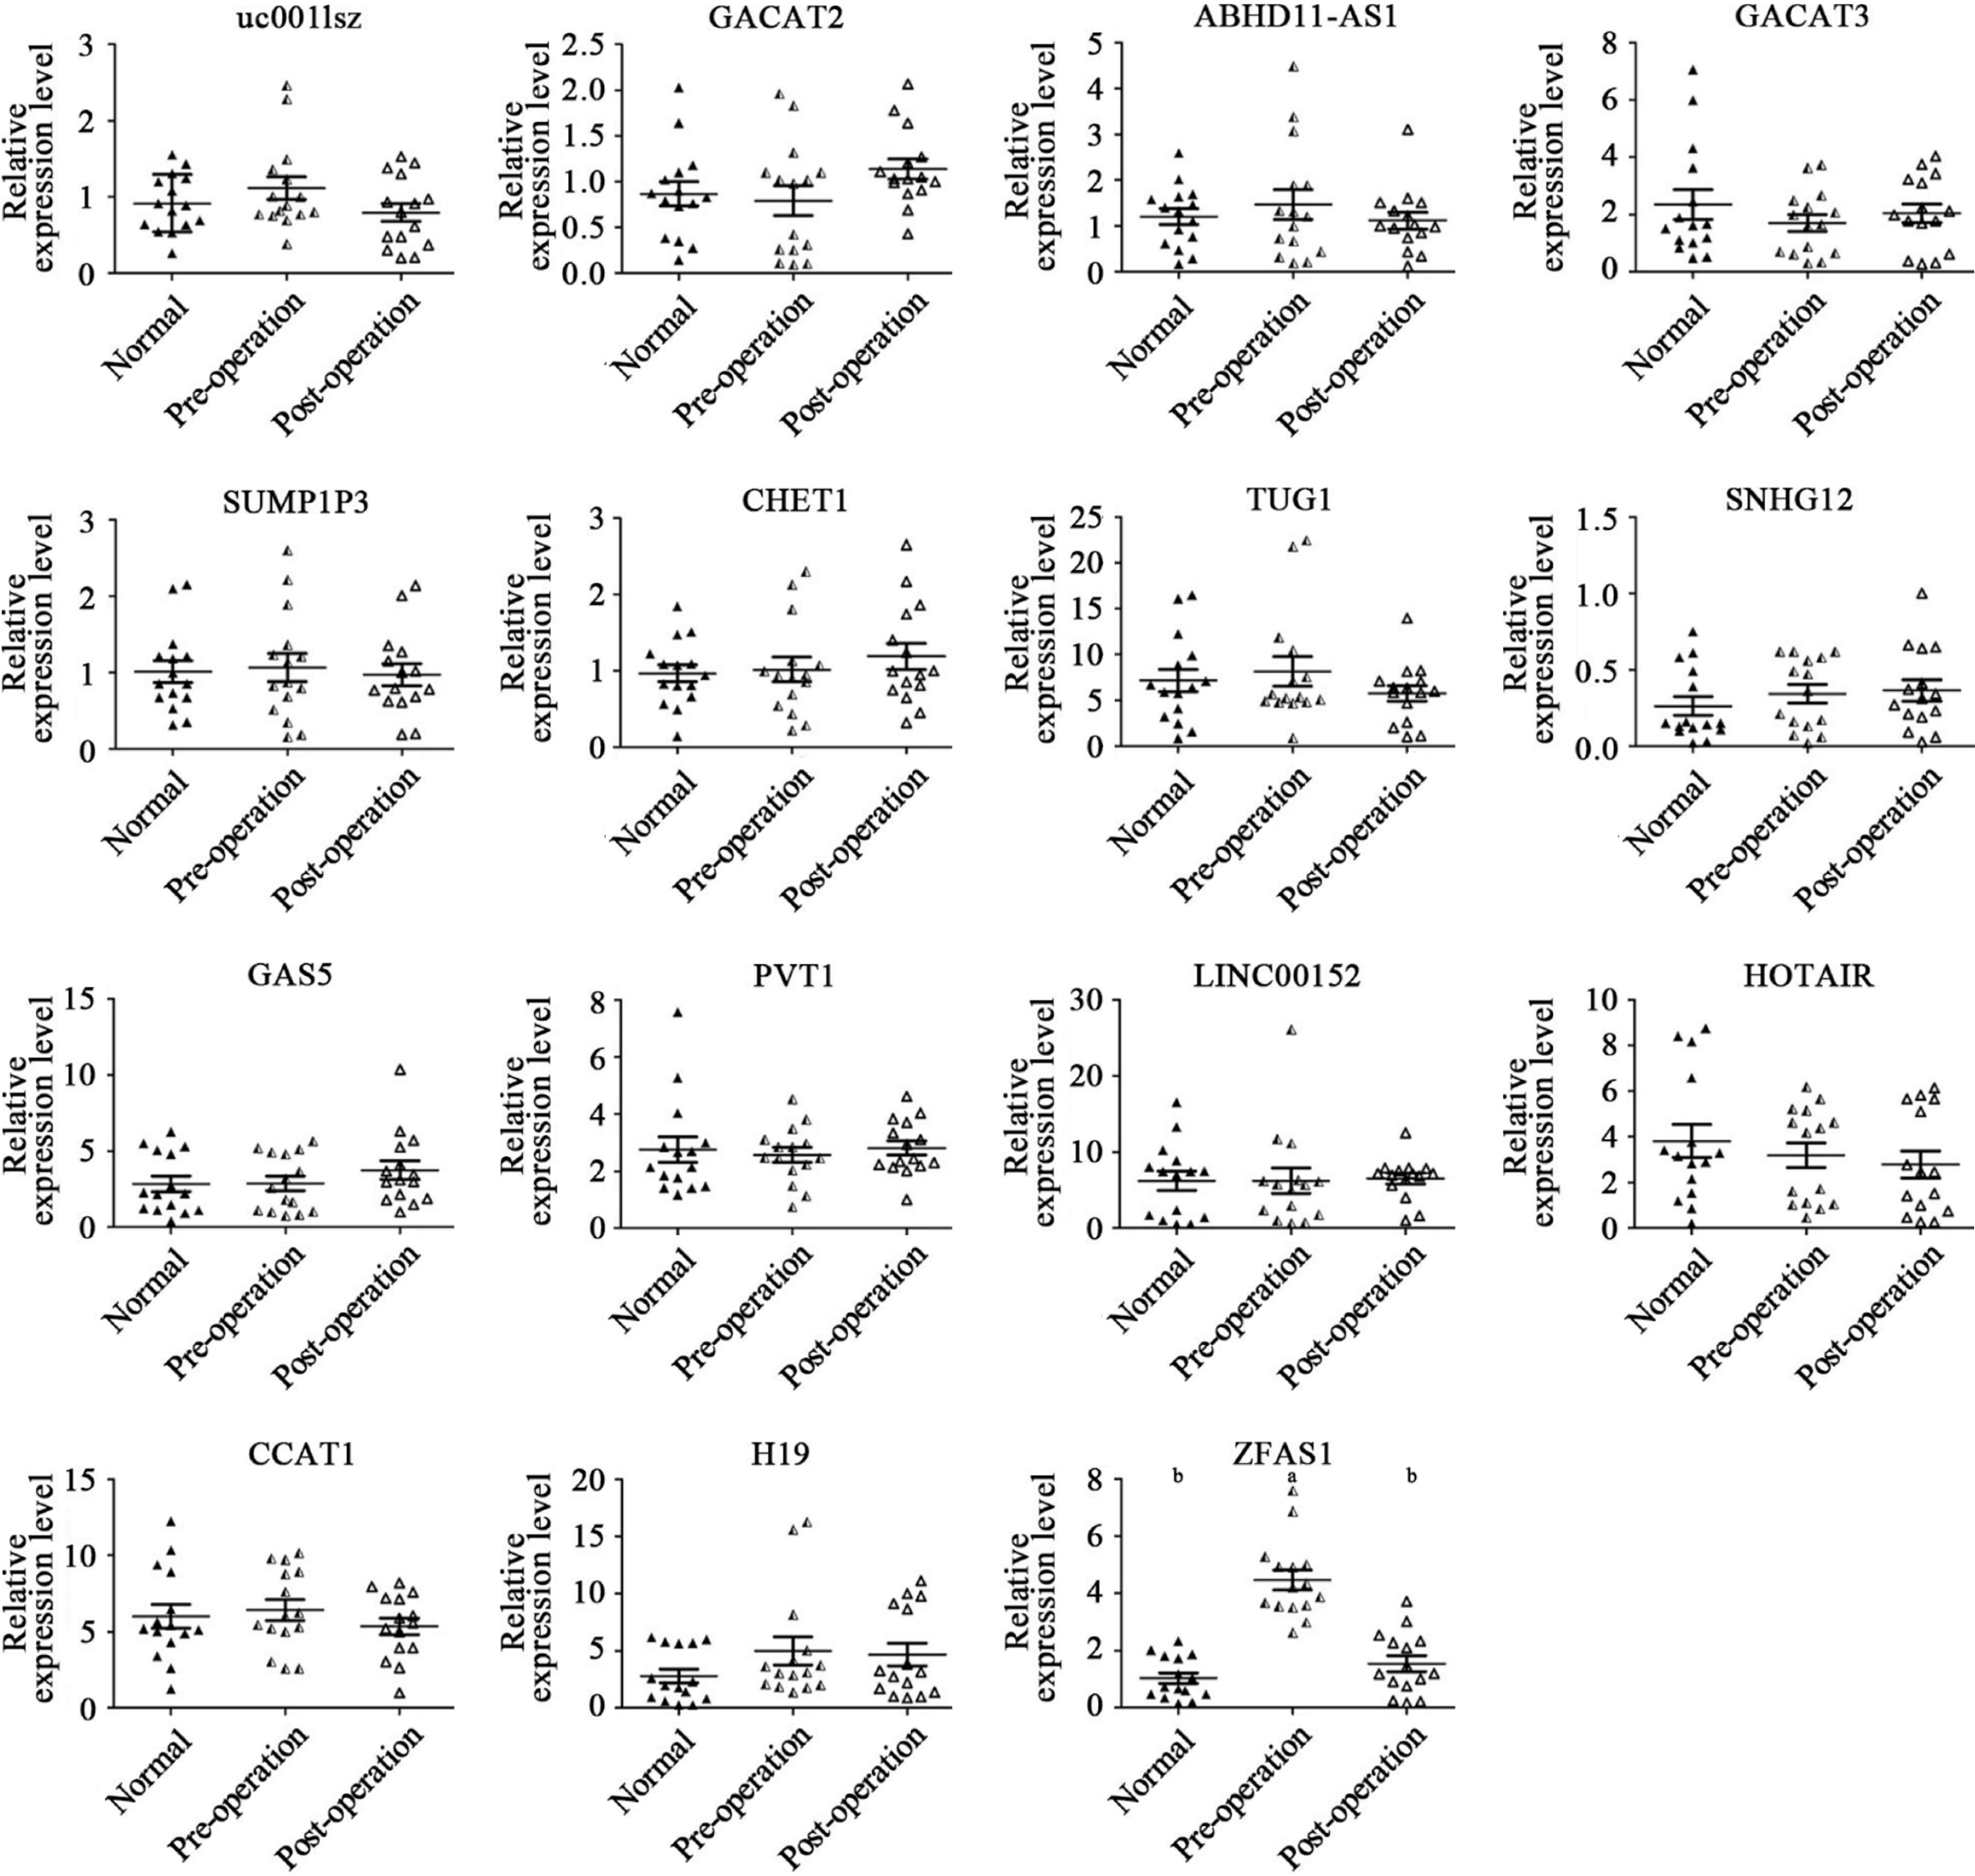
Figure 1 Relative expression levels of a selected subset of plasma long noncoding RNAs in 15 matched preoperative and postoperative gastric cancer patients and 15 healthy control subjects.
Scatter plot of long noncoding RNA relative expression levels in the plasma of preoperative patients (preoperative; n = 15), postoperative patients (postoperative; n = 15), and healthy control subjects (normal; n = 15), as assessed by quantitative polymerase chain reaction. The upper and lower bars indicate the ± SD values, and the middle bar indicates the median value. P values (aP < 0.05; bP < 0.01) were determined using the t-test.
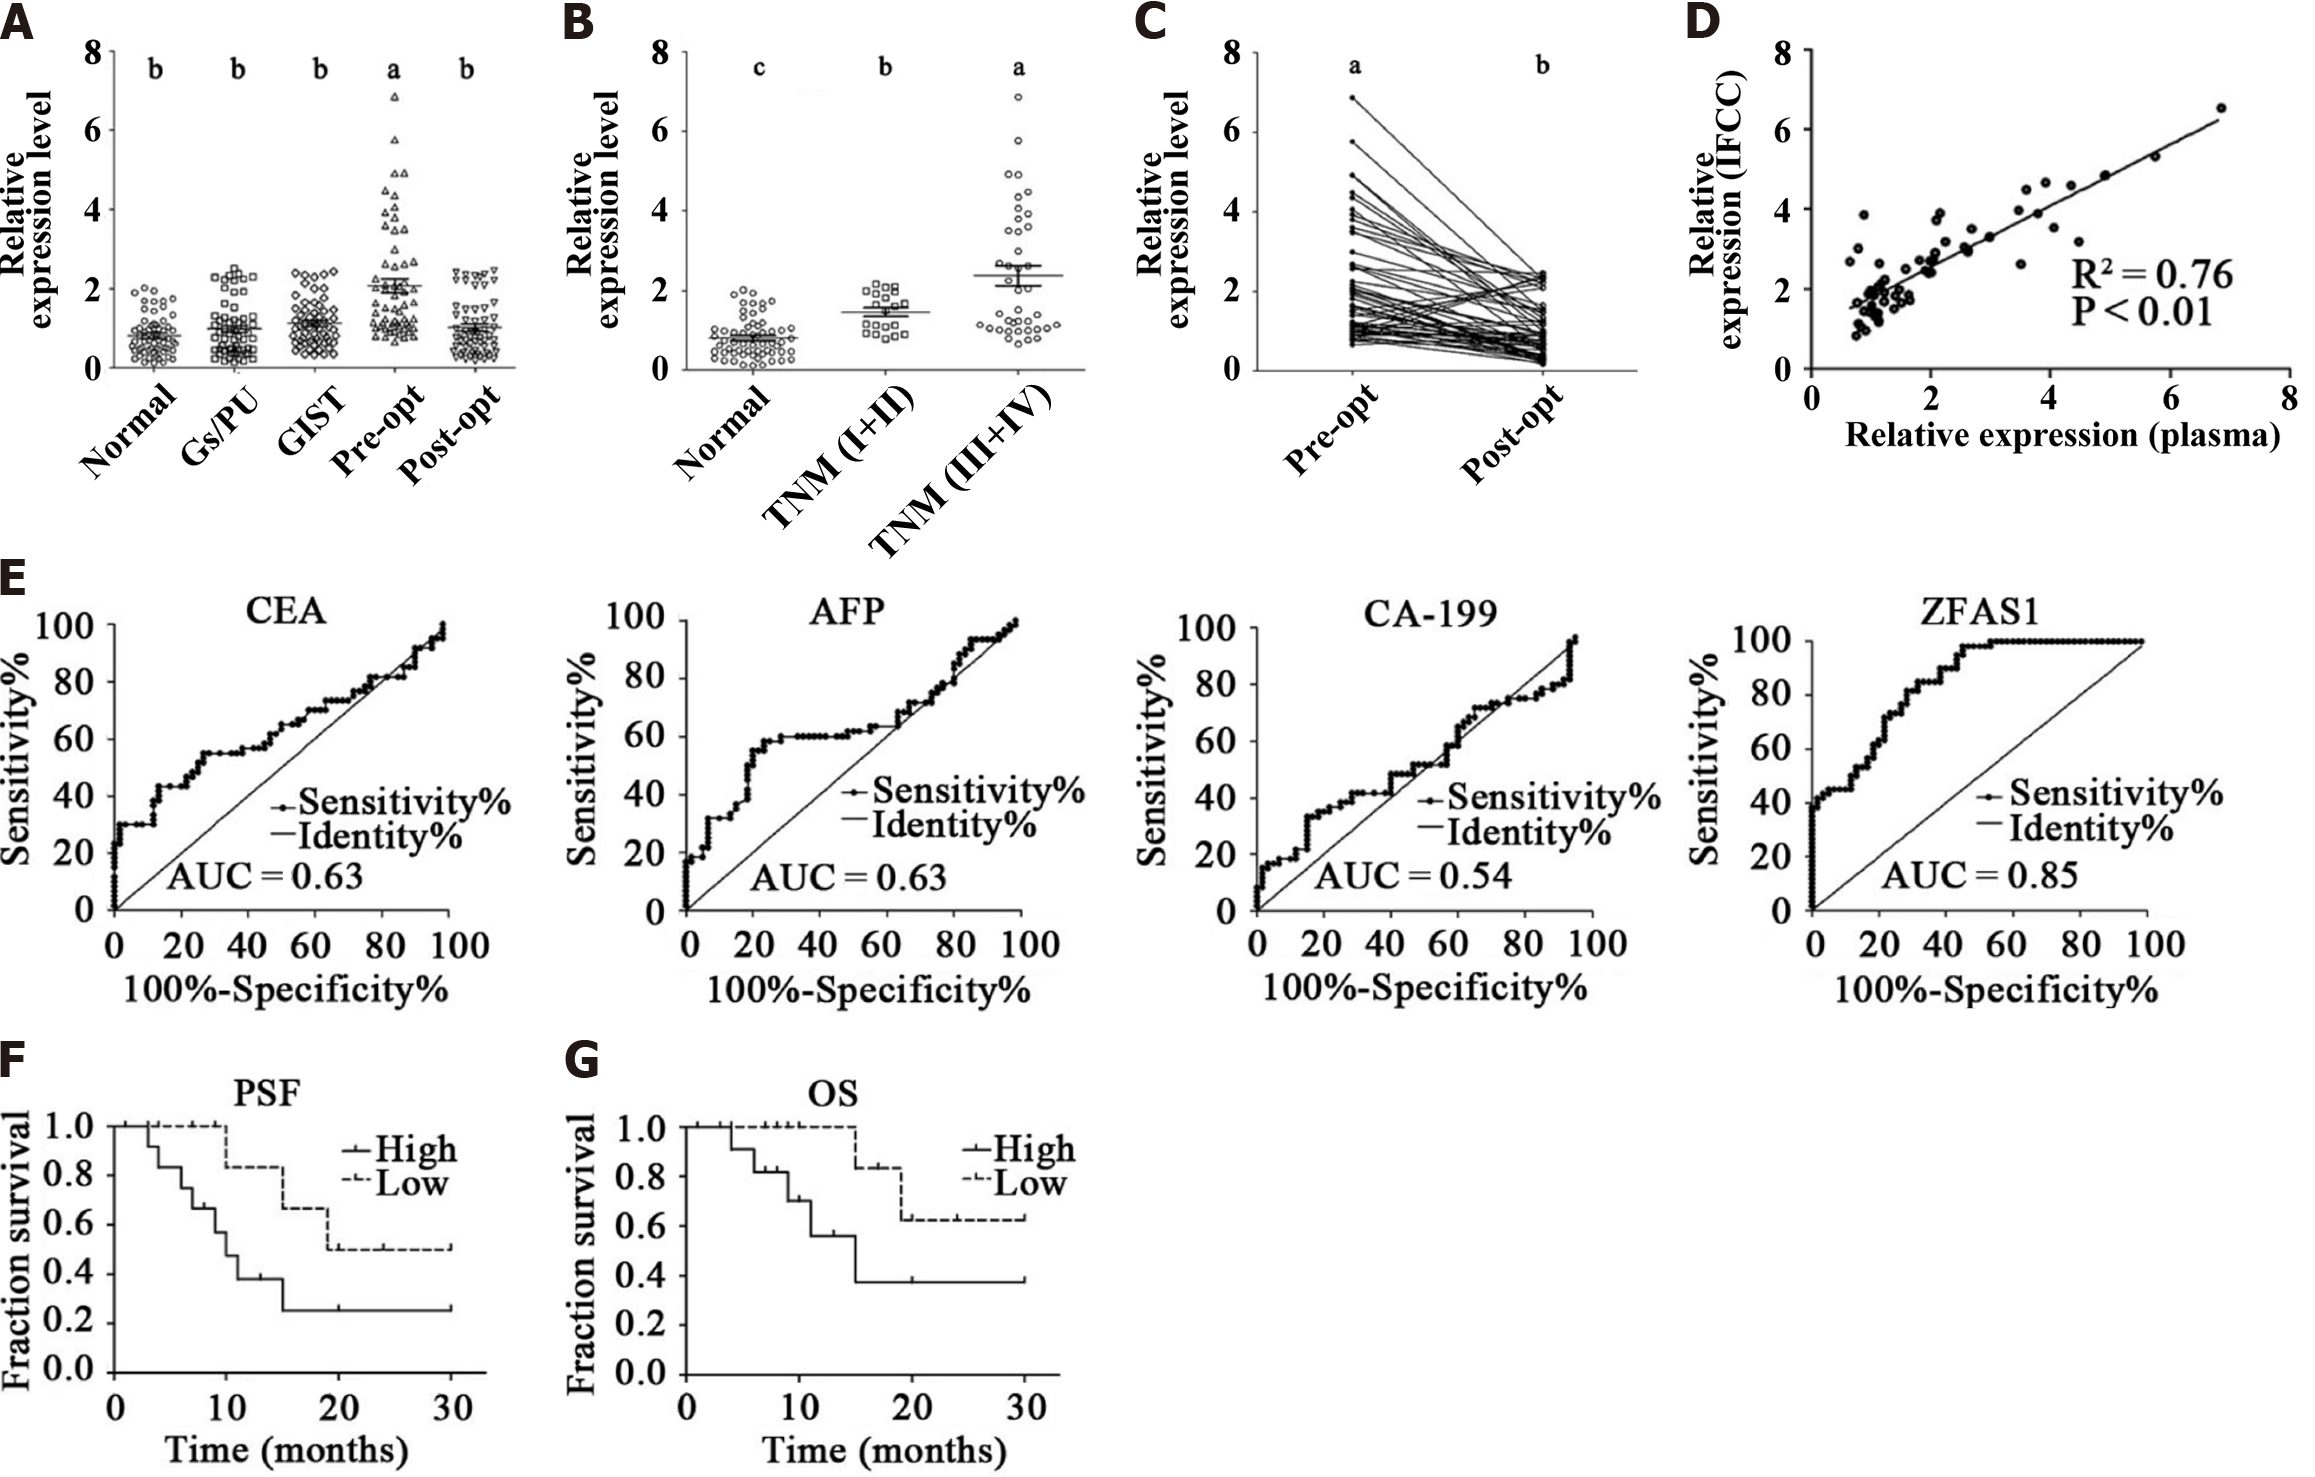
Figure 2 ZNFX1-AS1 is a potential diagnostic and prognostic biomarker.
A: Scatter plot of long noncoding RNA (lncRNA) relative expression levels in the plasma of healthy control subjects (normal; n = 60), gastritis/peptic ulcer patients (Gs/PU patients; n = 60), gastric stromal tumor patients (GIST; n = 60), preoperative patients (pre-opt; n = 60), and postoperative patients (post-opt; n = 60), as assessed by real-time polymerase chain reaction (PCR); B: Scatter plot of lncRNA relative expression levels in the plasma of healthy control subjects (normal; n = 60), early-stage patients (TNM I + II; n = 20), and advanced-stage patients (TNM III + IV; n = 40), as assessed by real-time PCR; C: The endpoints indicate the relative expression levels of lncRNA ZNFX1-AS1 (ZFAS1) in preoperative (pre-opt) and postoperative (post-opt) patient plasma, while the lines connecting the pairs of endpoints indicate the trends in the relative expression levels in the matched preoperative and postoperative patient plasma; D: The linear correlations between the relative expression of lncRNAs in plasma and infrequent clonal complexes were analyzed. P values (aP < 0.05; bP < 0.01; cP < 0.001) were determined using the t-test; E: Receiver operating characteristic curves showing the area under the curve values of plasma ZFAS1 and traditional serum biomarkers; F: Progression-free survival times indicating the potential prognostic value of ZFAS1 in gastric cancer patients; G: Overall survival times indicating the potential prognostic value of ZFAS1 in gastric cancer patients. Gs/PU: Gastritis/peptic ulcer patients; GIST: Gastric stromal tumor; AUC: Area under the curve; CEA: Carcinoembryonic antigen; AFP: Alpha fetoprotein; CA-199: Carbohydrate antigen 199; OS: Overall survival; PFS: Progression-free survival.
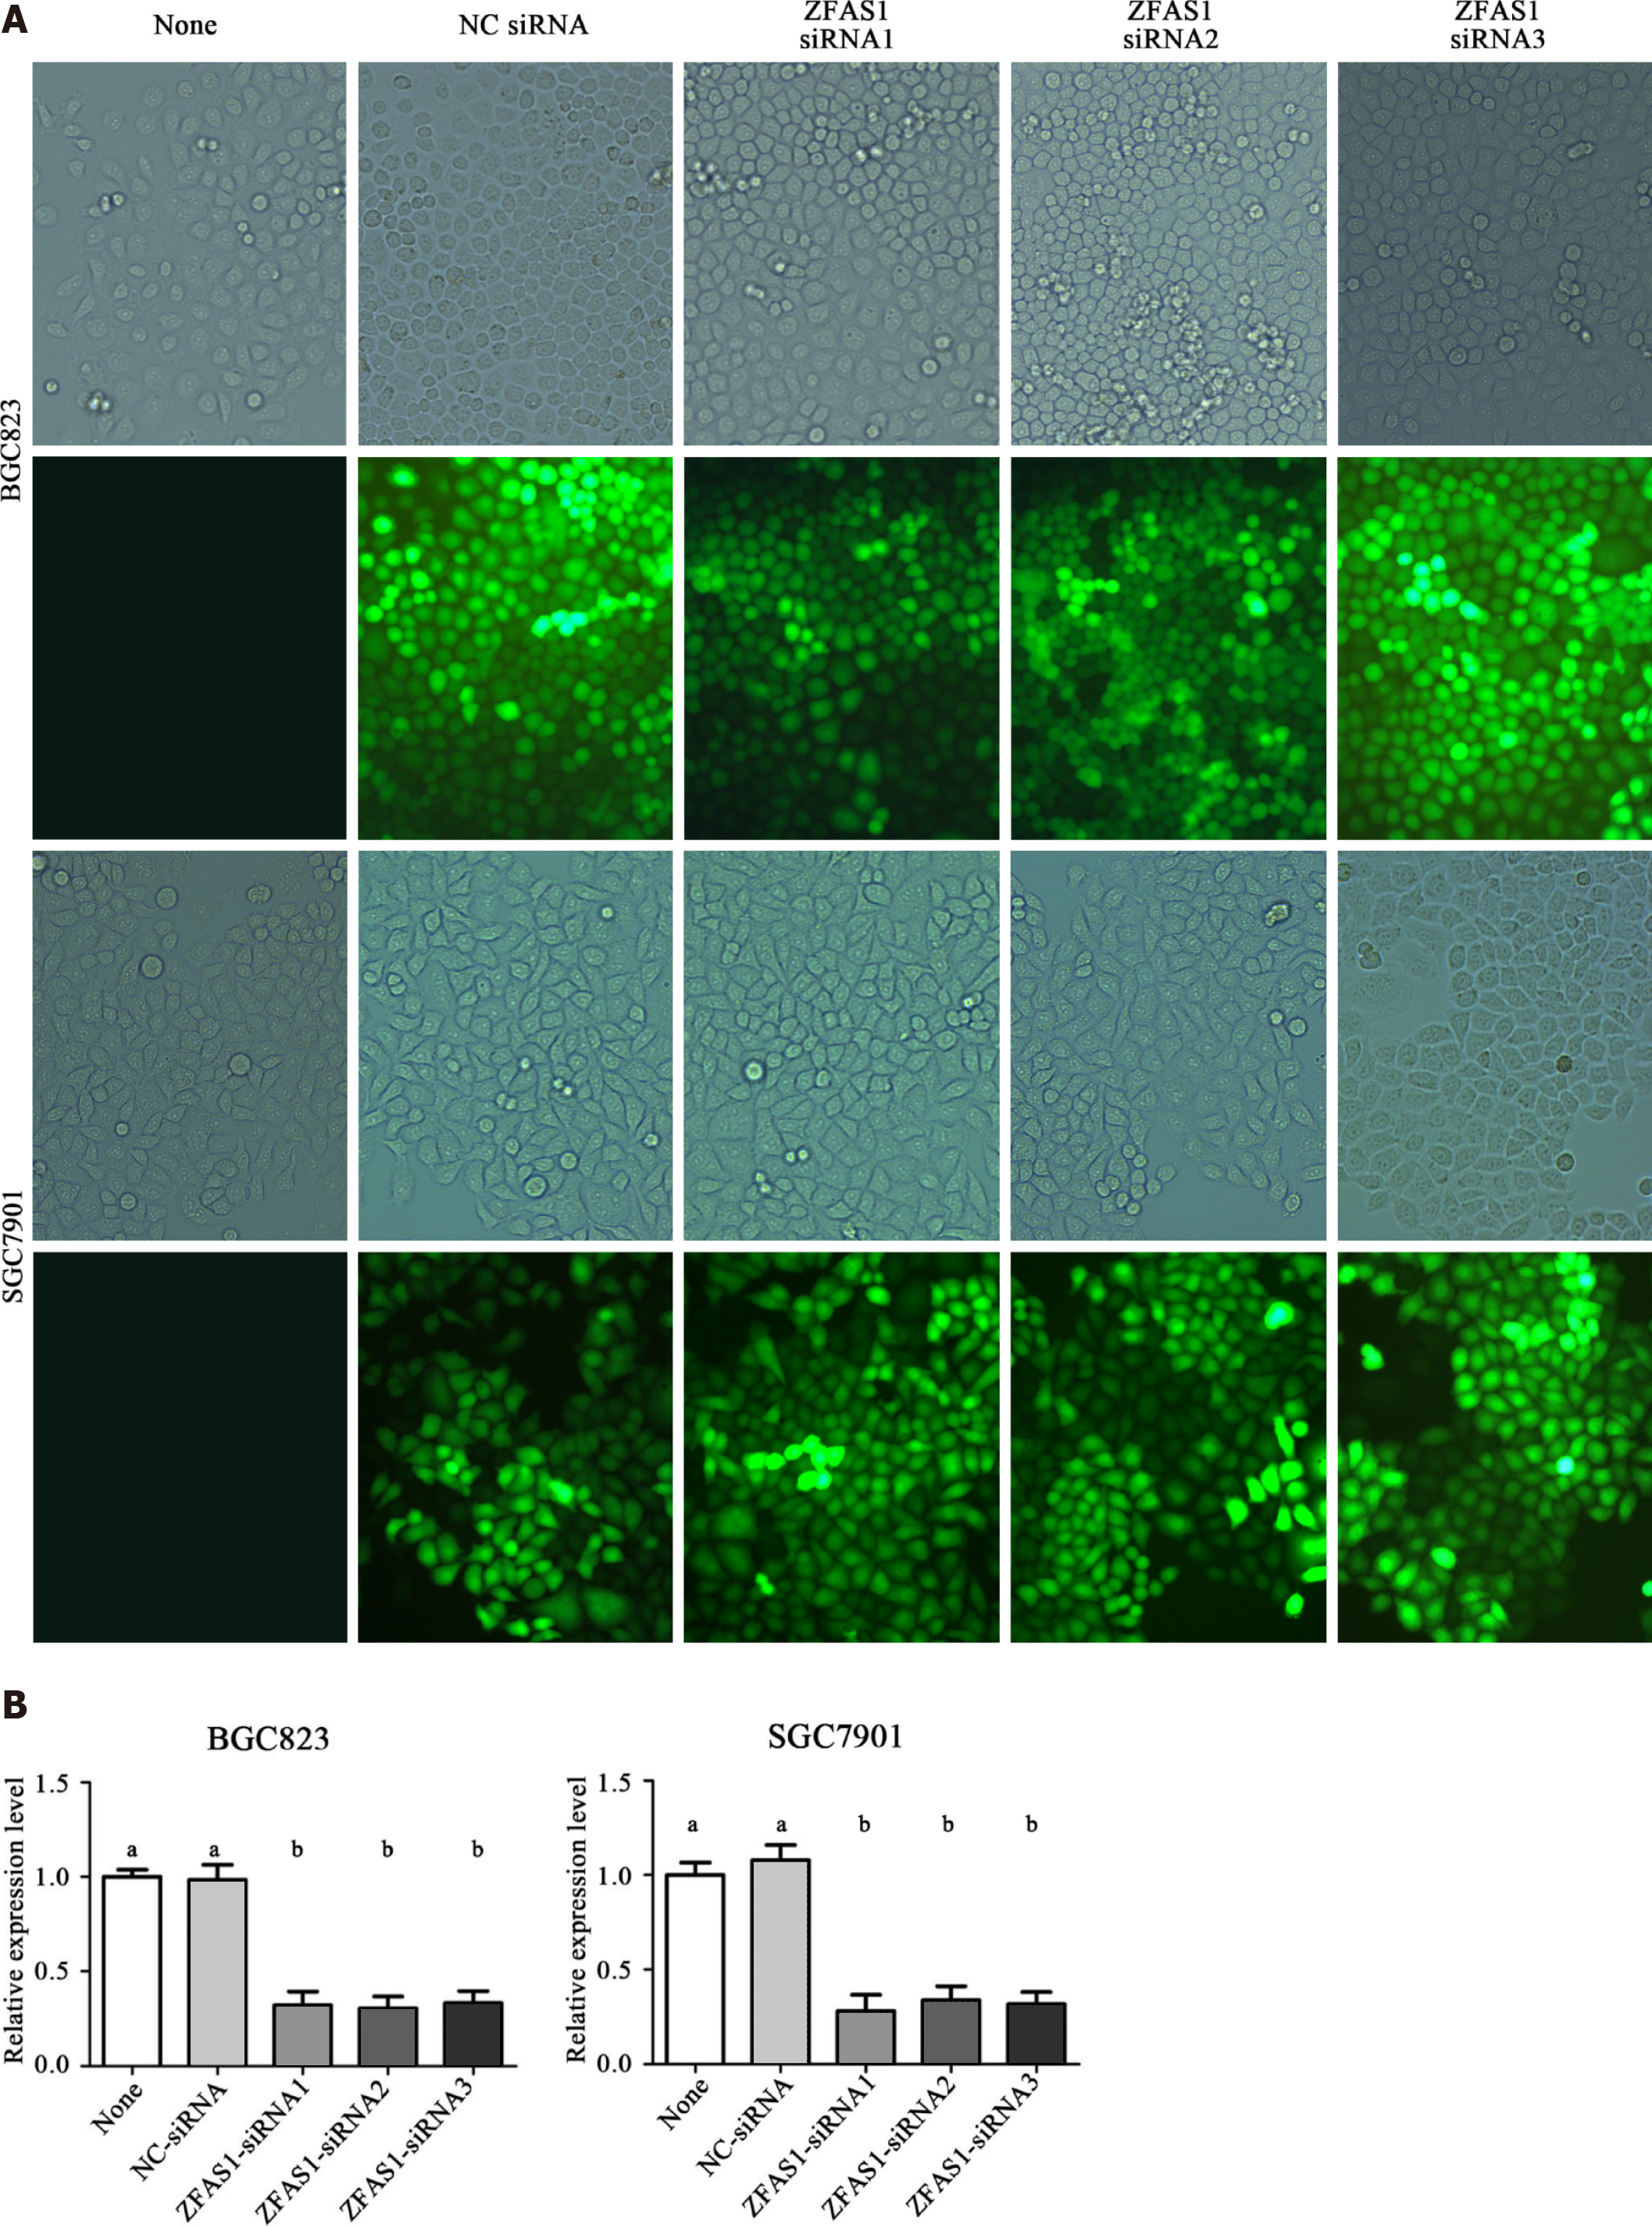
Figure 3 Fluorescence microscopy was used to verify the transfection efficiency of ZNFX1-AS1-siRNA1, ZNFX1-AS1-siRNA2 and ZNFX1-AS1-siRNA3.
A: The same position of BGC823 cells and SGC7901 cells under a normal microscope and fluorescence microscope, respectively; B: The relative expression of long noncoding RNA ZNFX1-AS1 (ZFAS1) in five groups of cells (None, NC-siRNA, ZFAS1-siRNA1, ZFAS1-siRNA2, ZFAS1-siRNA3) was evaluated by quantitative reverse transcription polymerase chain reaction. ZFAS1: ZNFX1-AS1. aP < 0.05; bP < 0.01.
Figure 4 MTT assays were performed to determine the viability of ZGCS1-shRNA1- and ZNFX1-AS1-shRNA2-transduced BGC823 and SGC7901 cells.
OD: Optical density.
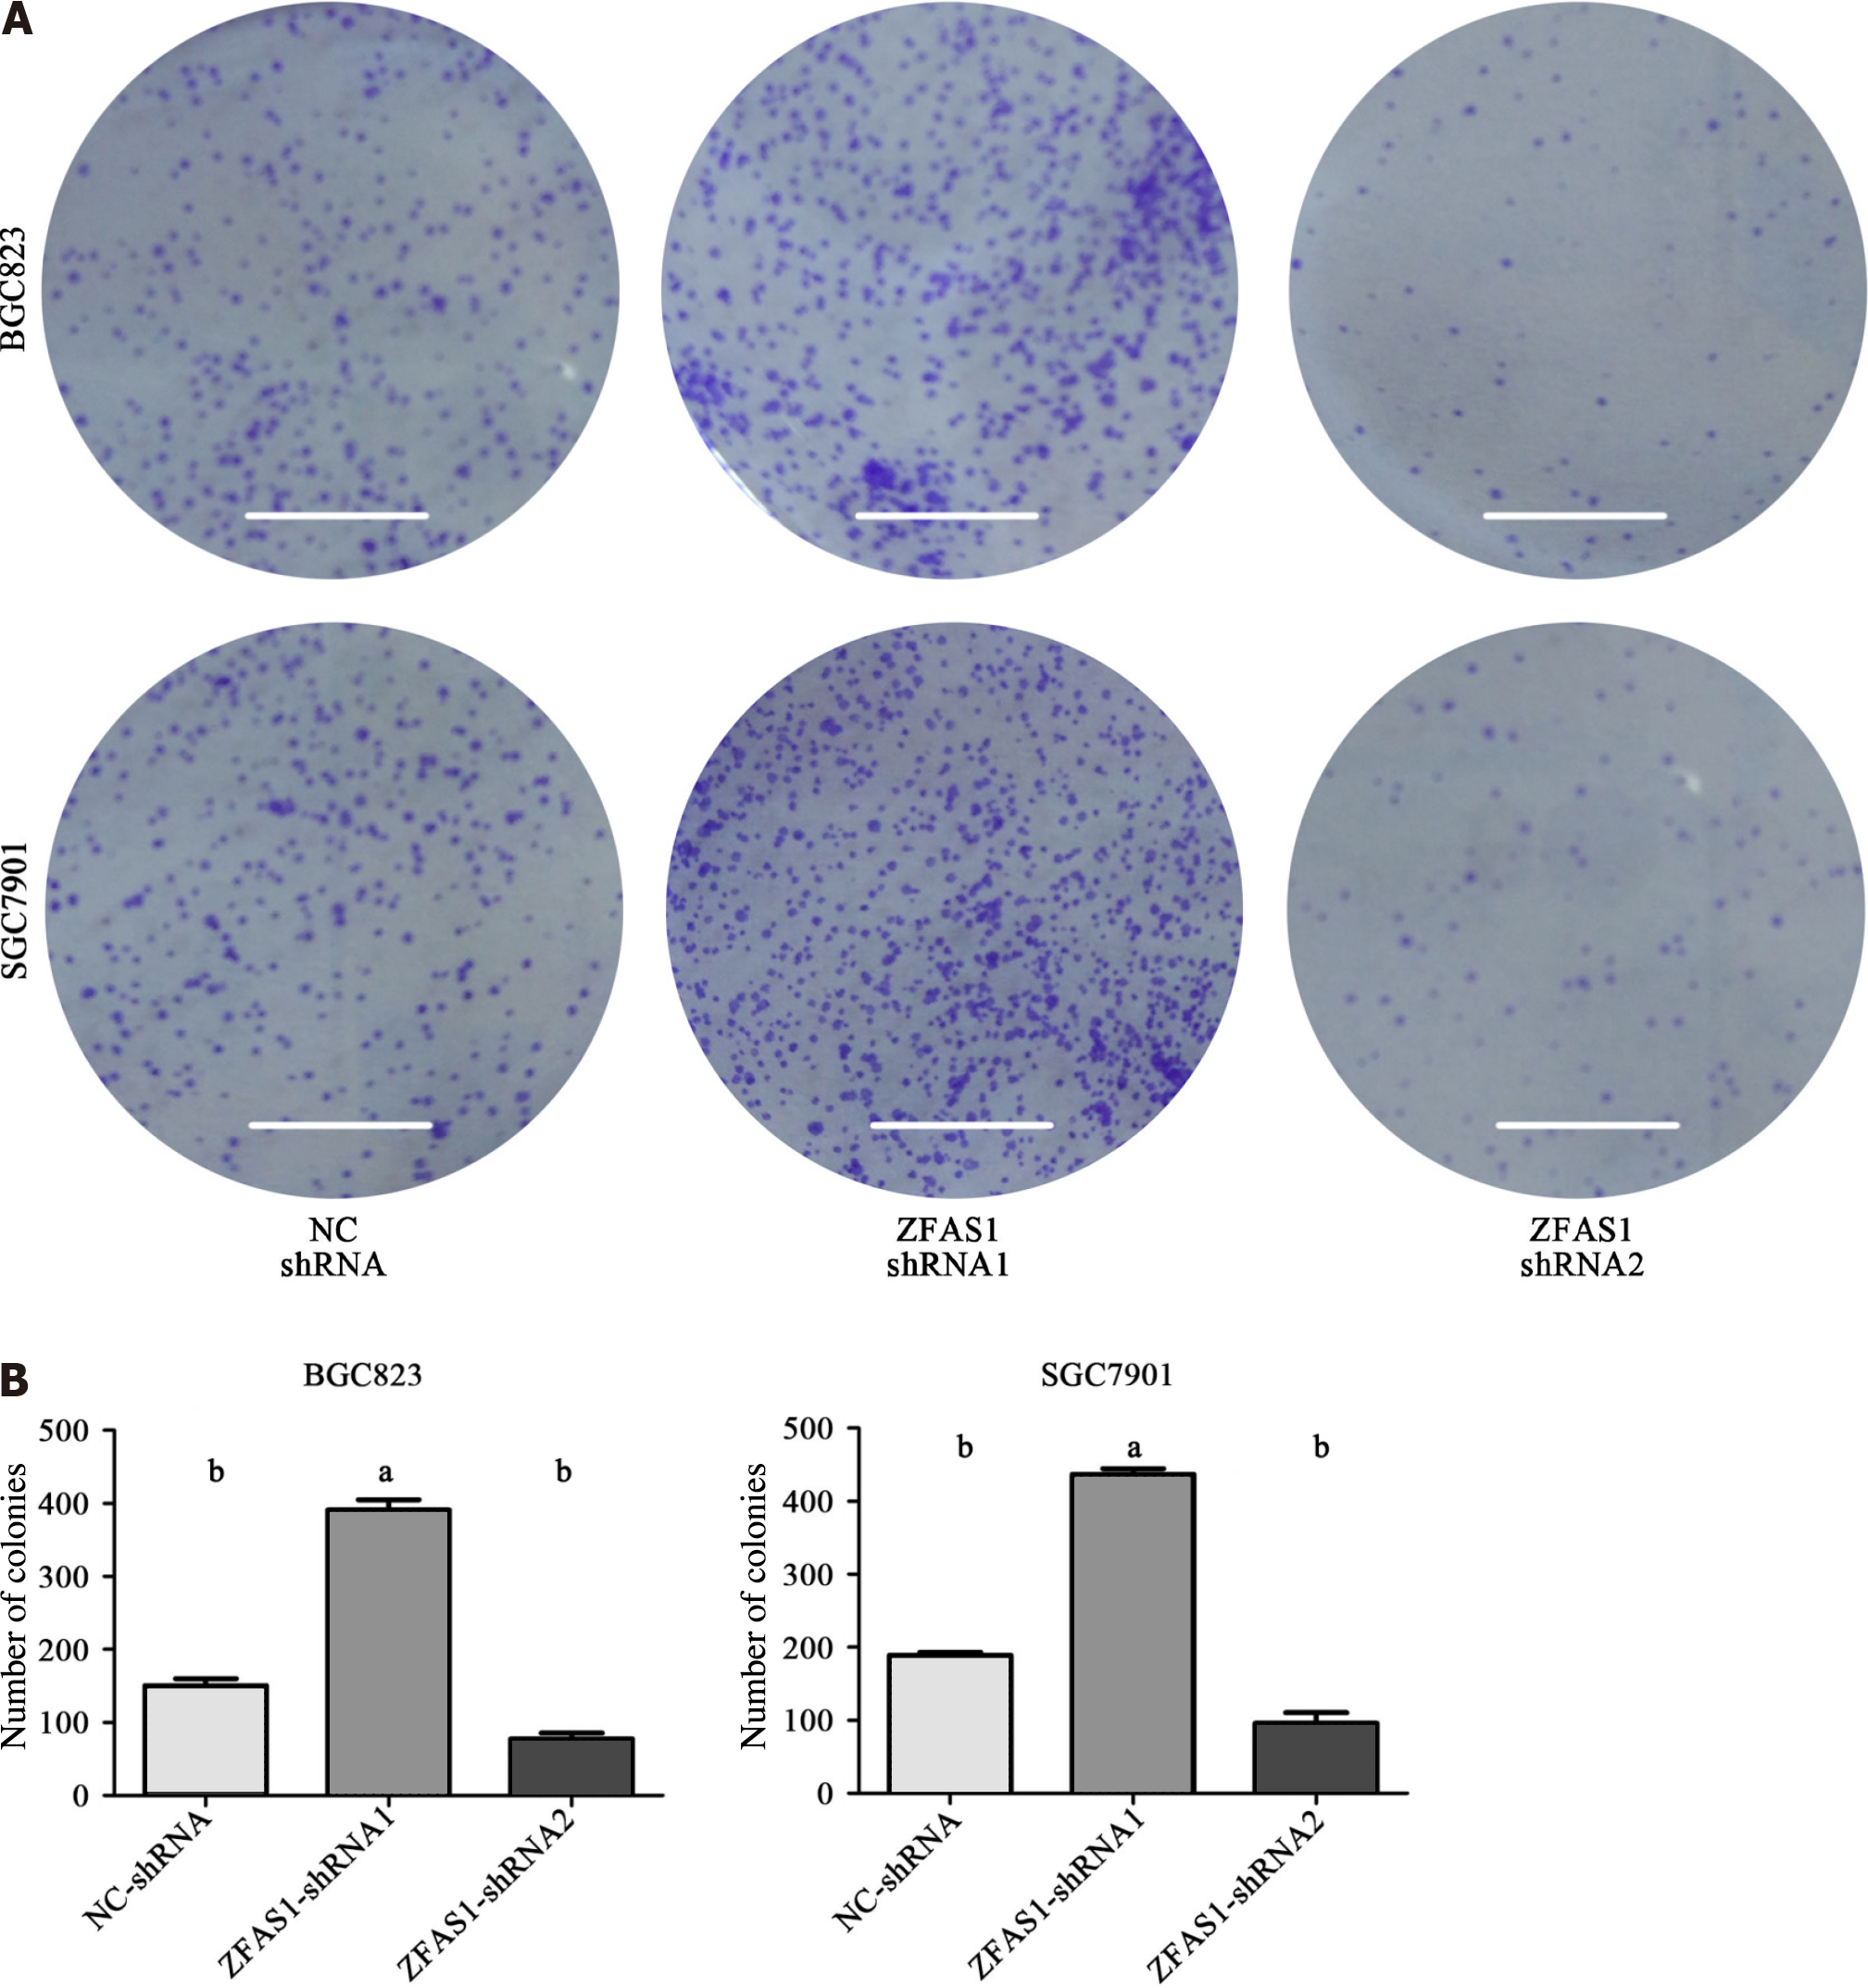
Figure 5 Colony formation assays were performed to determine the proliferation of BGC823 and SGC7901 cells transduced with ZNFX1-AS1-shRNA1 and ZNFX1-AS1-shRNA2.
A: BGC823 cells and SGC7901 cells were subjected to colony formation assay after transduction, and the number of spots was analyzed; B: The number of spots for the three groups [NC-shRNA, ZNFX1-AS1 (ZFAS1)-shRNA1, ZFAS1-shRNA2] in the colony formation assays were compared. ZFAS1: ZNFX1-AS1. aP < 0.05; bP < 0.01.
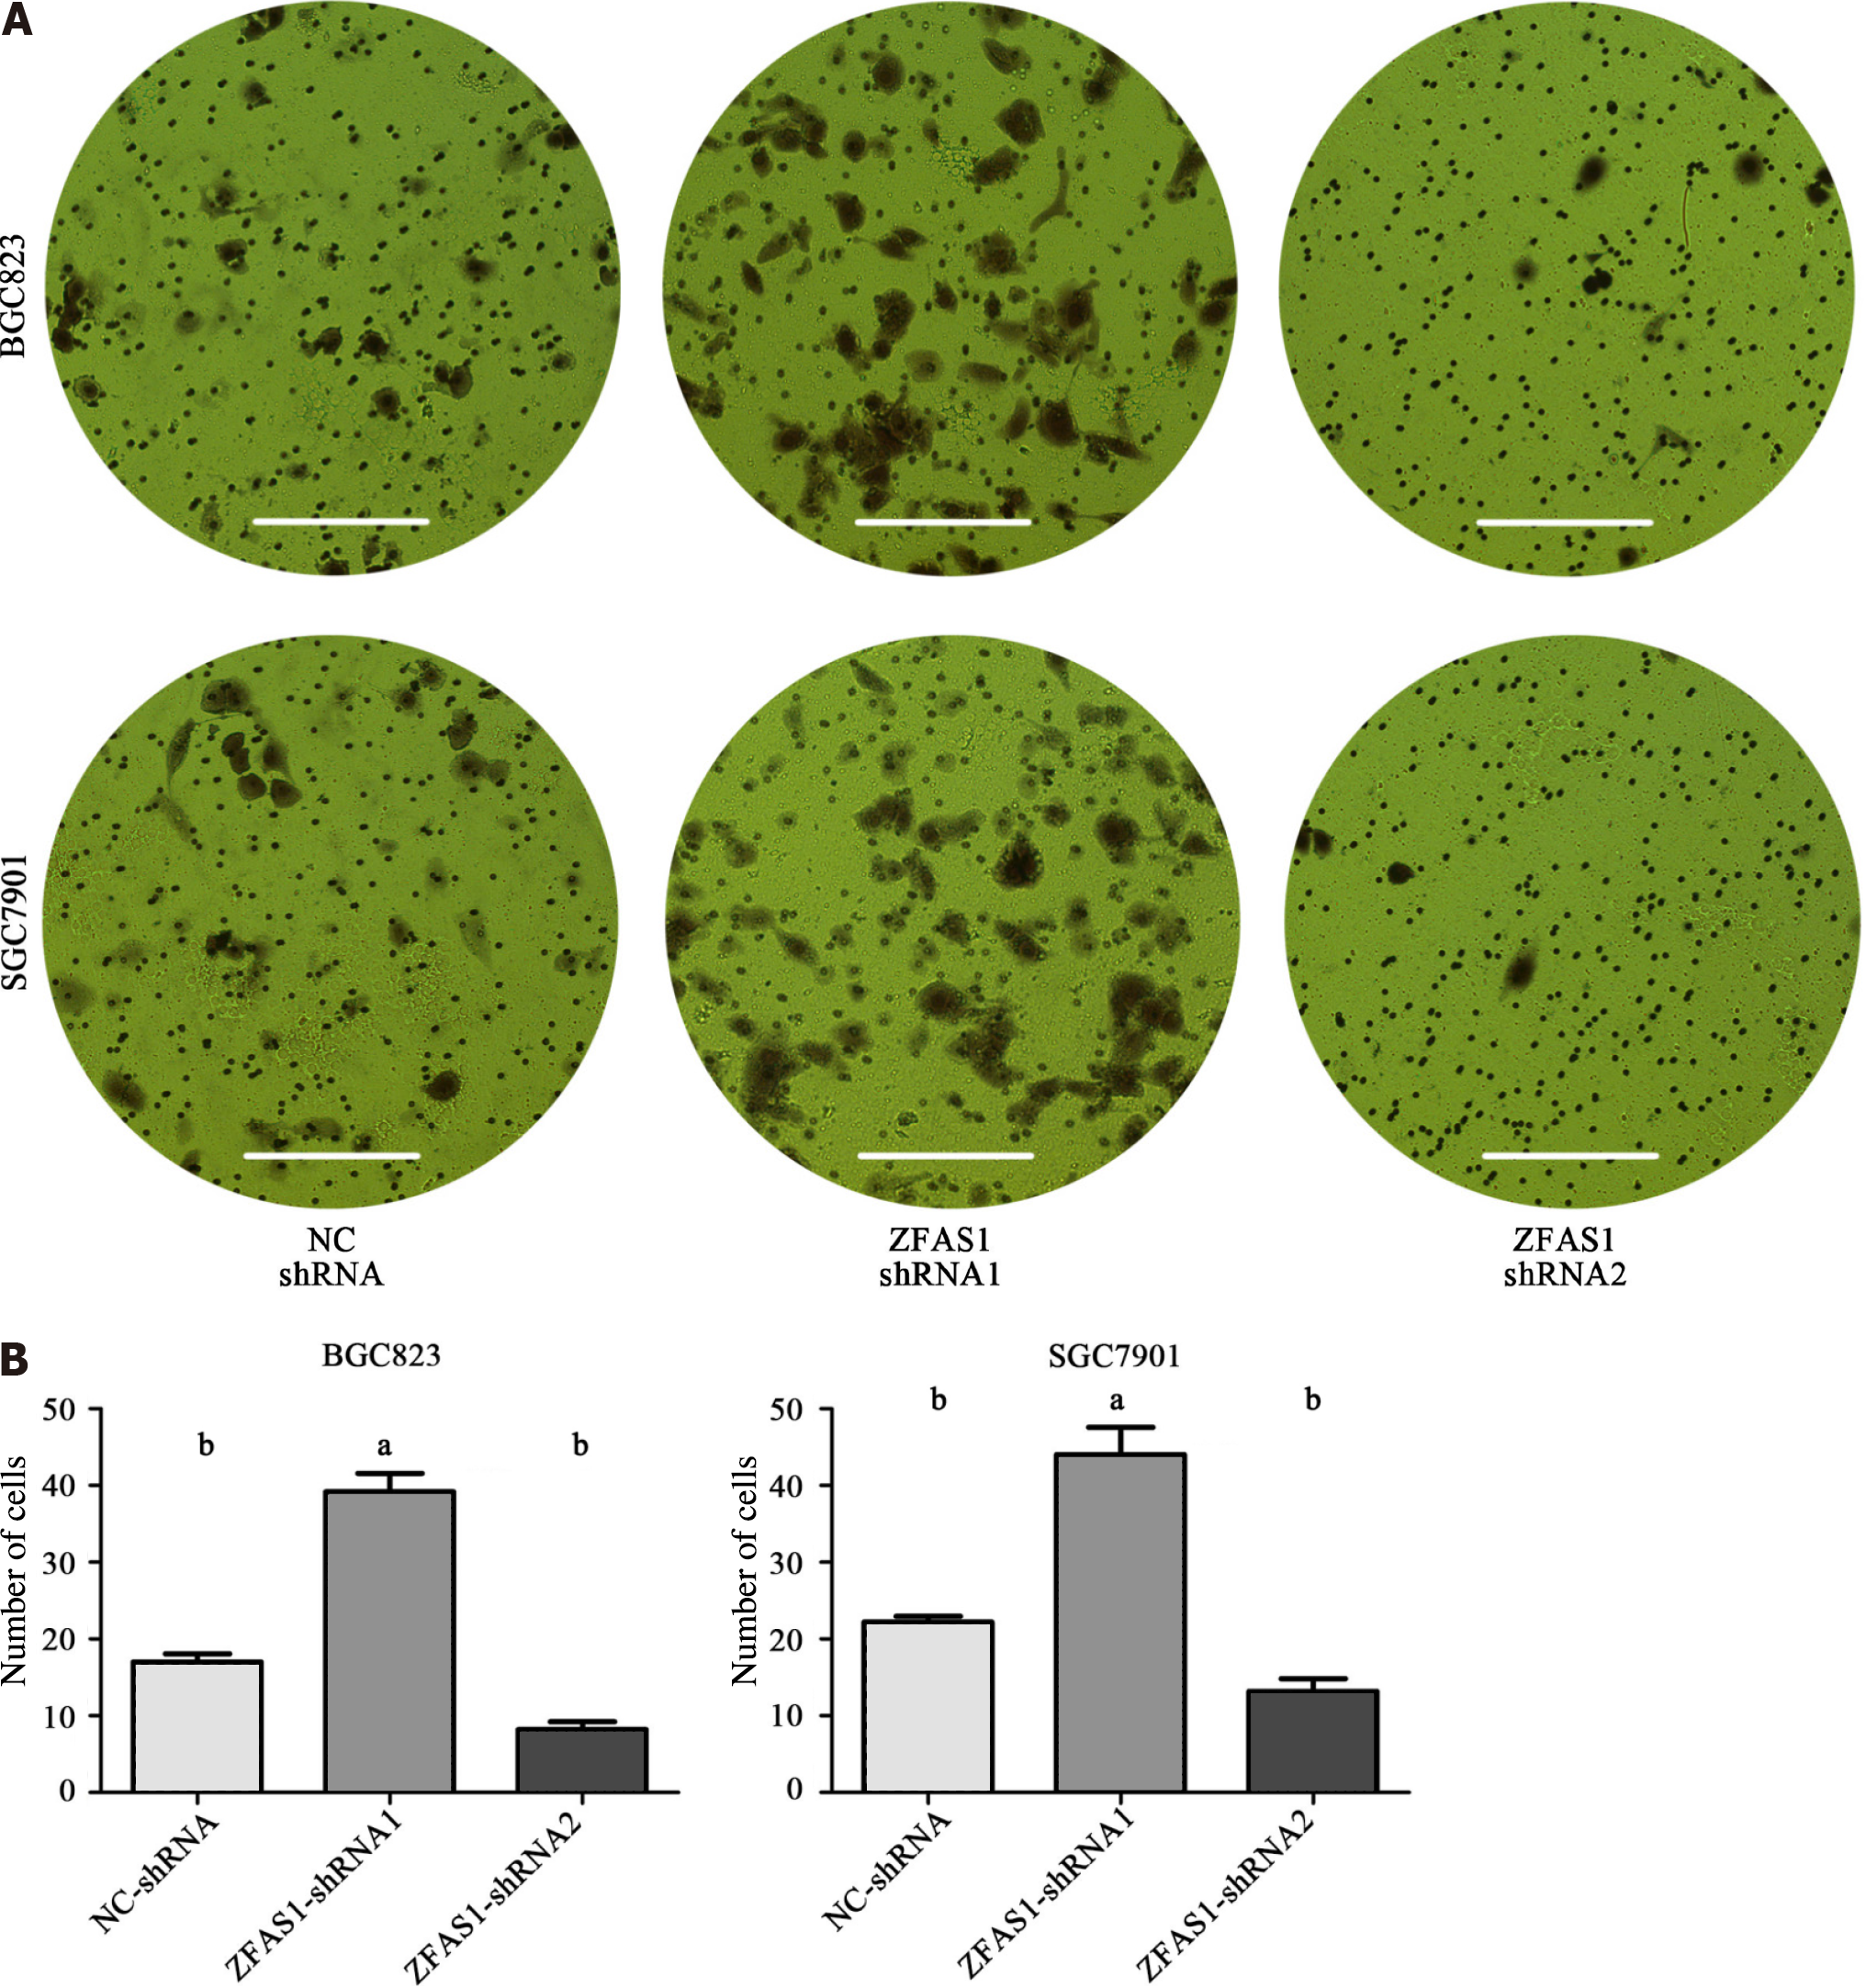
Figure 6 Transwell migration assays were performed to determine the migration ability of ZNFX1-AS1-shRNA1- and ZNFX1-AS1-shRNA2-transduced BGC823 and SGC7901 cells.
A: BGC823 cells and SGC7901 cells were subjected to transwell migration assay after transduction, and the number of cell was calculated; B: The number of cells for the three groups [NC-shRNA, ZNFX1-AS1 (ZFAS1)-shRNA1, ZFAS1-shRNA2] in the transwell migration assays were compared. aP < 0.05; bP < 0.01. ZFAS1: ZNFX1-AS1.
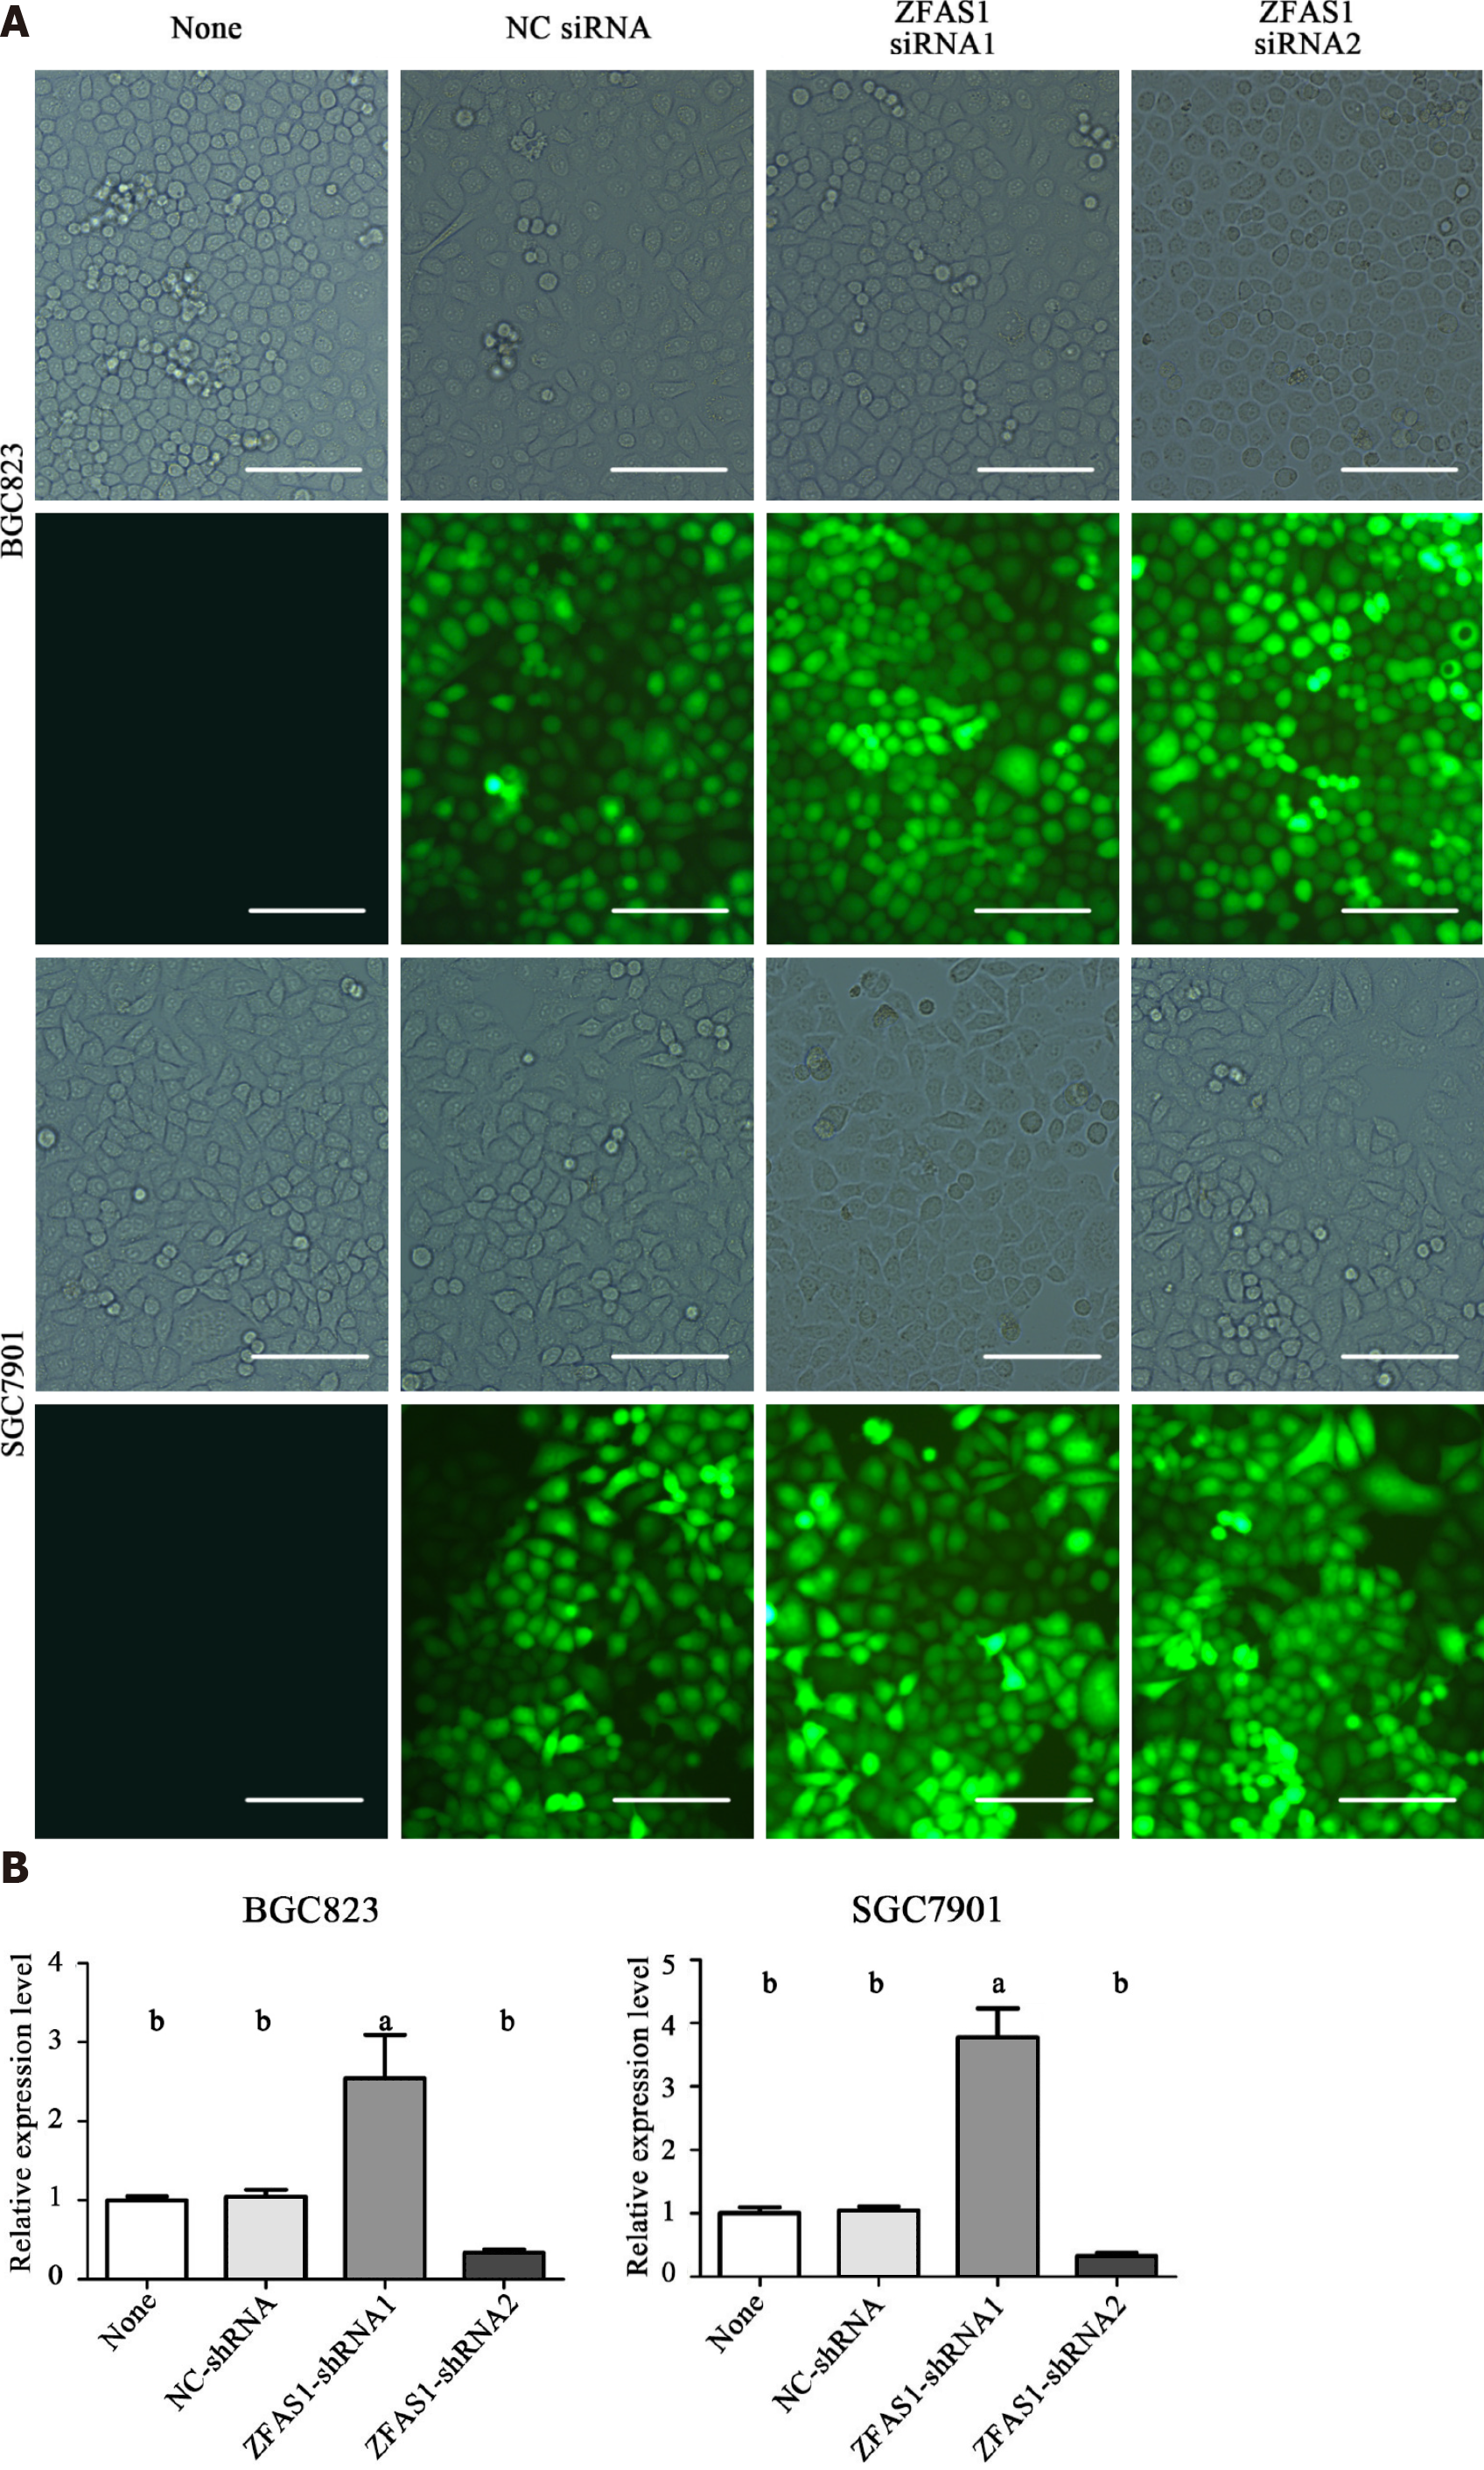
Figure 7 Fluorescence microscopy was used to test the transduction efficiency of ZNFX1-AS1-shRNA1 and ZNFX1-AS1-shRNA2.
A: The same position of BGC823 cells and SGC7901 cells under a normal microscope and fluorescence microscope, respectively; B: The relative expression of long noncoding RNA ZNFX1-AS1 (ZFAS1) in four groups of cells (None, NC-shRNA, ZFAS1-shRNA1, ZFAS1-shRNA2) was evaluated by quantitative reverse transcription polymerase chain reaction. ZFAS1: ZNFX1-AS1. aP < 0.05; bP < 0.01.
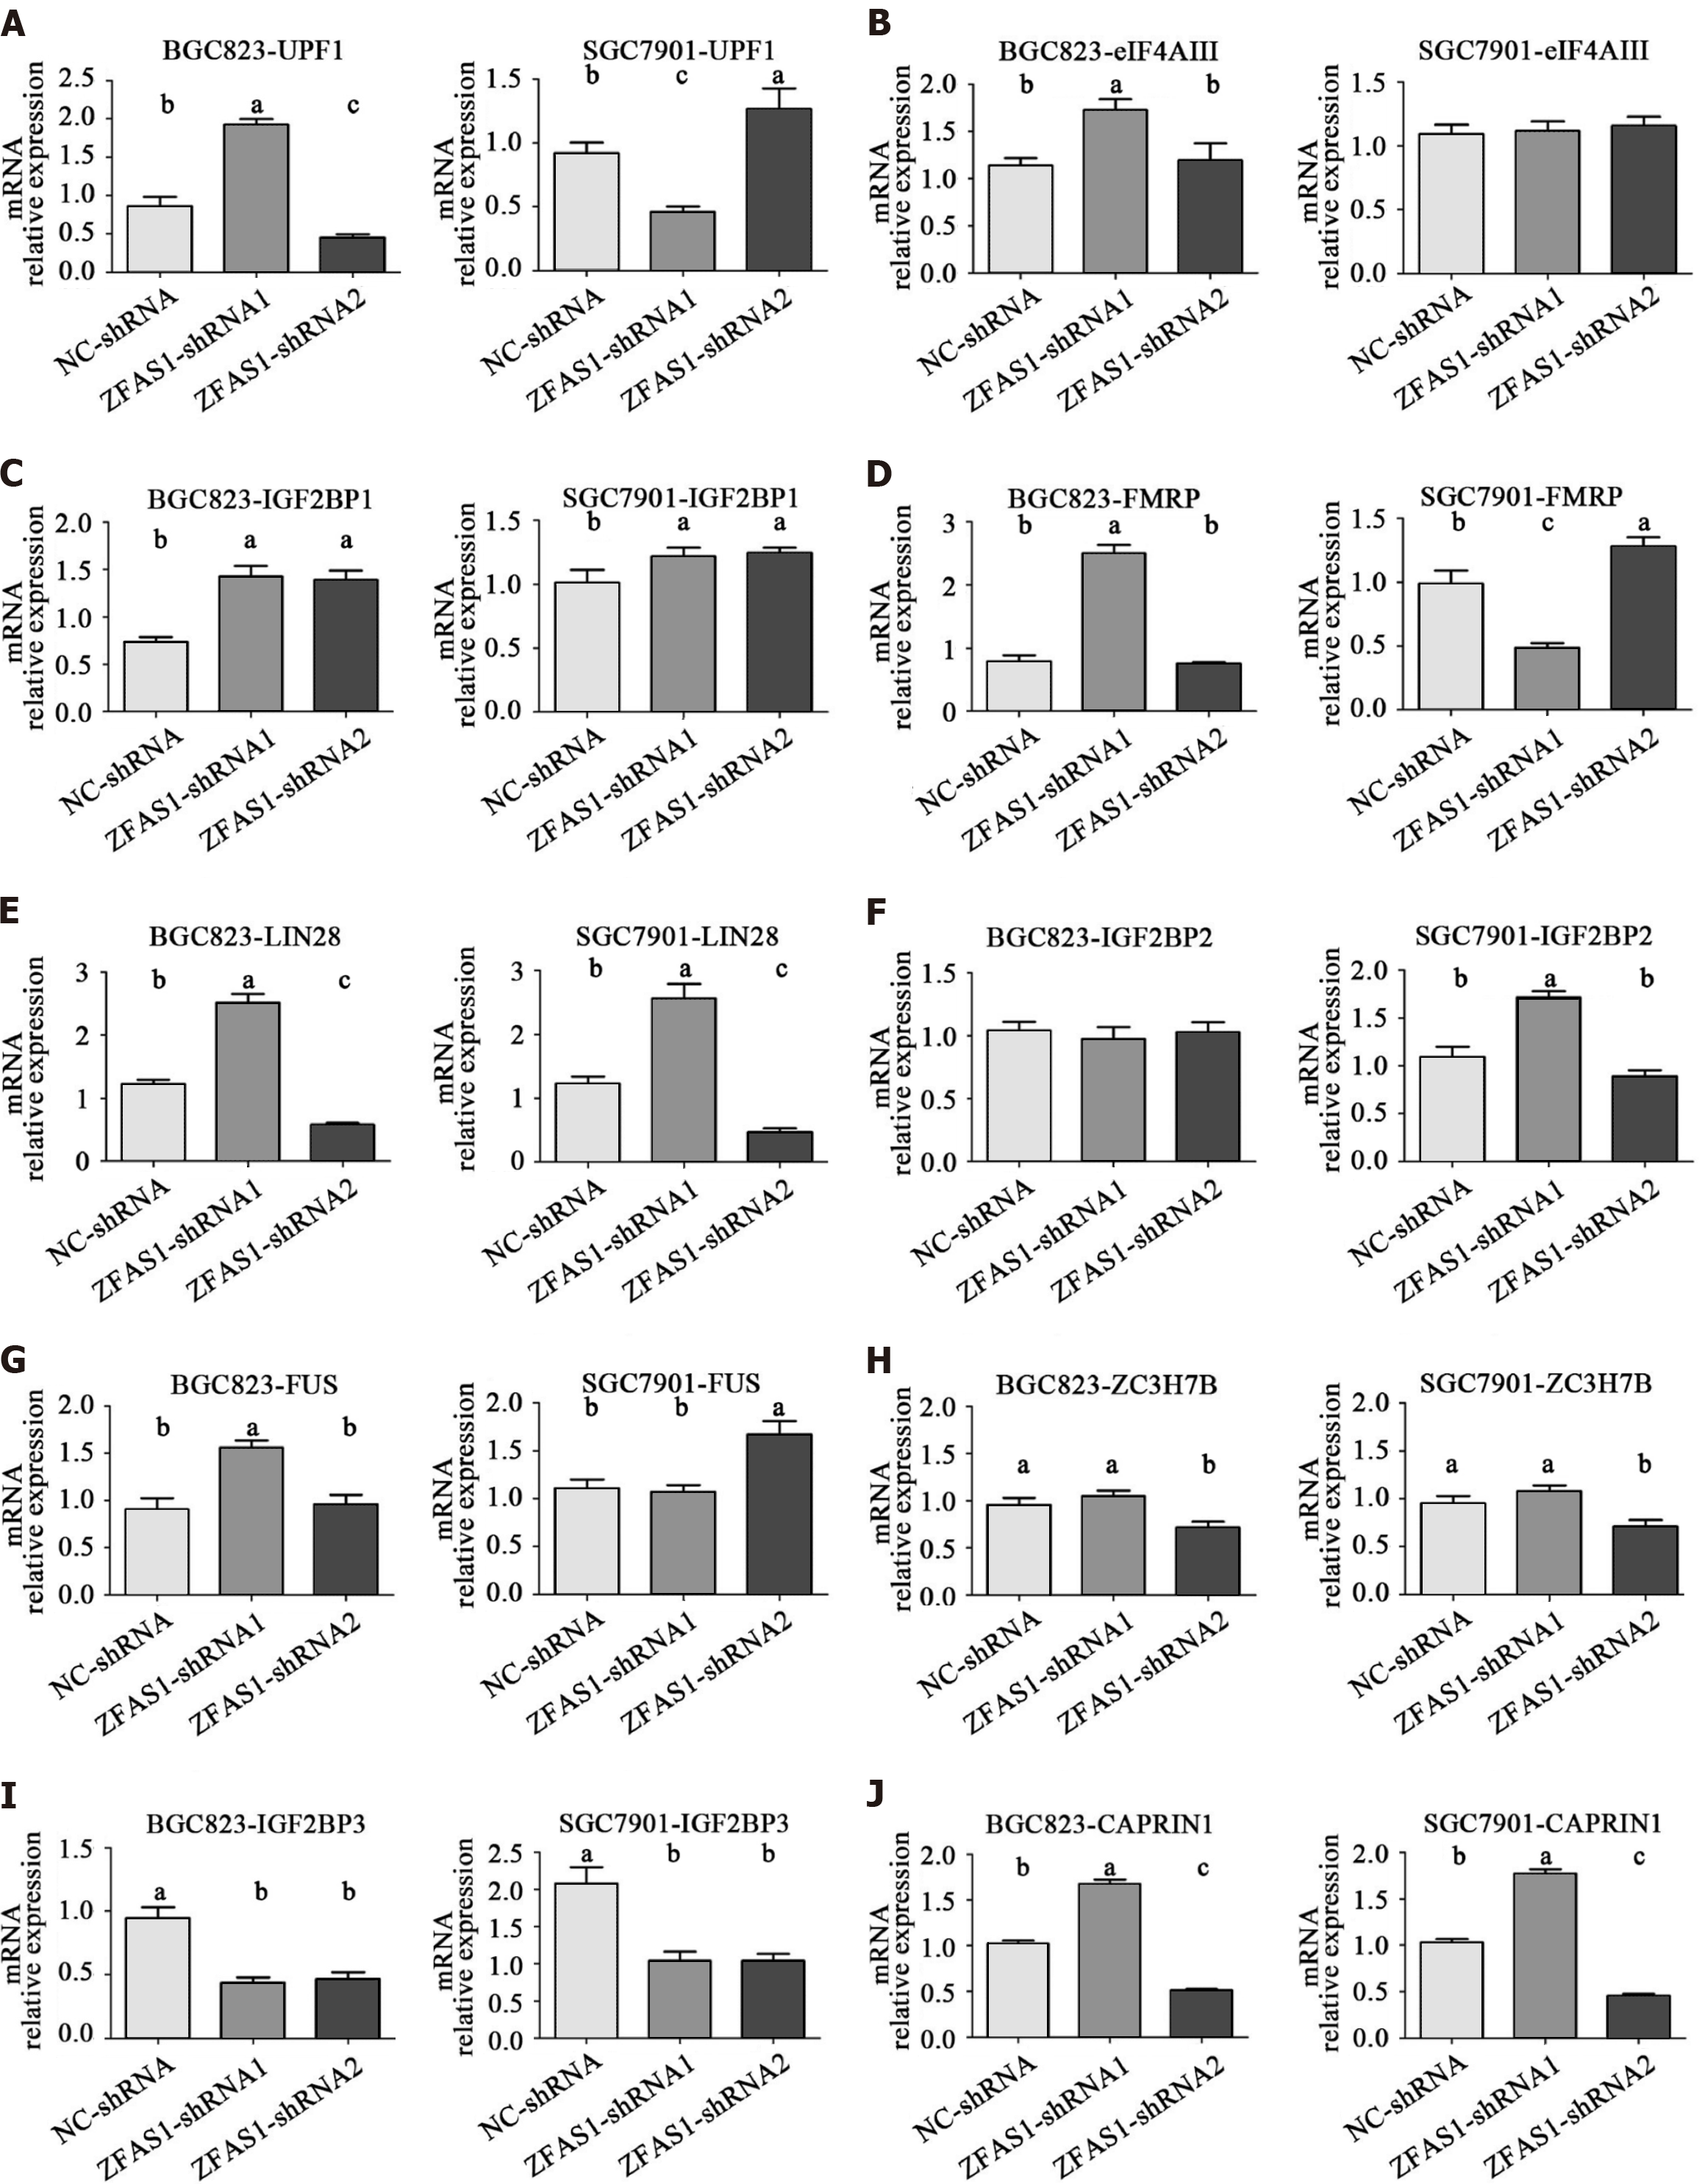
Figure 8 The relative mRNA levels of genes encoding ZNFX1-AS1 binding proteins in transduced BGC823 and SGC7901 cells were determined by quantitative reverse transcription polymerase chain reaction.
A: UFP1; B: eIF4AIII; C: IGF2BP1; D: FMRP; E: LIN28; F: IGF2BP2; G: FUS; H: ZC3H7B; I: IGF2BP3; J: CAPRIN1. AFAS1: ZNFX1-AS1. aP < 0.05; bP < 0.01.
Figure 9 The relative protein levels of LIN28 and CAPRIN1 in transduced BGC823 and SGC7901 cells were determined by enzyme-linked immunosorbent assay.
A: The levels of CAPRIN1 in transduced BGC823 cells; B: The levels of CAPRIN1 in transduced SGC7901 cells; C: The levels of LIN28 in transduced BGC823 cells; D: The levels of LIN28 in transduced SGC7901 cells. aP < 0.05; bP < 0.01.
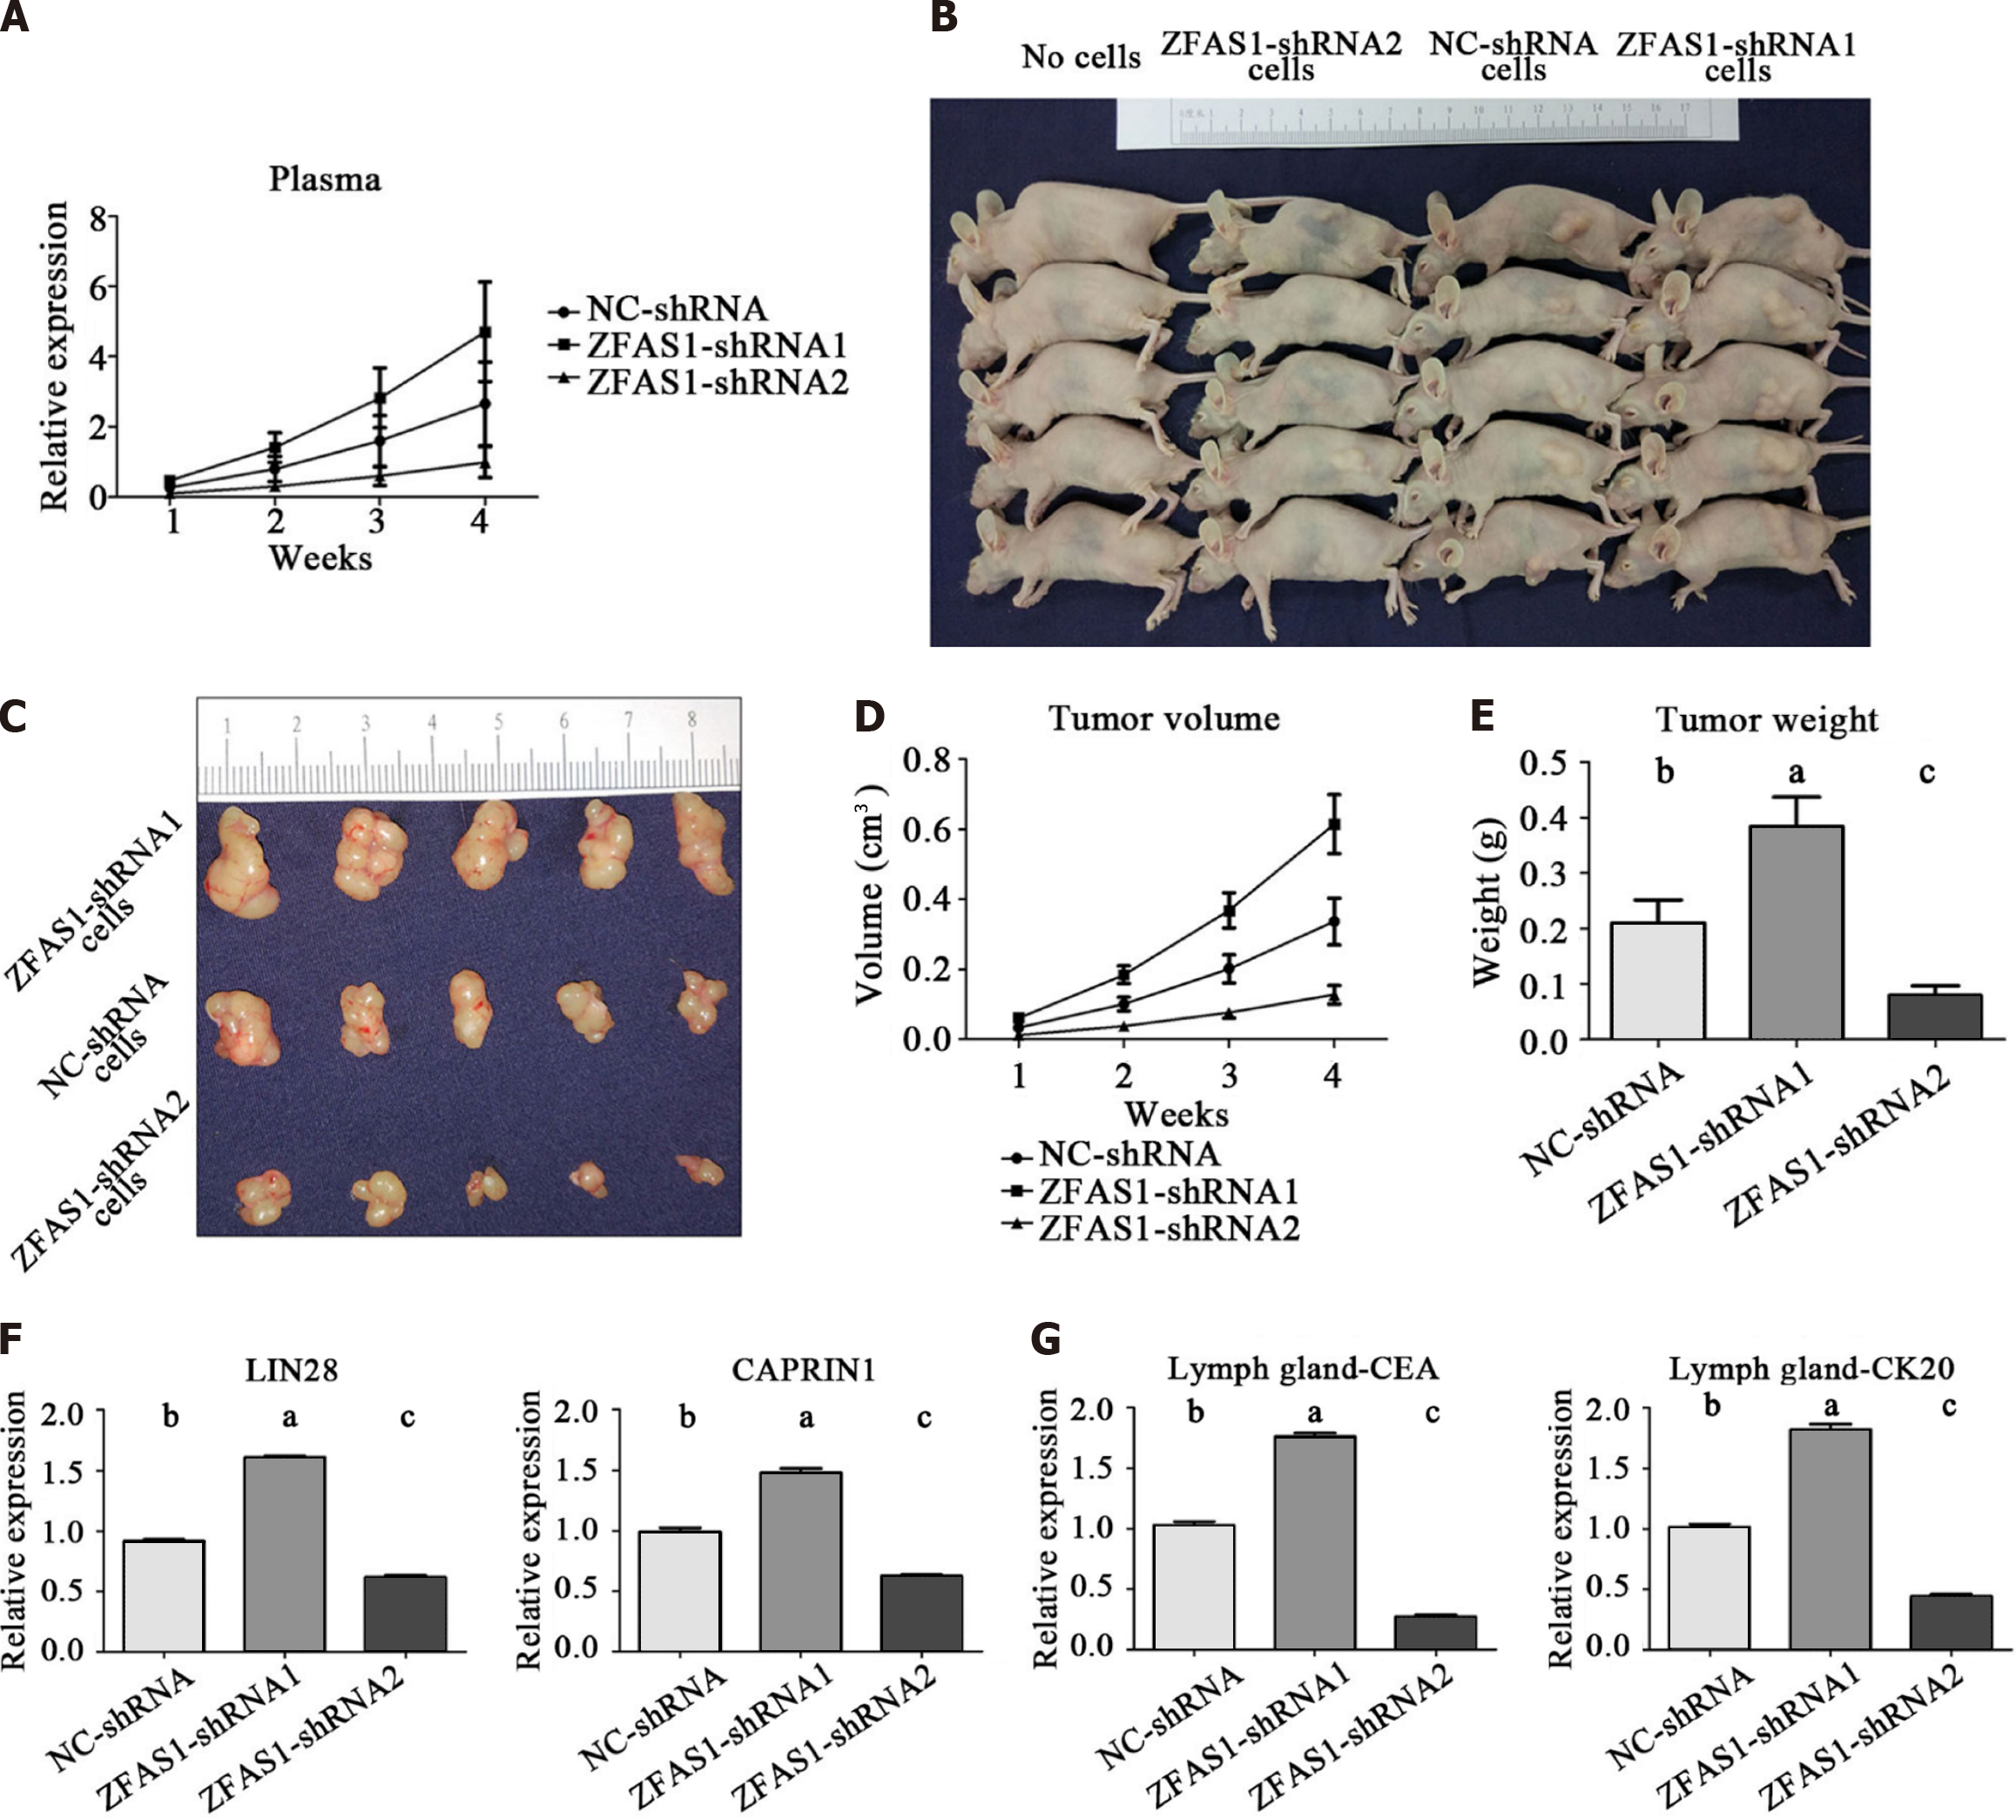
Figure 10 Effect of ZNFX1-AS1 on gastric cancer cell tumorigenesis in vivo.
A: The expression of long noncoding RNA ZNFX1-AS1 in BALB/c nude mice was detected weekly by quantitative reverse transcription polymerase chain reaction; B and C: Images of tumors from BALB/c nude mice; D and E: Tumor size and weight were measured weekly; F: Expression of LIN28 and CAPRIN1 in tumors of BALB/c nude mice; G: Expression of carcinoembryonic antigen and CK20 in lymph nodes of BALB/c nude mice. CEA: Carcinoembryonic antigen; ZFAS1: ZNFX1-AS1. aP < 0.05; bP < 0.01; cP < 0.001.
- Citation: Zhuo ZL, Xian HP, Sun YJ, Long Y, Liu C, Liang B, Zhao XT. Long noncoding RNA ZNFX1-AS1 promotes the invasion and proliferation of gastric cancer cells by regulating LIN28 and CAPR1N1. World J Gastroenterol 2022; 28(34): 4973-4992
- URL: https://www.wjgnet.com/1007-9327/full/v28/i34/4973.htm
- DOI: https://dx.doi.org/10.3748/wjg.v28.i34.4973


