Copyright
©The Author(s) 2022.
World J Gastroenterol. Aug 14, 2022; 28(30): 4133-4151
Published online Aug 14, 2022. doi: 10.3748/wjg.v28.i30.4133
Published online Aug 14, 2022. doi: 10.3748/wjg.v28.i30.4133
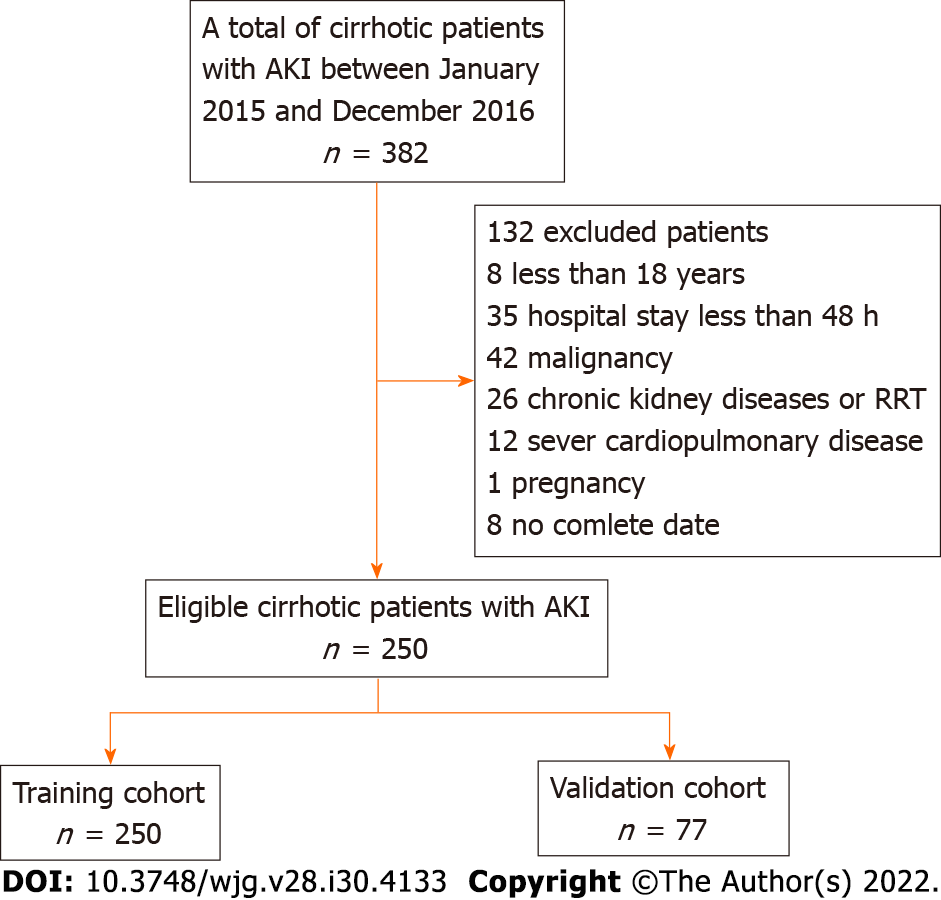
Figure 1 Flow chart of patient inclusion and exclusion.
AKI: Acute kidney injury; RRT: Renal replacement therapy.
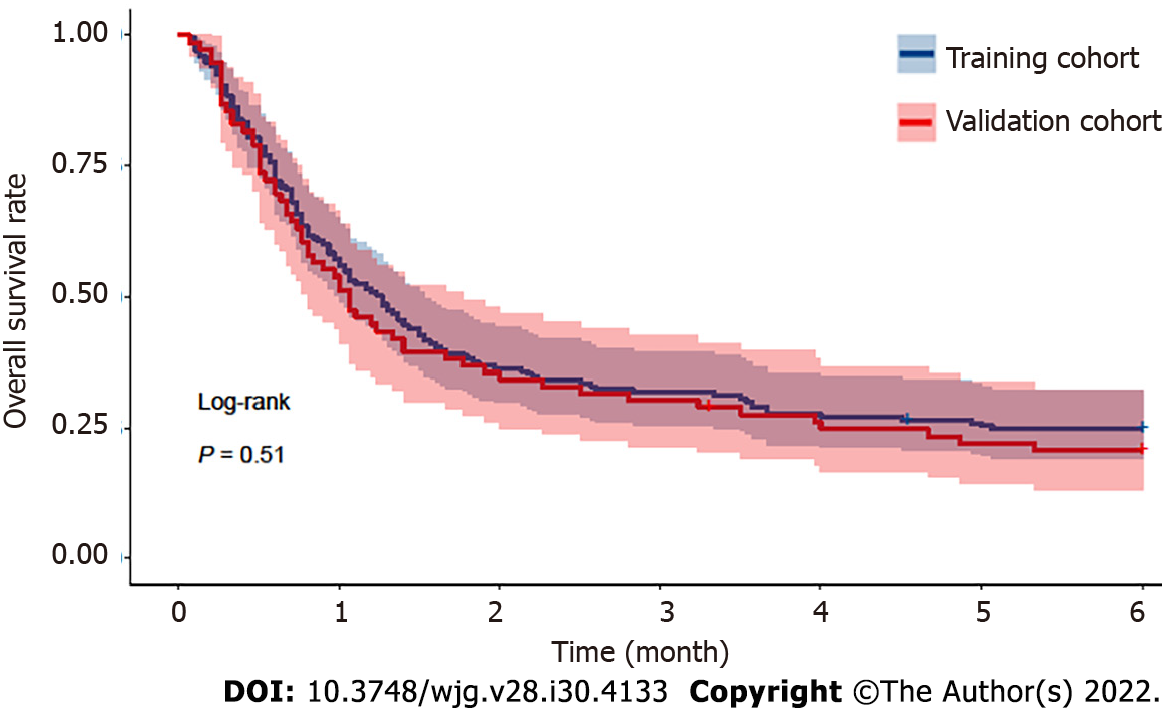
Figure 2 Kaplan–Meier analysis of the overall survival of cirrhotic patients with acute kidney injury within 180 d in both the training and validation cohorts.
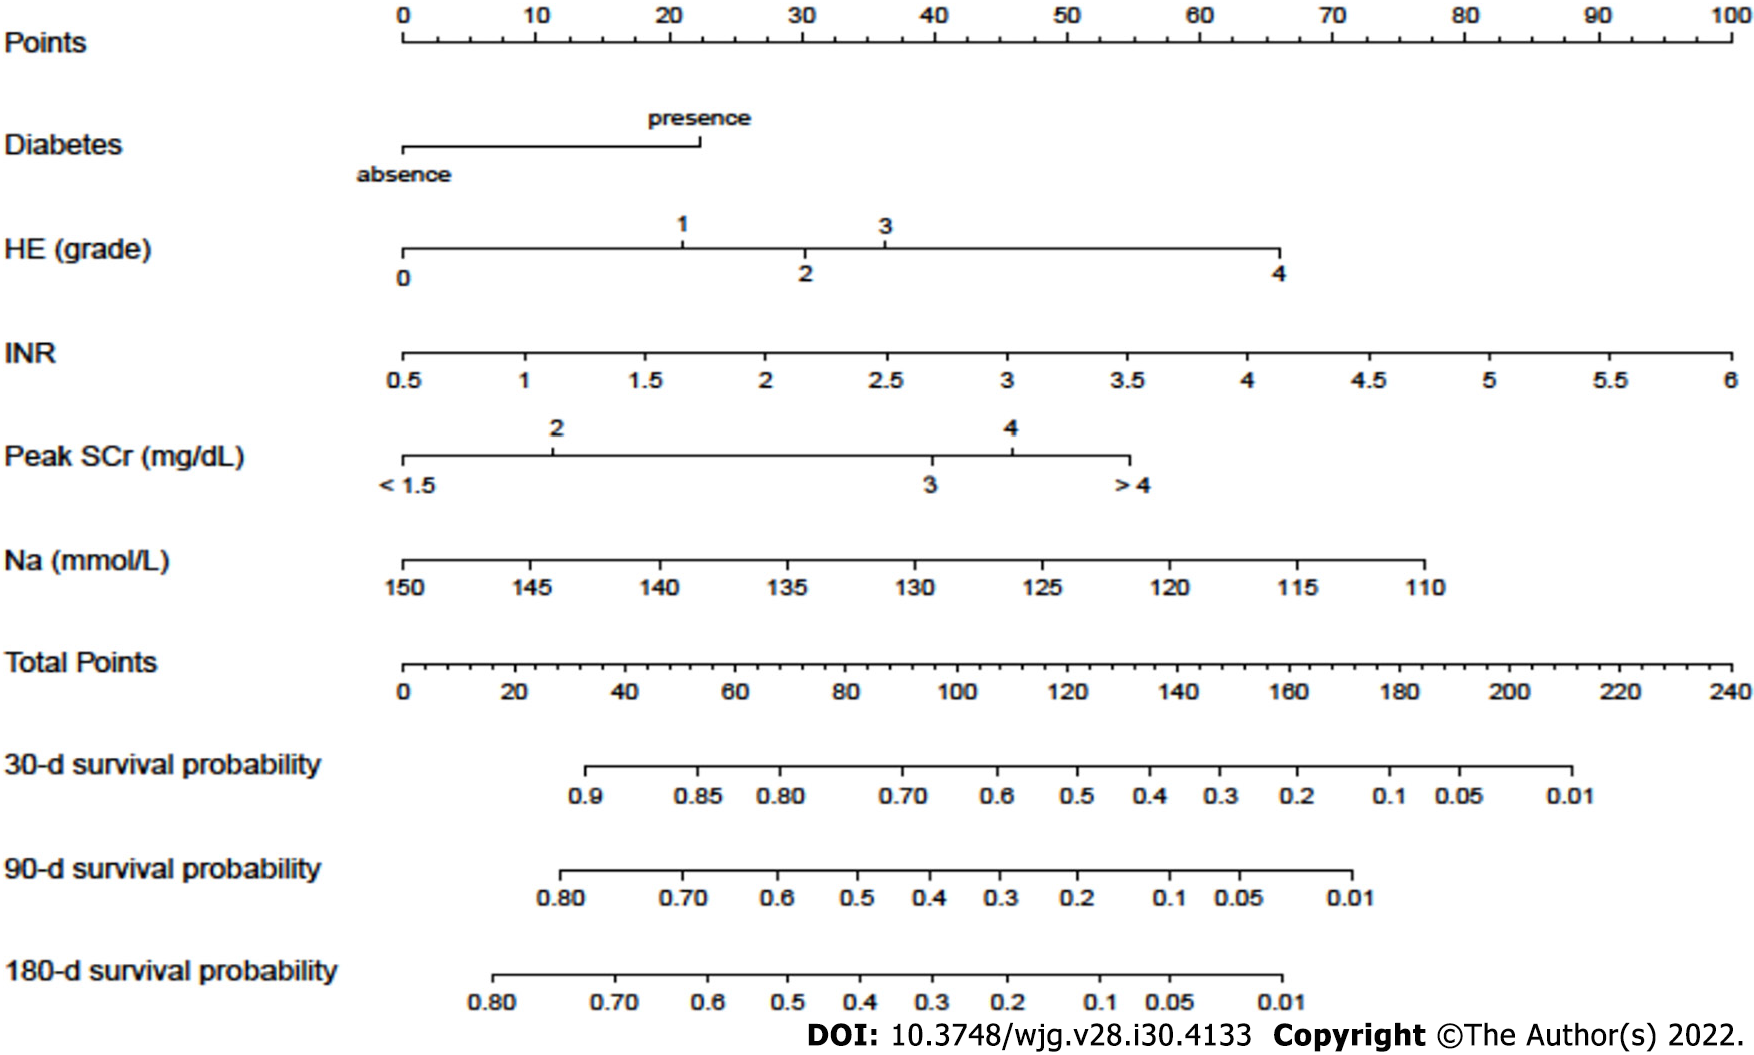
Figure 3 A nomogram for predicting the 30-d, 90-d and 180-d overall survival of cirrhotic patients with acute kidney injury.
HE: Hepatic encephalopathy; SCr: Serum creatinine; INR: International normalized ratio.
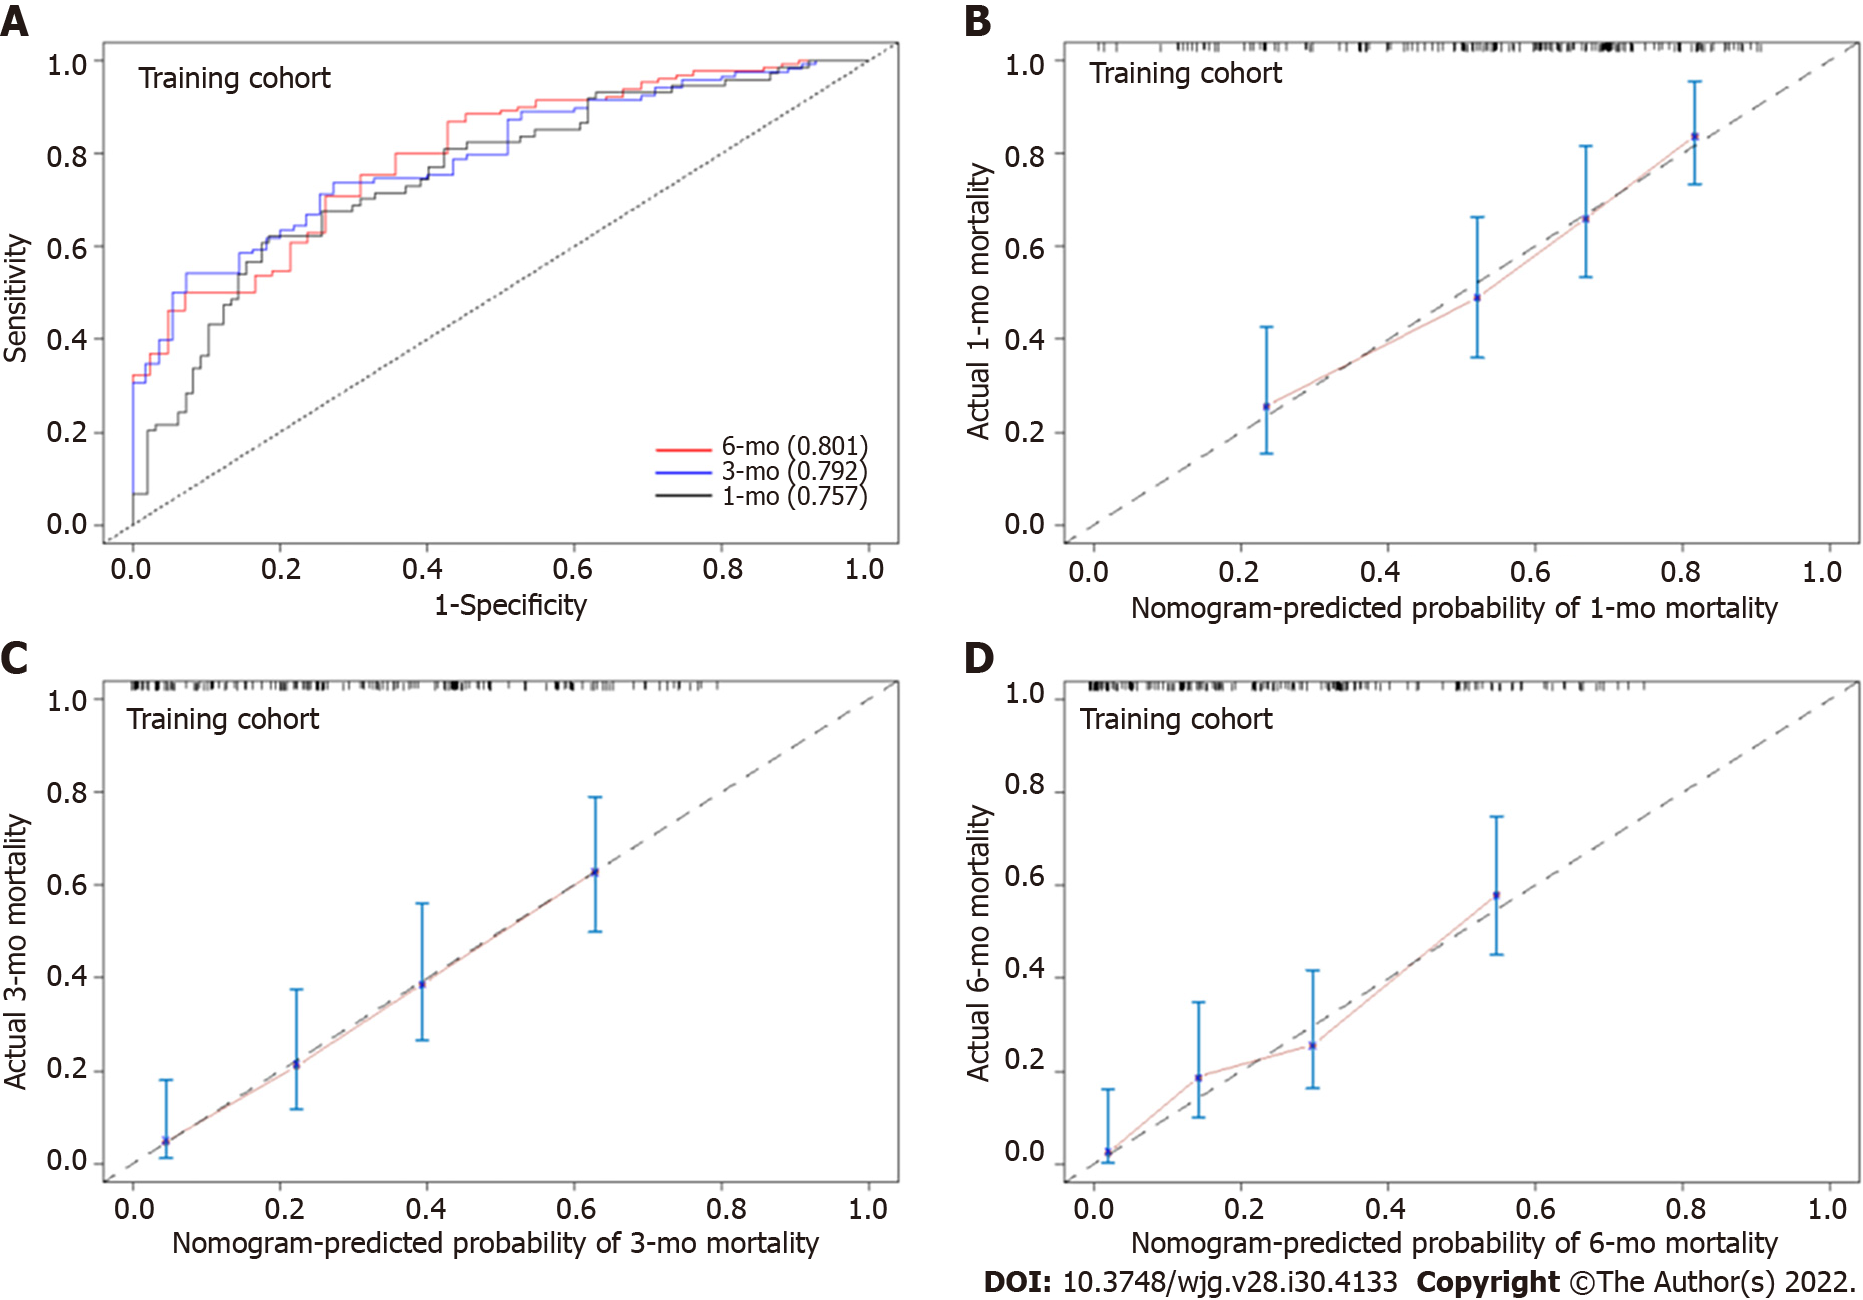
Figure 4 The area under the receiver operating characteristic curve and calibration curve of the nomogram for predicting the overall survival of cirrhotic patients with acute kidney injury in the training cohort.
A: The area under the receiver operating characteristic curve of the nomogram for mortality at 30-, 90- and 180-d in the training cohort; B: Calibration curve of the nomogram in predicting 30-d overall survival in the training cohort; C: Calibration curve of the nomogram in predicting 90-d overall survival in the training cohort; D: Calibration curve of the nomogram in predicting 180-d overall survival in the training cohort.
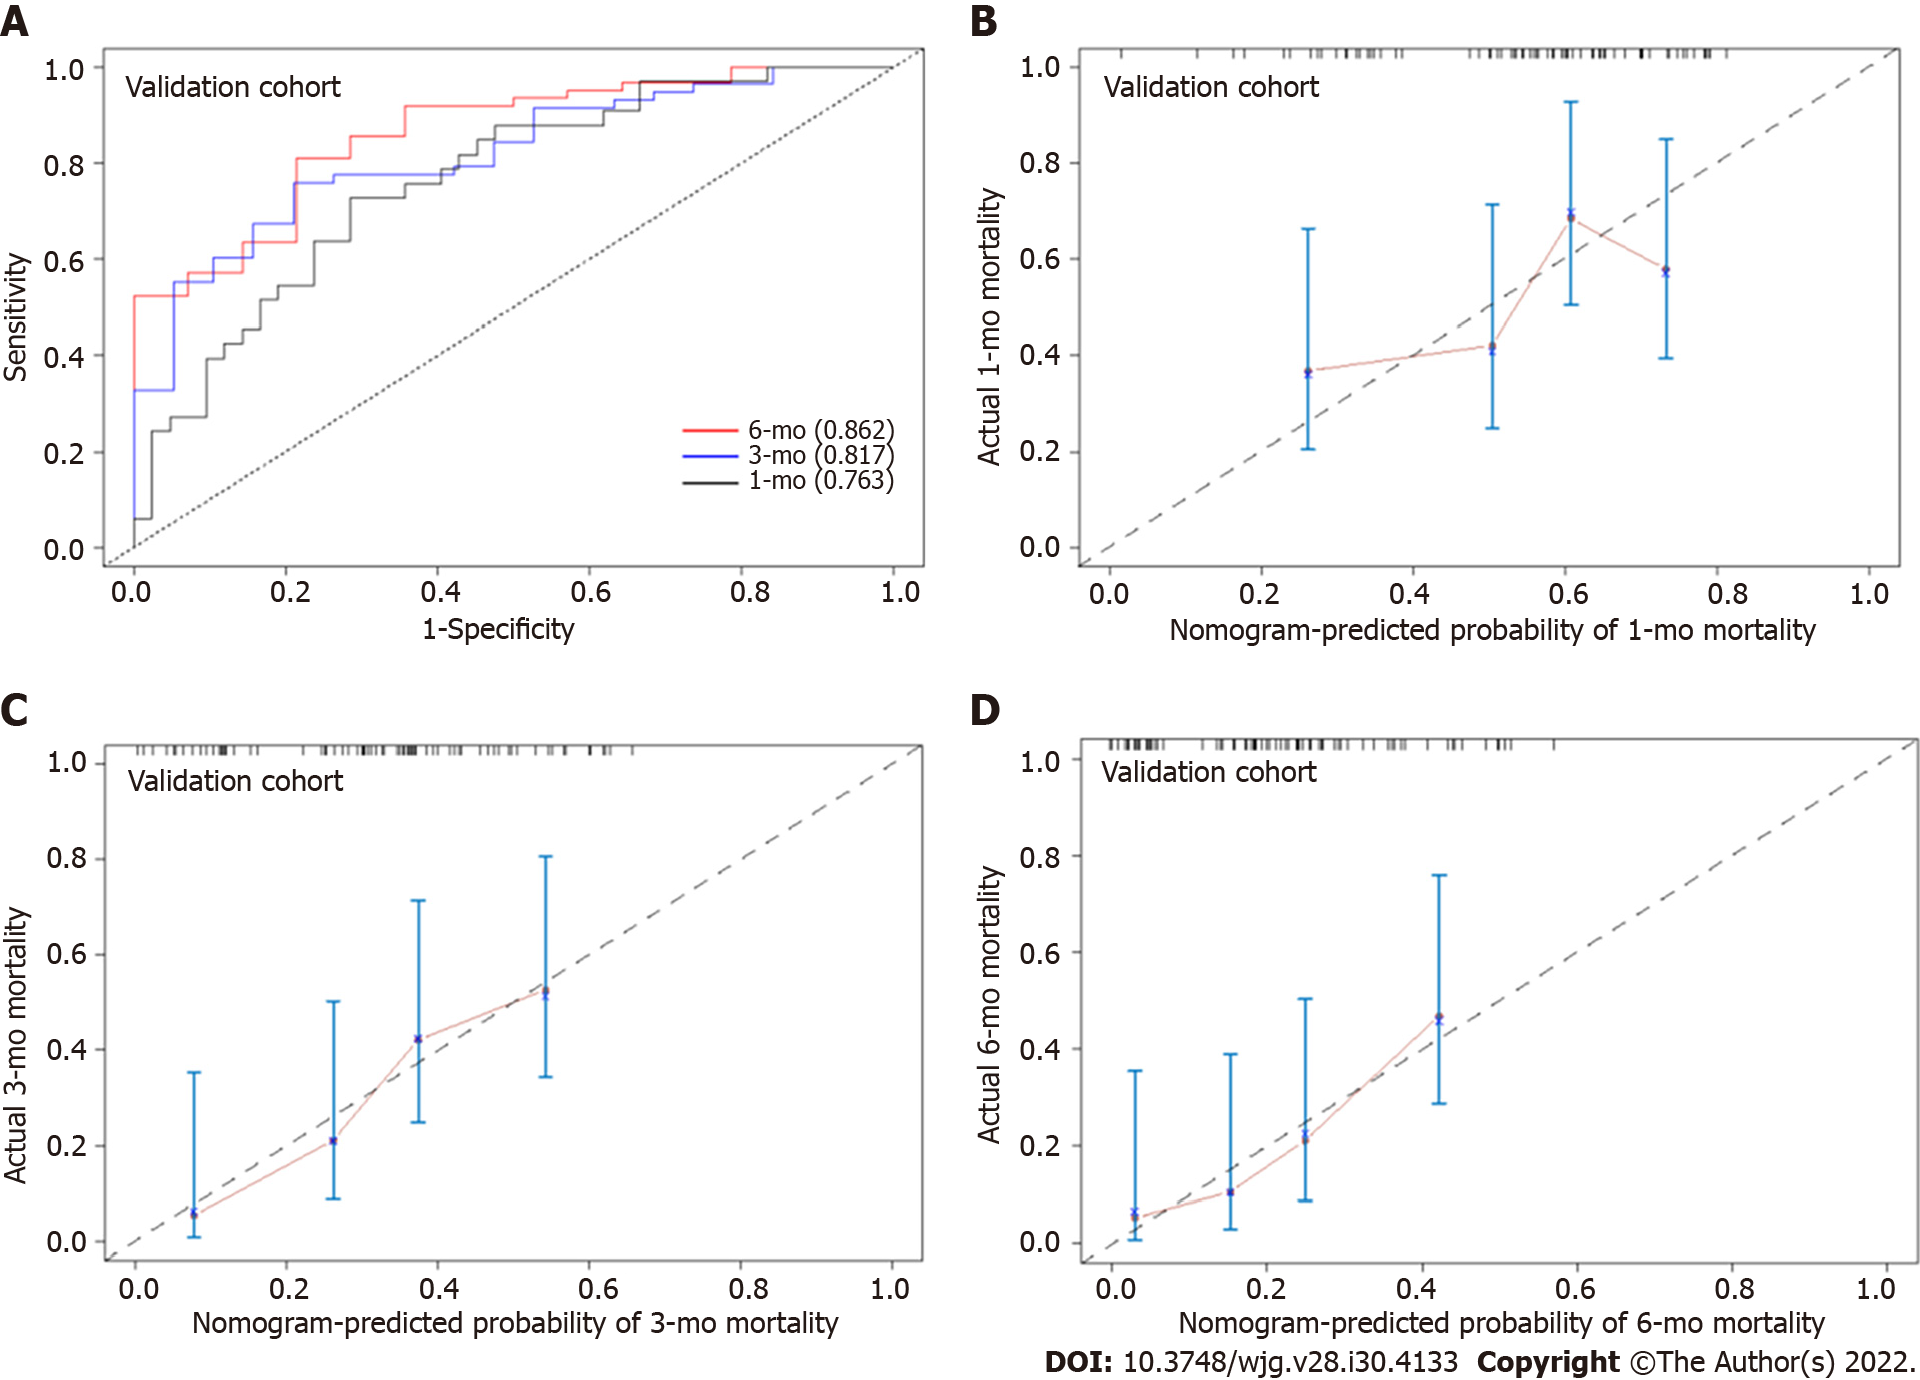
Figure 5 The area under the receiver operating characteristic curve and calibration curve of the nomogram for predicting the overall survival of cirrhotic patients with acute kidney injury in the validation cohort.
A: The area under the receiver operating characteristic curve of the nomogram for mortality at 30-, 90- and 180-d in the validation cohort; B: Calibration curve of the nomogram in predicting 30-d overall survival in the validation cohort; C: Calibration curve of the nomogram in predicting 90-d overall survival in the validation cohort; D: Calibration curve of the nomogram in predicting 180-d overall survival in the validation cohort.
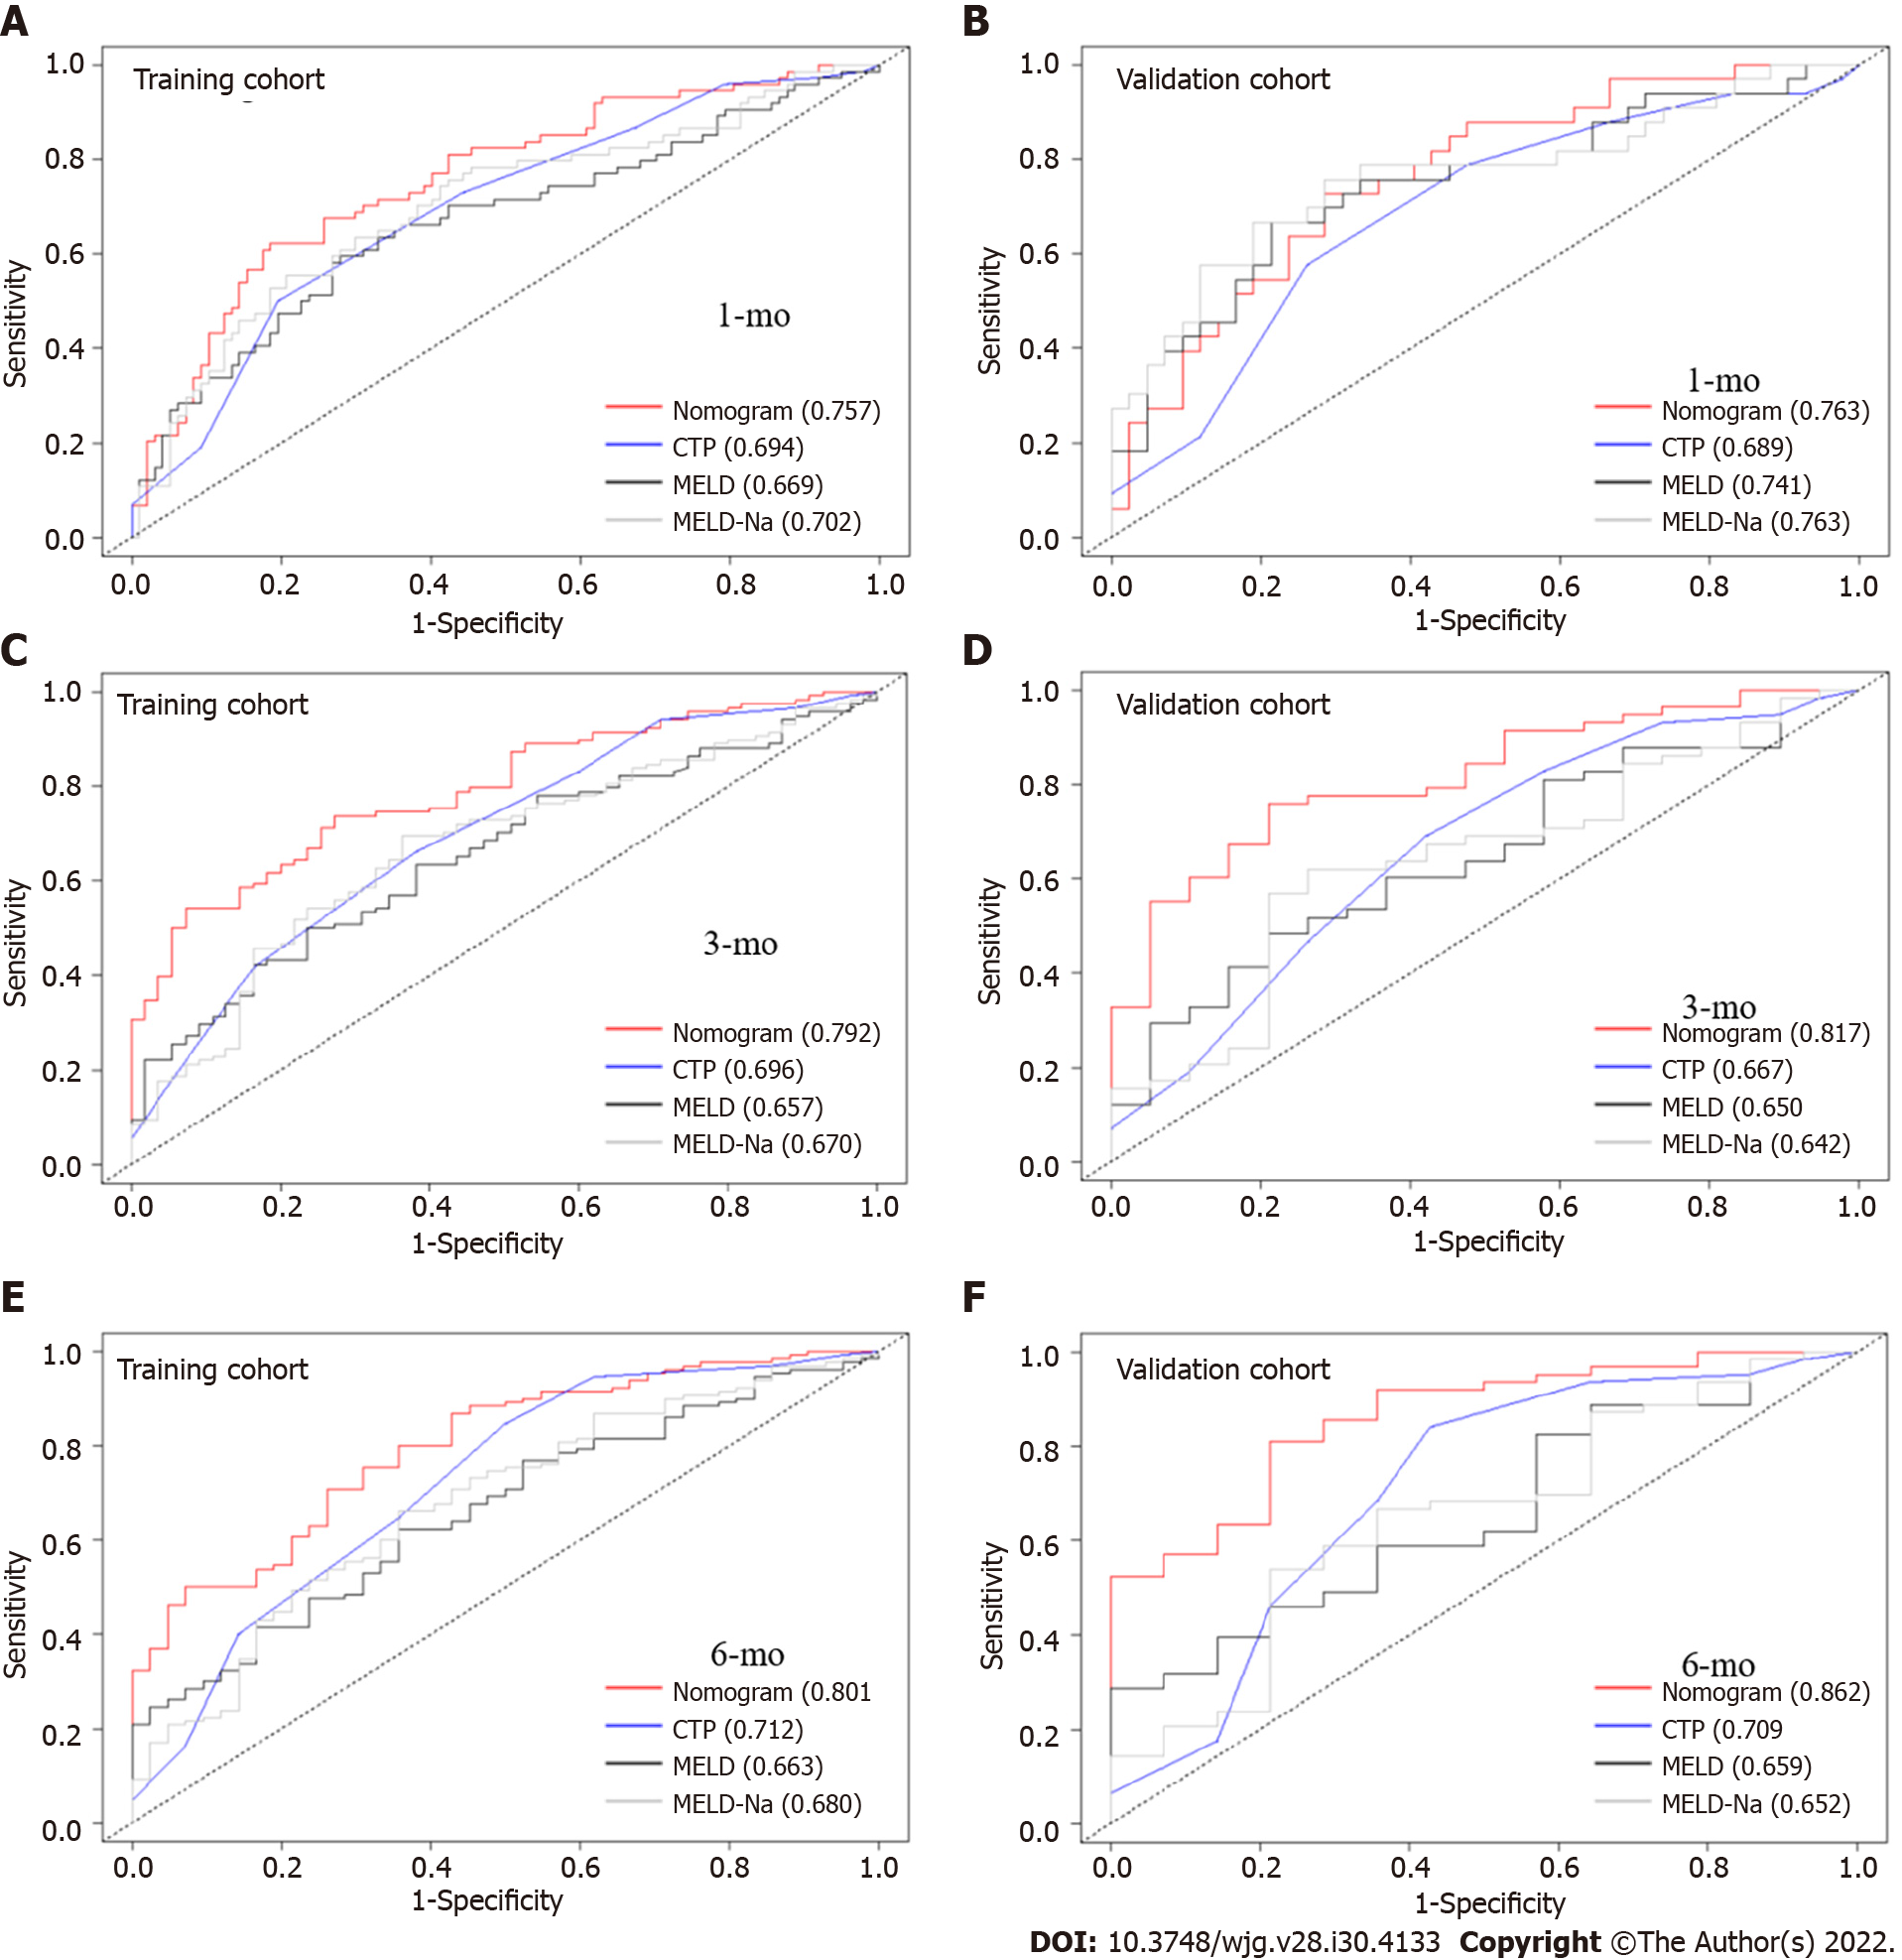
Figure 6 Comparison of the performance of the nomogram and the other scores in predicting mortality of cirrhotic patients with acute kidney injury.
A: The area under the receiver operating characteristic curve (AUROC) of the nomogram and the Child-Turcotte-Pugh (CTP), model for end-stage liver disease (MELD) and MELD-Na scores in predicting 30-d mortality in the training cohort; B: The AUROCs of the nomogram and the CTP, MELD and MELD-Na scores in predicting 30-d mortality in the validation cohort; C: The AUROCs of the nomogram and the CTP, MELD and MELD-Na scores in predicting 90-d mortality in the training cohort; D: The AUROCs of the nomogram and the CTP, MELD and MELD-Na scores in predicting 90-d mortality in the validation cohort; E: The AUROCs of the nomogram and the CTP, MELD and MELD-Na scores in predicting 180-d mortality in the training cohort; F: The AUROCs of the nomogram and the CTP, MELD and MELD-Na scores in predicting 180-d mortality in the validation cohort. CTP: Child-Turcotte-Pugh; MELD: Model for end-stage liver disease.
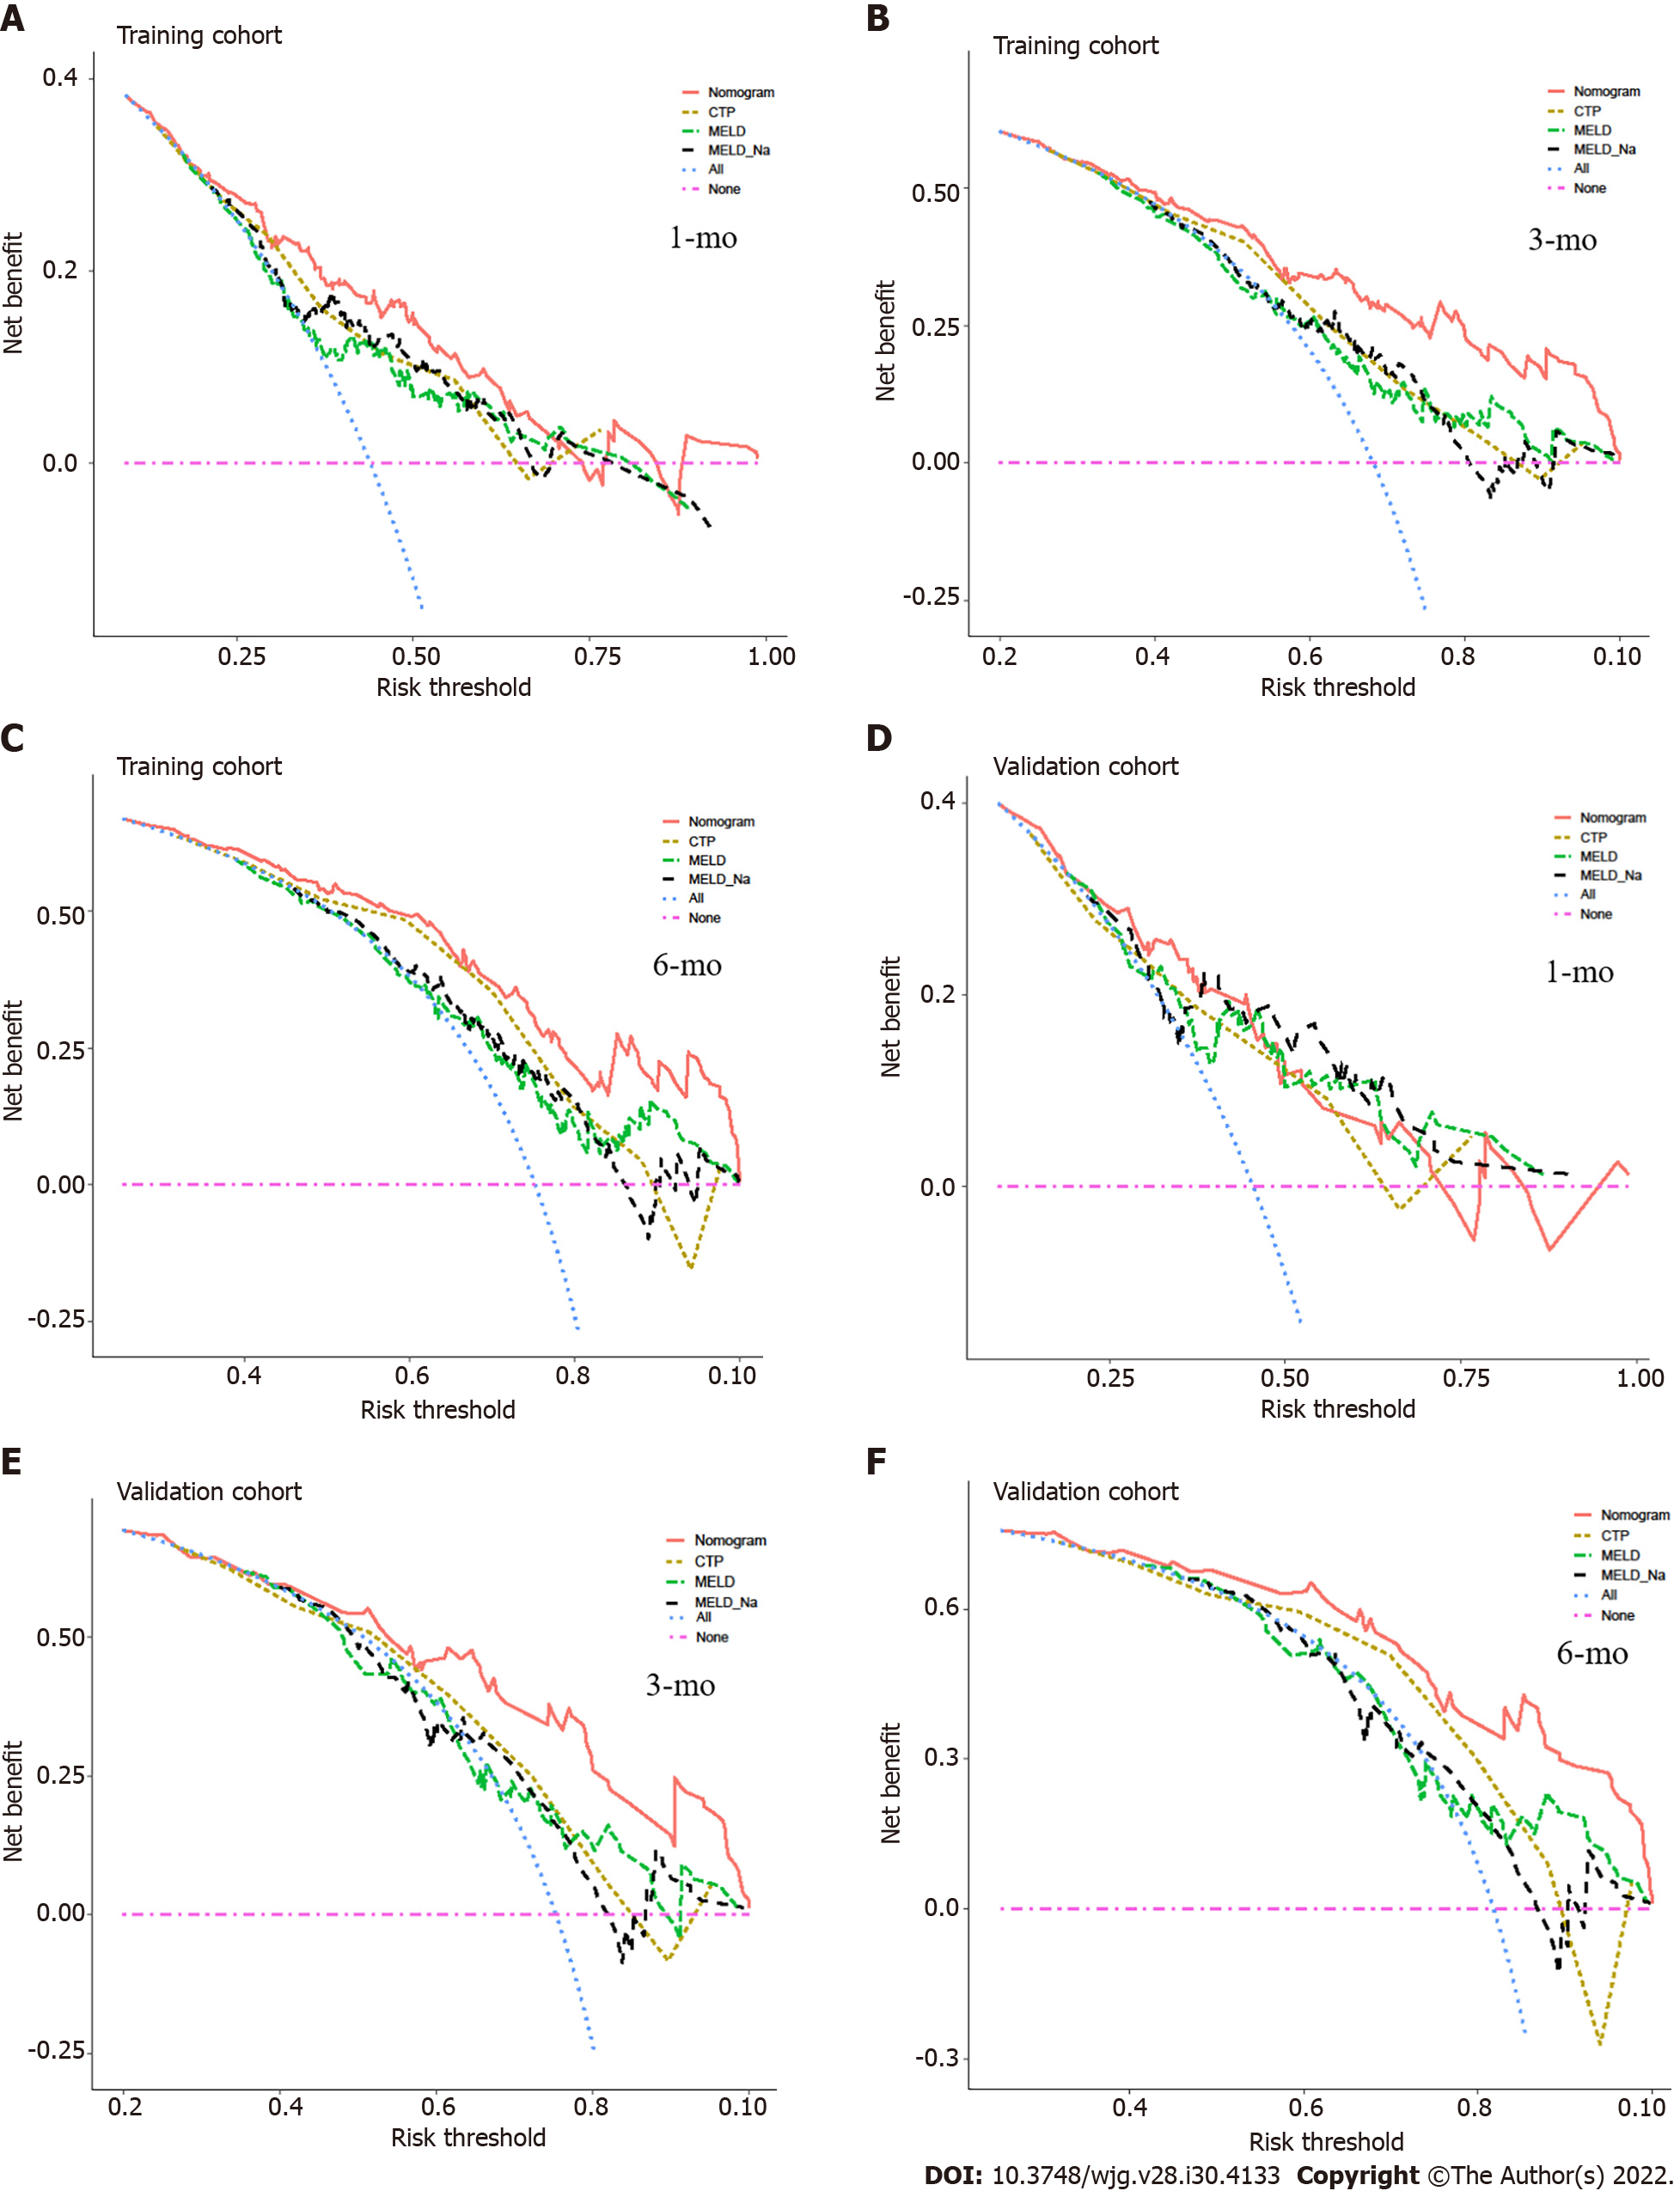
Figure 7 Comparison of the decision curve analysis curve of medical interventions in patients based on the nomogram and the other scores.
A: The decision curve analysis (DCA) curve of medical interventions in patients from the training cohort based on the nomogram, Child-Turcotte-Pugh (CTP), model for end-stage liver disease (MELD) and MELD-Na scores at 30 d; B: The DCA curve of medical interventions in patients from the training cohort based on the nomogram, CTP, MELD and MELD-Na scores at 90 d; C: The DCA curve of medical interventions in patients from the training cohort based on the nomogram, CTP, MELD and MELD-Na scores at 180 d; D: The DCA curve of medical interventions in patients from the validation cohort based on the nomogram, CTP, MELD and MELD-Na scores at 30 d; E: The DCA curve of medical interventions in patients from the validation cohort based on the nomogram, CTP, MELD and MELD-Na scores at 90 d; F: The DCA curve of medical intervention in patients from the validation cohort based on the nomogram, CTP, MELD and MELD-Na scores at 180 d. CTP: Child-Turcotte-Pugh; MELD: Model for end-stage liver disease.
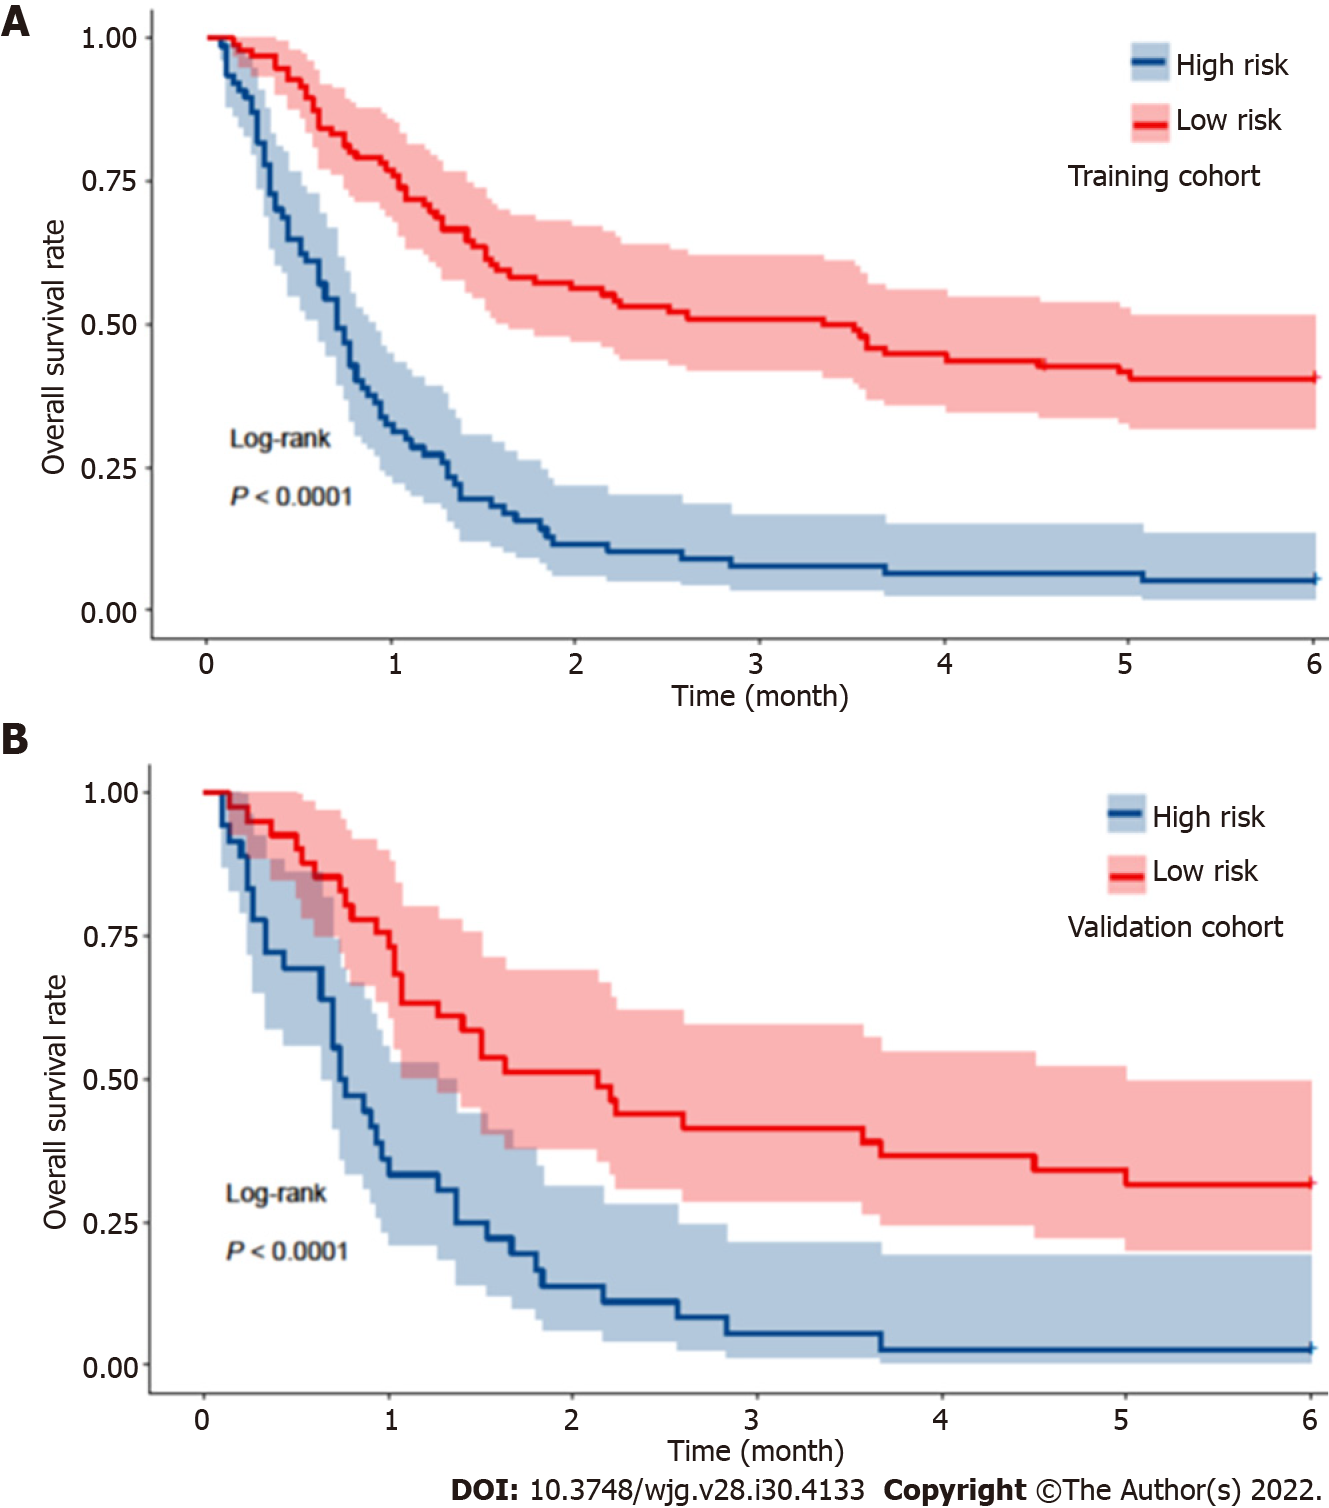
Figure 8 Kaplan–Meier analysis of the cirrhotic patients with acute kidney injury stratified into high-risk and low-risk mortality groups according to the nomogram score, with cutoff of 98.
A: Overall survival rates were compared between patients with a high and low risk of mortality in the training cohort; B: Overall survival rates were compared between patients with a high and low risk of mortality in the validation cohort.
- Citation: Wan YP, Wang AJ, Zhang W, Zhang H, Peng GH, Zhu X. Development and validation of a nomogram for predicting overall survival in cirrhotic patients with acute kidney injury. World J Gastroenterol 2022; 28(30): 4133-4151
- URL: https://www.wjgnet.com/1007-9327/full/v28/i30/4133.htm
- DOI: https://dx.doi.org/10.3748/wjg.v28.i30.4133


