Copyright
©The Author(s) 2022.
World J Gastroenterol. Jul 28, 2022; 28(28): 3706-3719
Published online Jul 28, 2022. doi: 10.3748/wjg.v28.i28.3706
Published online Jul 28, 2022. doi: 10.3748/wjg.v28.i28.3706
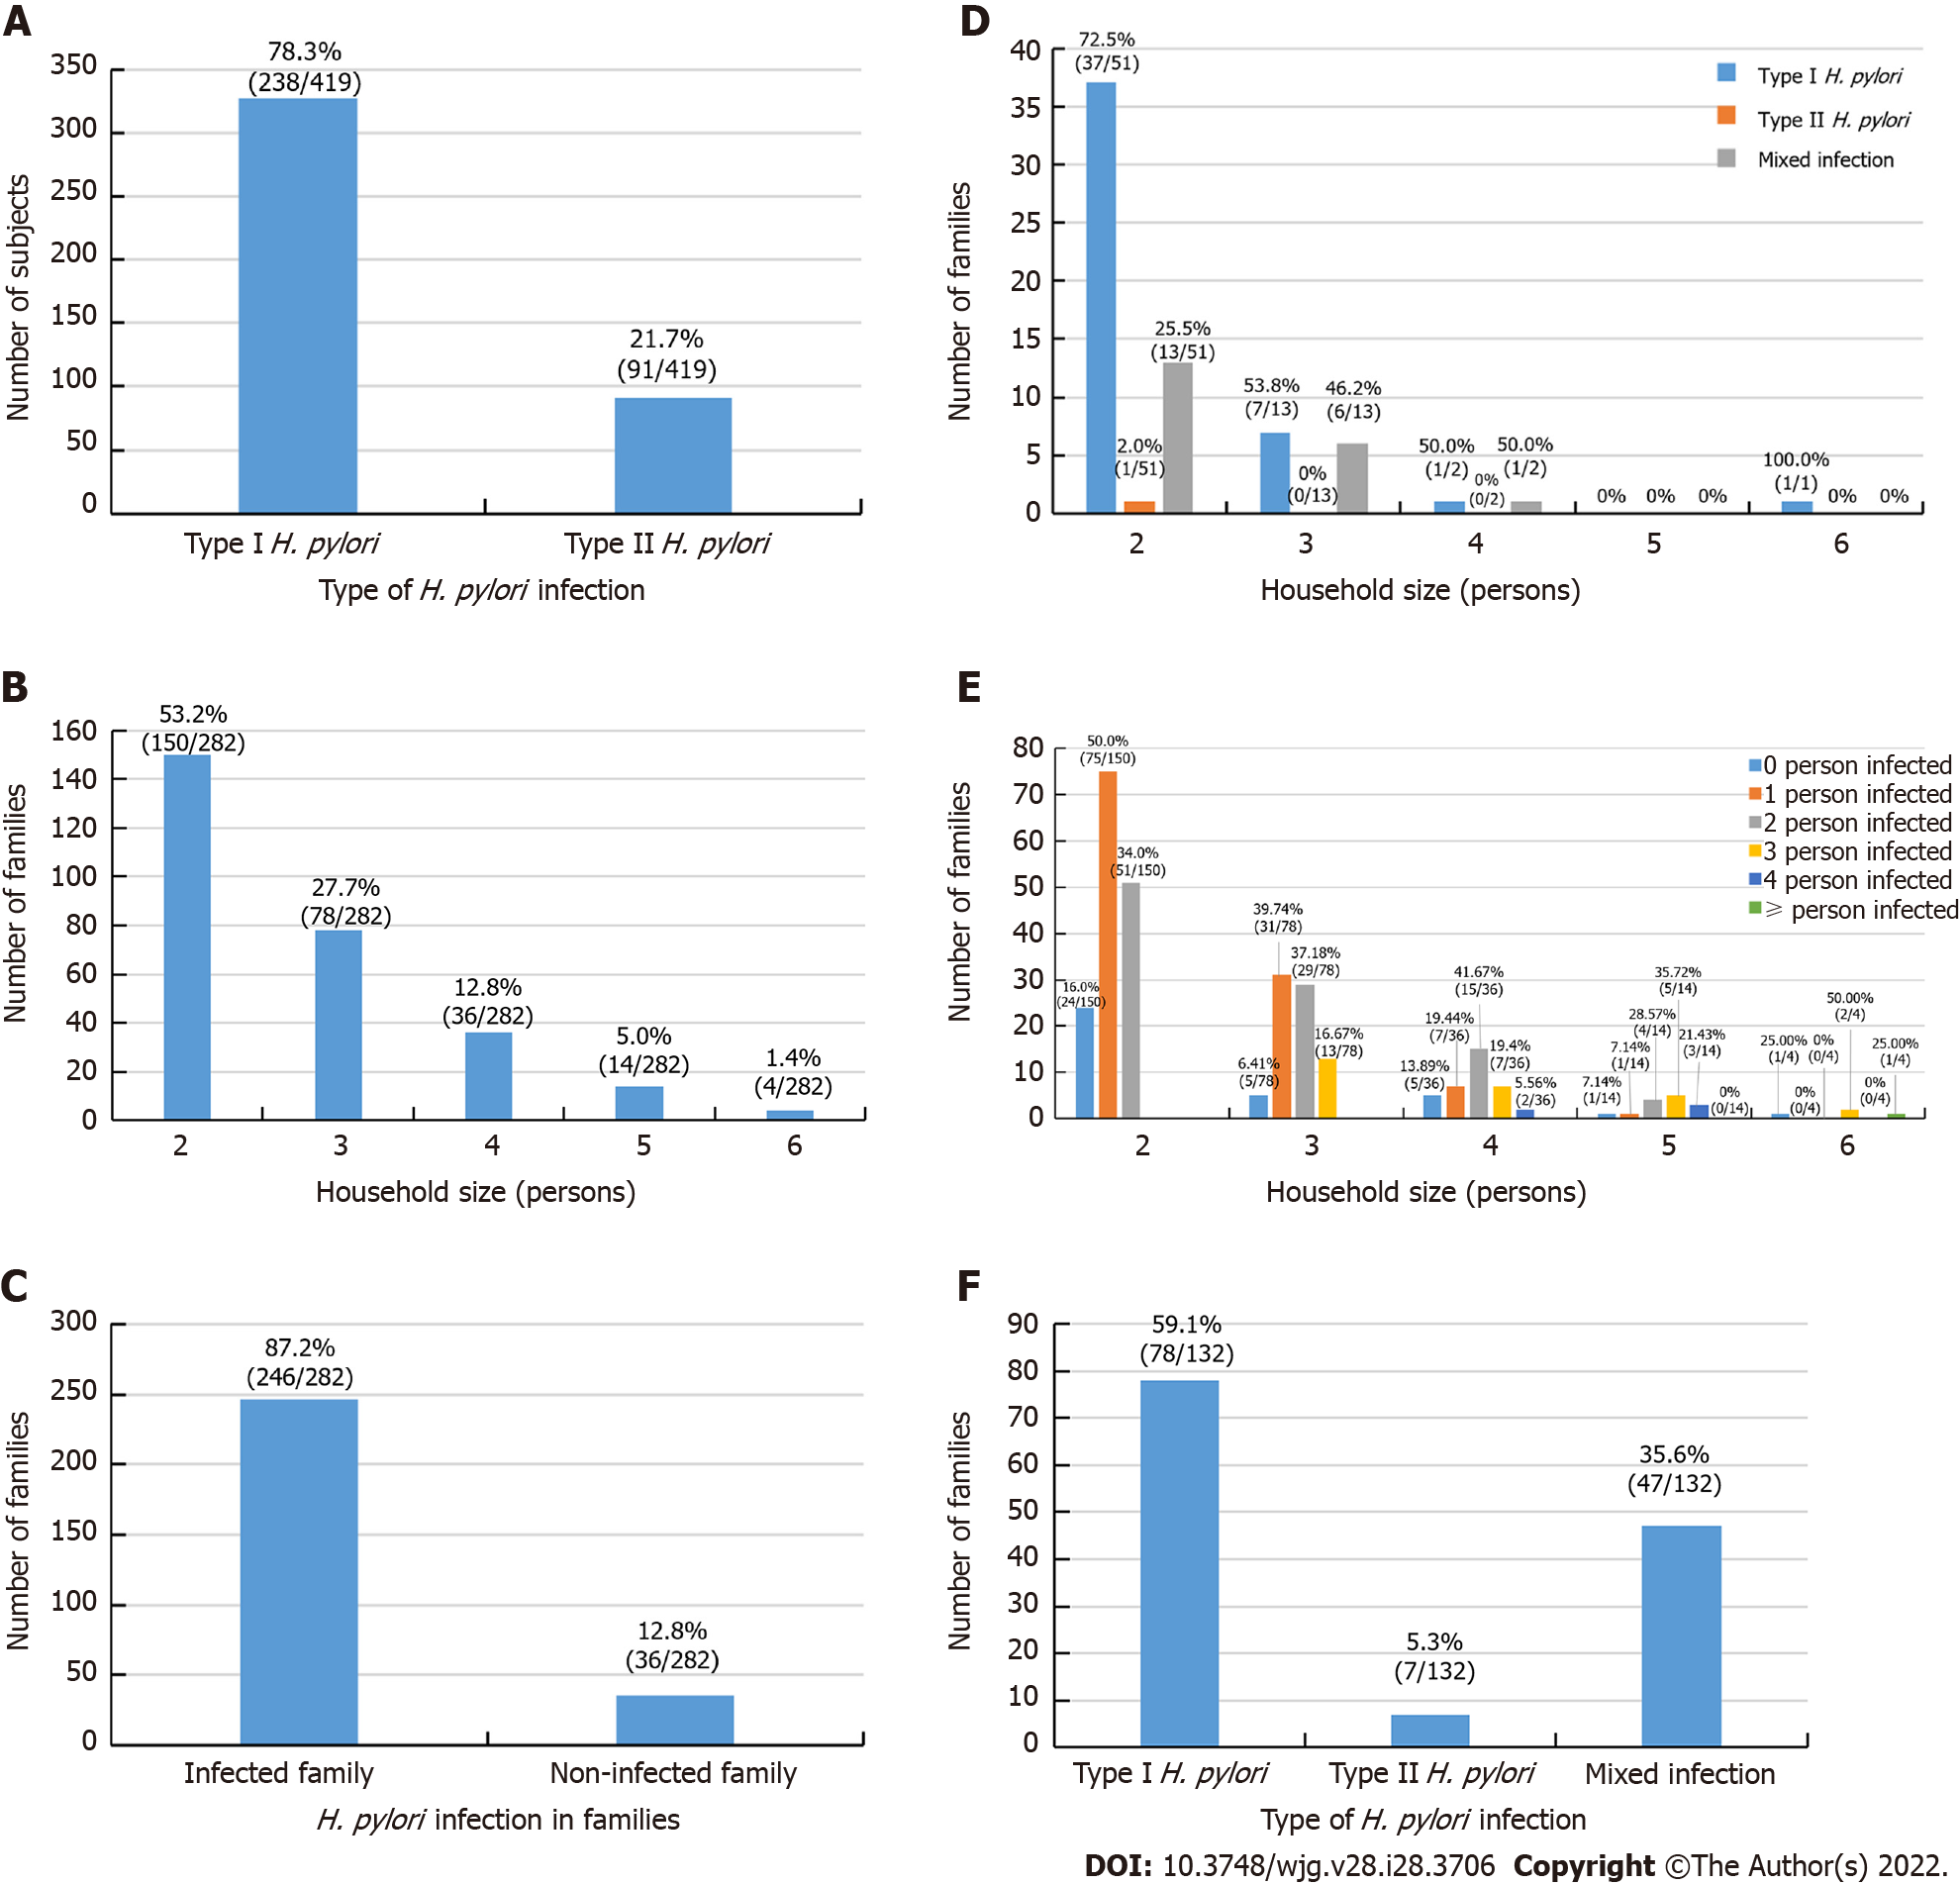
Figure 1 Helicobacter pylori infection status of the 282 enrolled families.
Values above each column are the case number and percentages of each group. A: Genotype pattern of the 419 infected subjects in the enrolled families; B: Distribution pattern of the 282 enrolled families ranged from 2-6 people; C: General Helicobacter pylori (H. pylori) infection status of 282 families; D: Genotype pattern of the 67 all member-infected families from the enrolled 282 families; E: Distribution pattern of the H. pylori infection status of the 282 enrolled families; F: Genotype pattern of the 132 H. pylori-infected families with ≥ 2 persons infected from the 282 enrolled families. Infected family: At least 1 person in a family was infected; Non-infected family: All members in a family were not infected; Type I H. pylori: H. pylori infection with type I strains; Type II H. pylori: H. pylori infection with type II strains; Mixed infection: H. pylori infection with type I and type II strains.
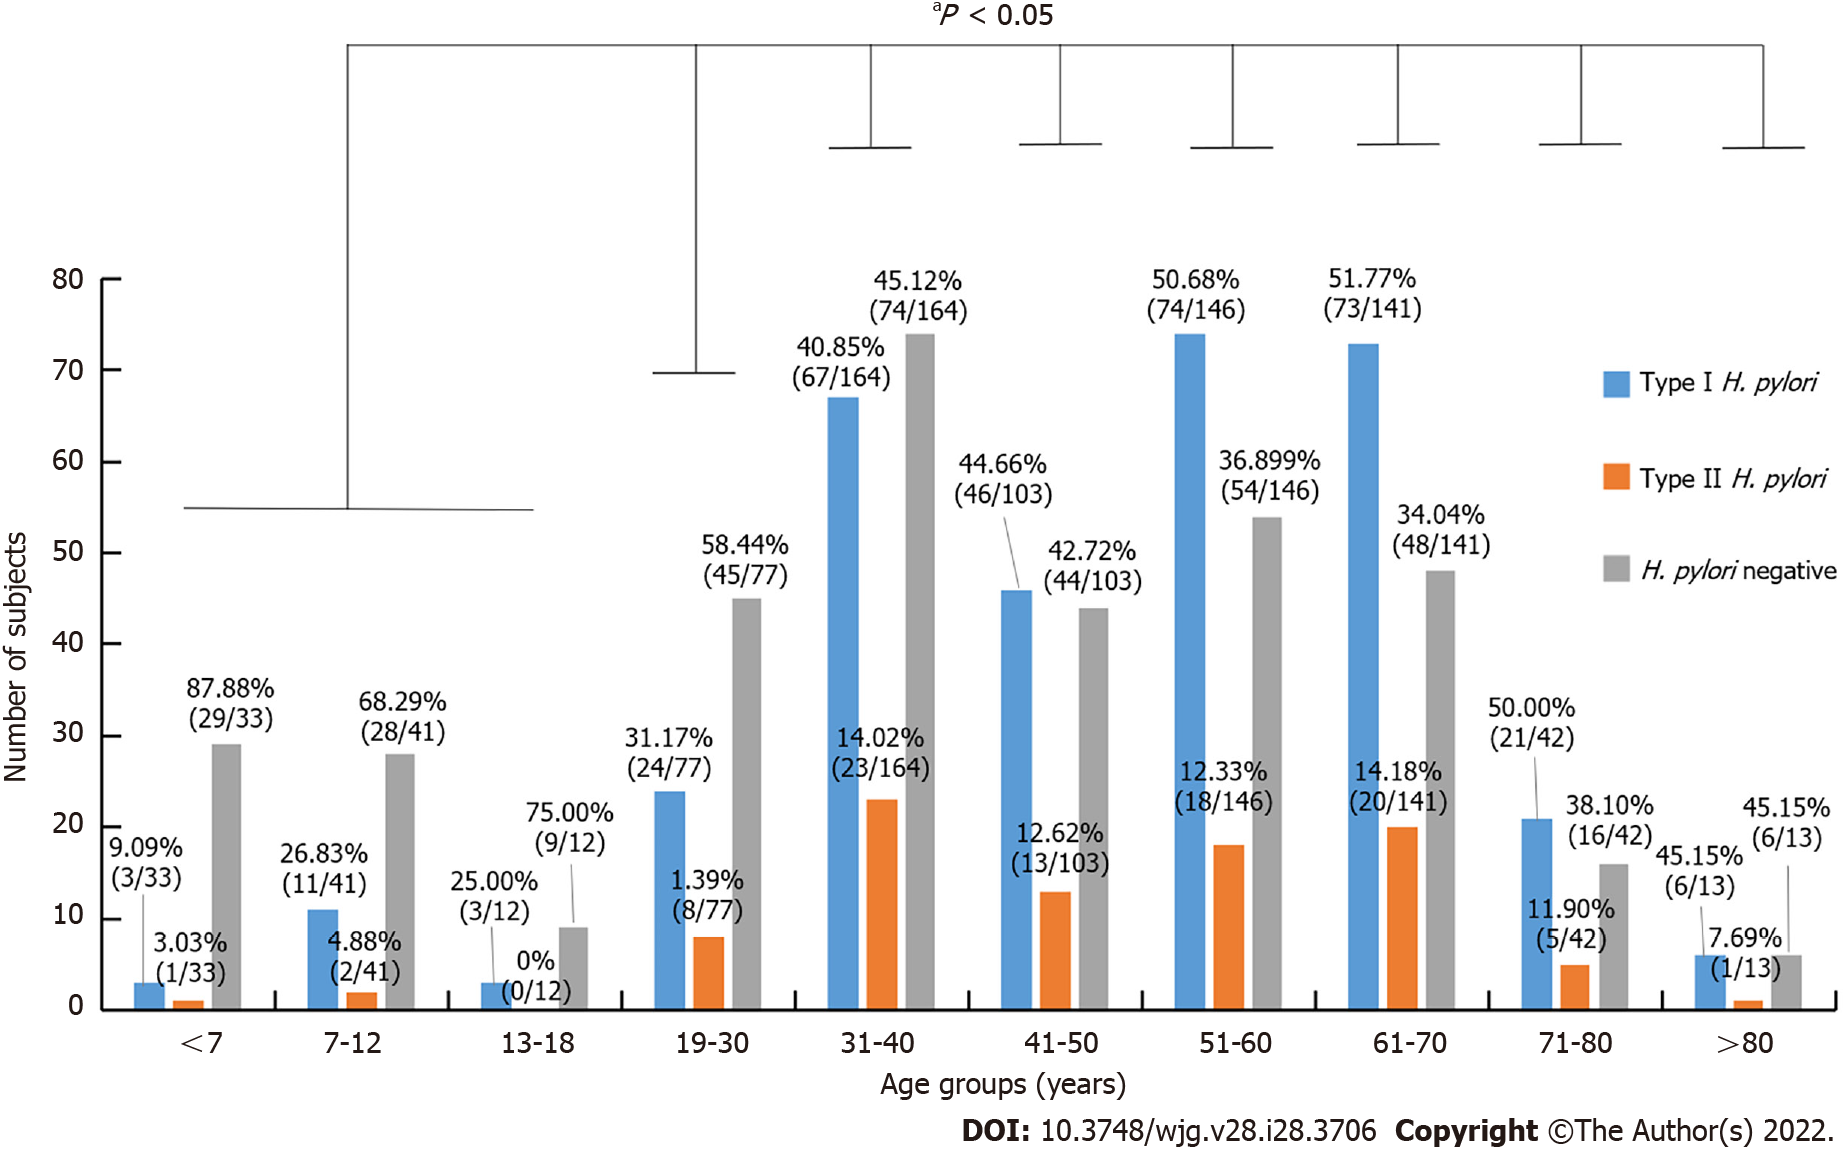
Figure 2 Helicobacter pylori infection status of 772 subjects in different age groups.
Values above each column are the case number and its percentages in each specific age group. aP < 0.05 when Helicobacter pylori (H. pylori) infection rate in the age group of ≤ 18 yr was compared with other age groups. Type I H. pylori: H. pylori infection with type I strains; Type II H. pylori: H. pylori infection with type II strains.
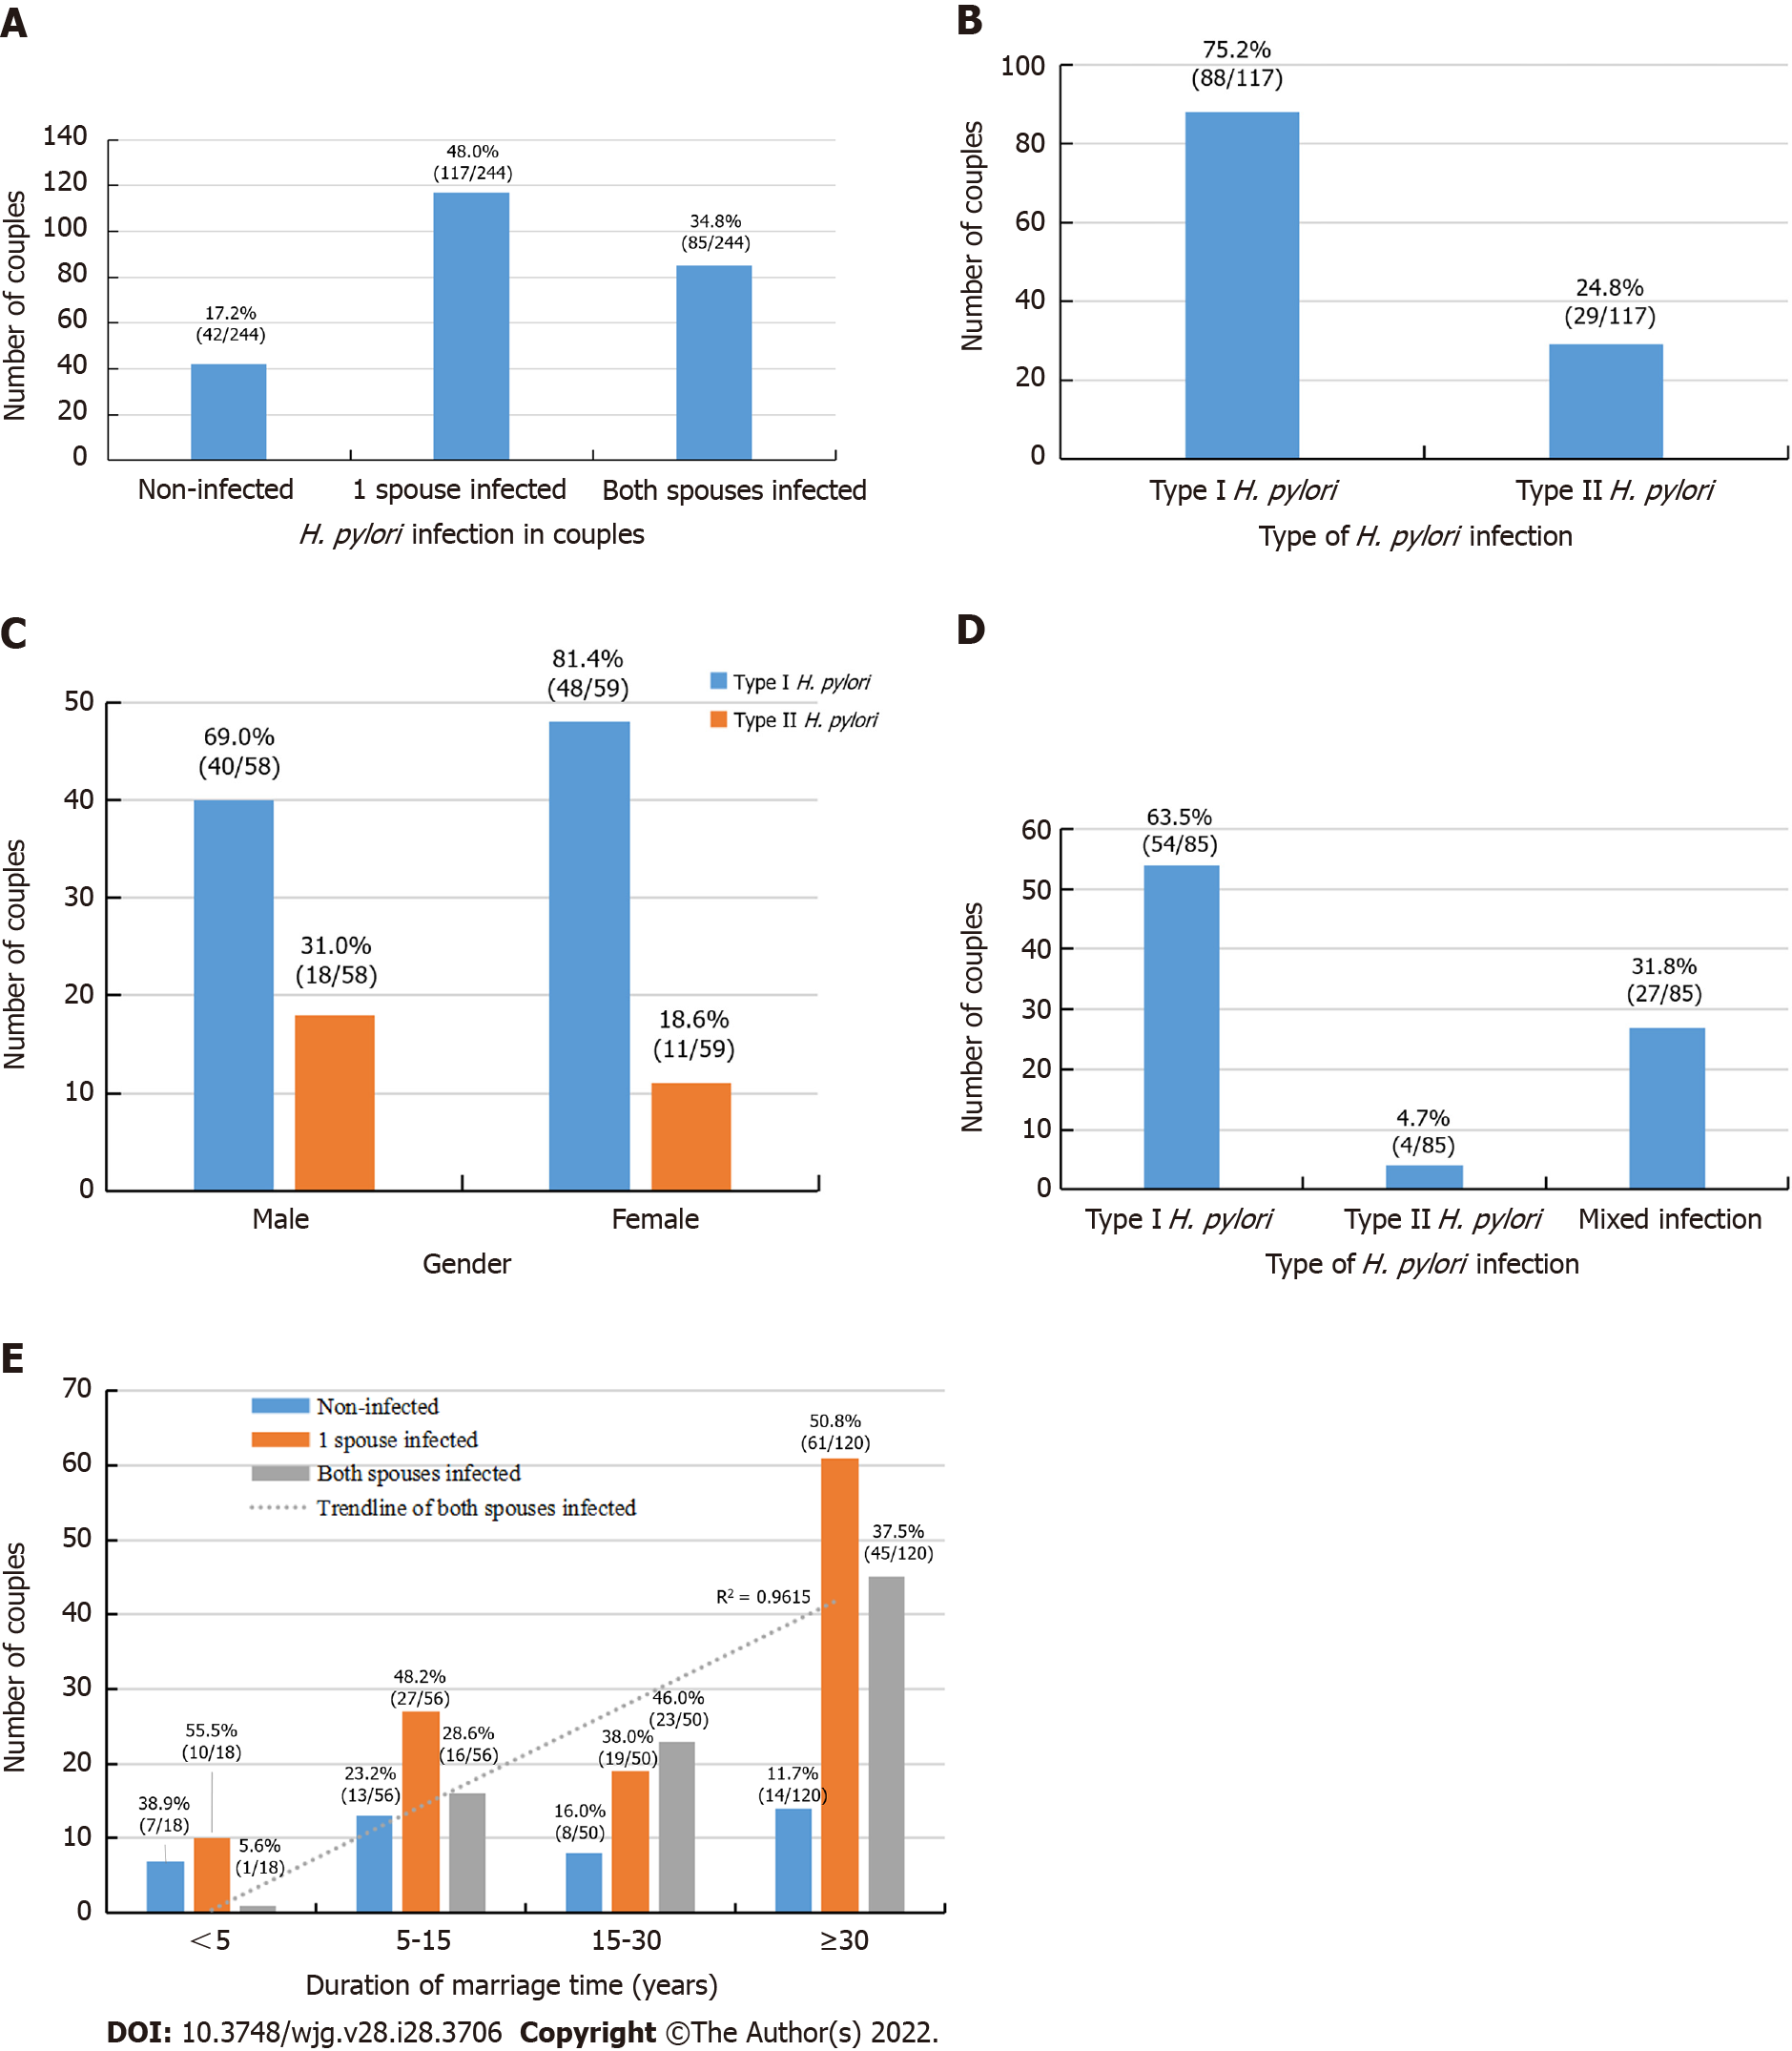
Figure 3 Helicobacter pylori infection status between 244 couples.
Values above each column are the case number and percentages of each group. A: Helicobacter pylori (H. pylori) infection status of 244 couples; B: Type I and II H. pylori genotype status of the 117 couples with 1 spouse infected; C: H. pylori genotype and sex of 117 couples with 1 spouse infected; D: H. pylori genotype status in 85 couples with both spouses infected; E: Relationship between infection and marriage duration in 244 couples. The dashed line across the figure is the trendline of both spouses infected, r = 0.98. Non-infected: All members in a couple were not infected; one spouse infected: Only 1 in a couple was infected; Type I H. pylori: H. pylori infection with type I strains; Type II H. pylori: H. pylori infection with type II strains; Mixed infection: H. pylori infection with type I and type II strains.
- Citation: Yu XC, Shao QQ, Ma J, Yu M, Zhang C, Lei L, Zhou Y, Chen WC, Zhang W, Fang XH, Zhu YZ, Wu G, Wang XM, Han SY, Sun PC, Ding SZ. Family-based Helicobacter pylori infection status and transmission pattern in central China, and its clinical implications for related disease prevention. World J Gastroenterol 2022; 28(28): 3706-3719
- URL: https://www.wjgnet.com/1007-9327/full/v28/i28/3706.htm
- DOI: https://dx.doi.org/10.3748/wjg.v28.i28.3706


