Copyright
©The Author(s) 2022.
World J Gastroenterol. Jul 21, 2022; 28(27): 3422-3434
Published online Jul 21, 2022. doi: 10.3748/wjg.v28.i27.3422
Published online Jul 21, 2022. doi: 10.3748/wjg.v28.i27.3422
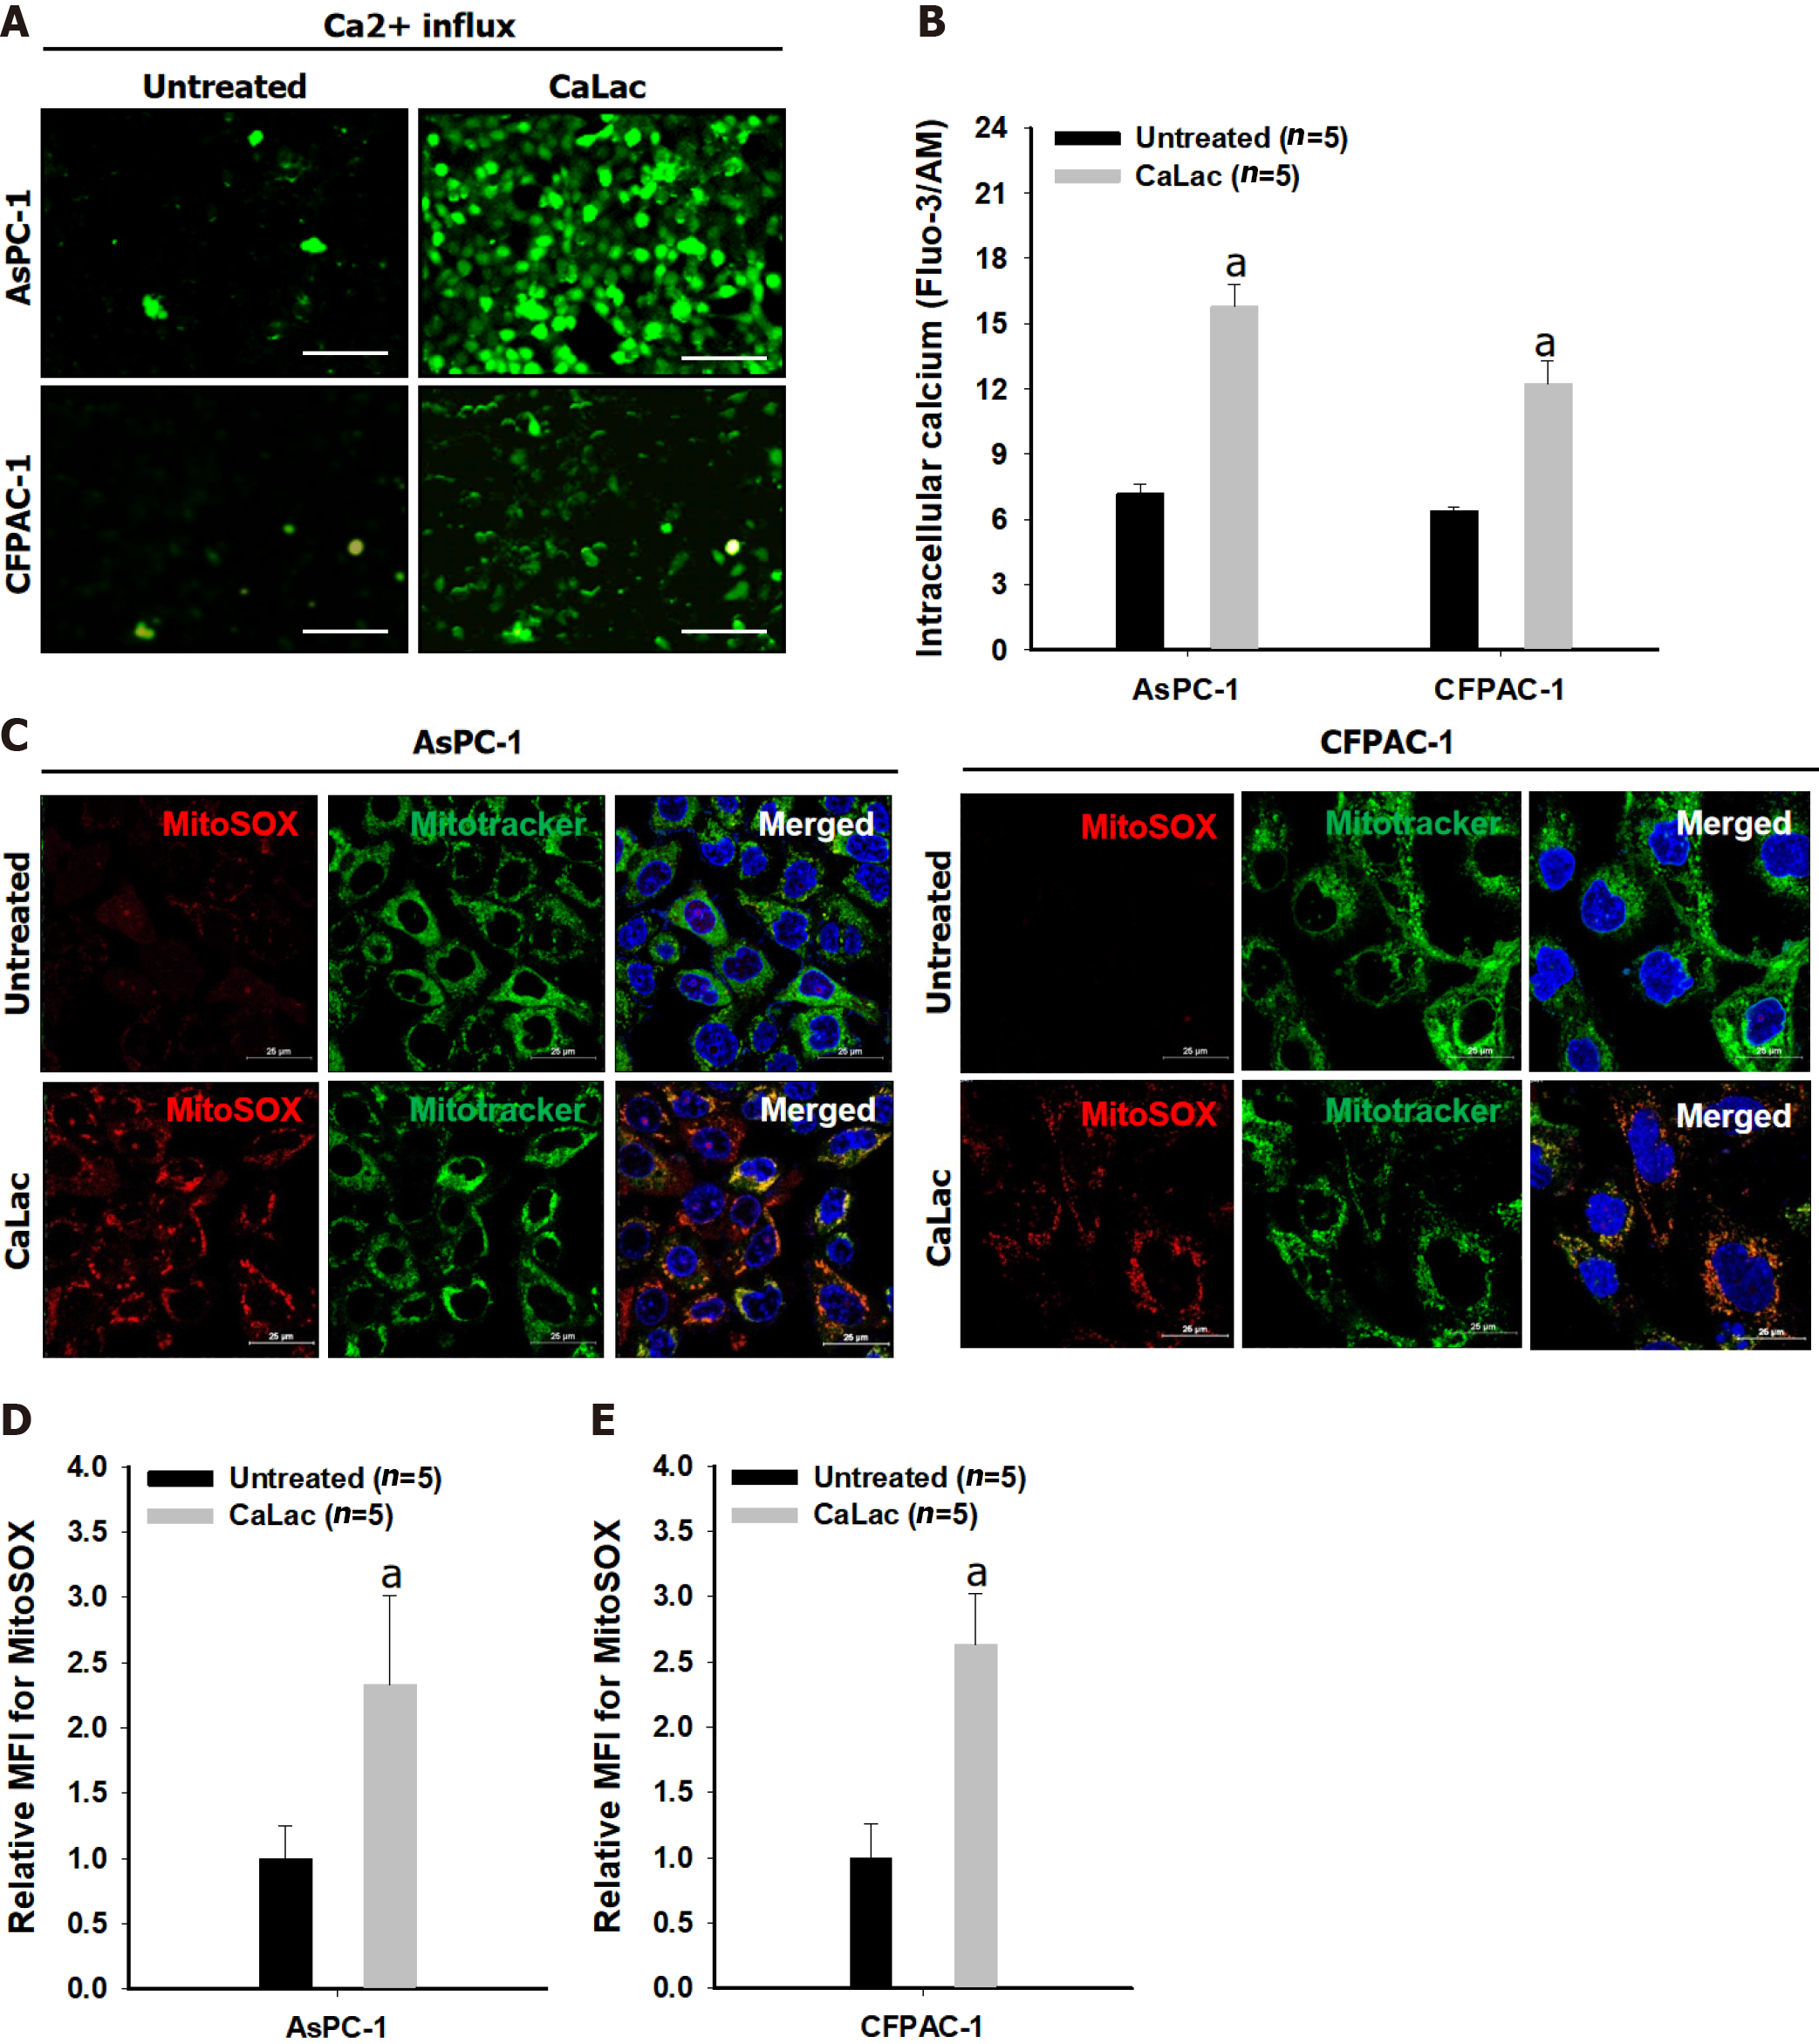
Figure 1 Confirmation of mitochondrial reactive oxygen species generation by sustained calcium supply.
A: Fluorescent calcium imaging following lactate calcium salt (CaLac) treatment of pancreatic cancer cells (AsPC-1 and CFPAC-1). Scale bars: 100 μm; B: Quantitative analysis of the fluorescence intensity of calcium; C: Confocal imaging of mitochondrial reactive oxygen species (ROS) in pancreatic cancer cells. Red dye: Mitochondrial superoxide indicator; Green dye: Mitochondrial indicator. Scale bars: 25 μm; D: Quantitative analysis of the fluorescence intensity of mitochondrial ROS in AsPC-1; E: Quantitative analysis of the fluorescence intensity of mitochondrial ROS in CFPAC-1. The fluorescence intensity was calculated by the mean fluorescence intensity. The cells were treated with 2.5 mM CaLac for 72 h. Results represent the mean ± SD. aP < 0.001 vs untreated. CaLac: Lactate calcium salt; MitoSOX: Mitochondrial superoxide indicator.
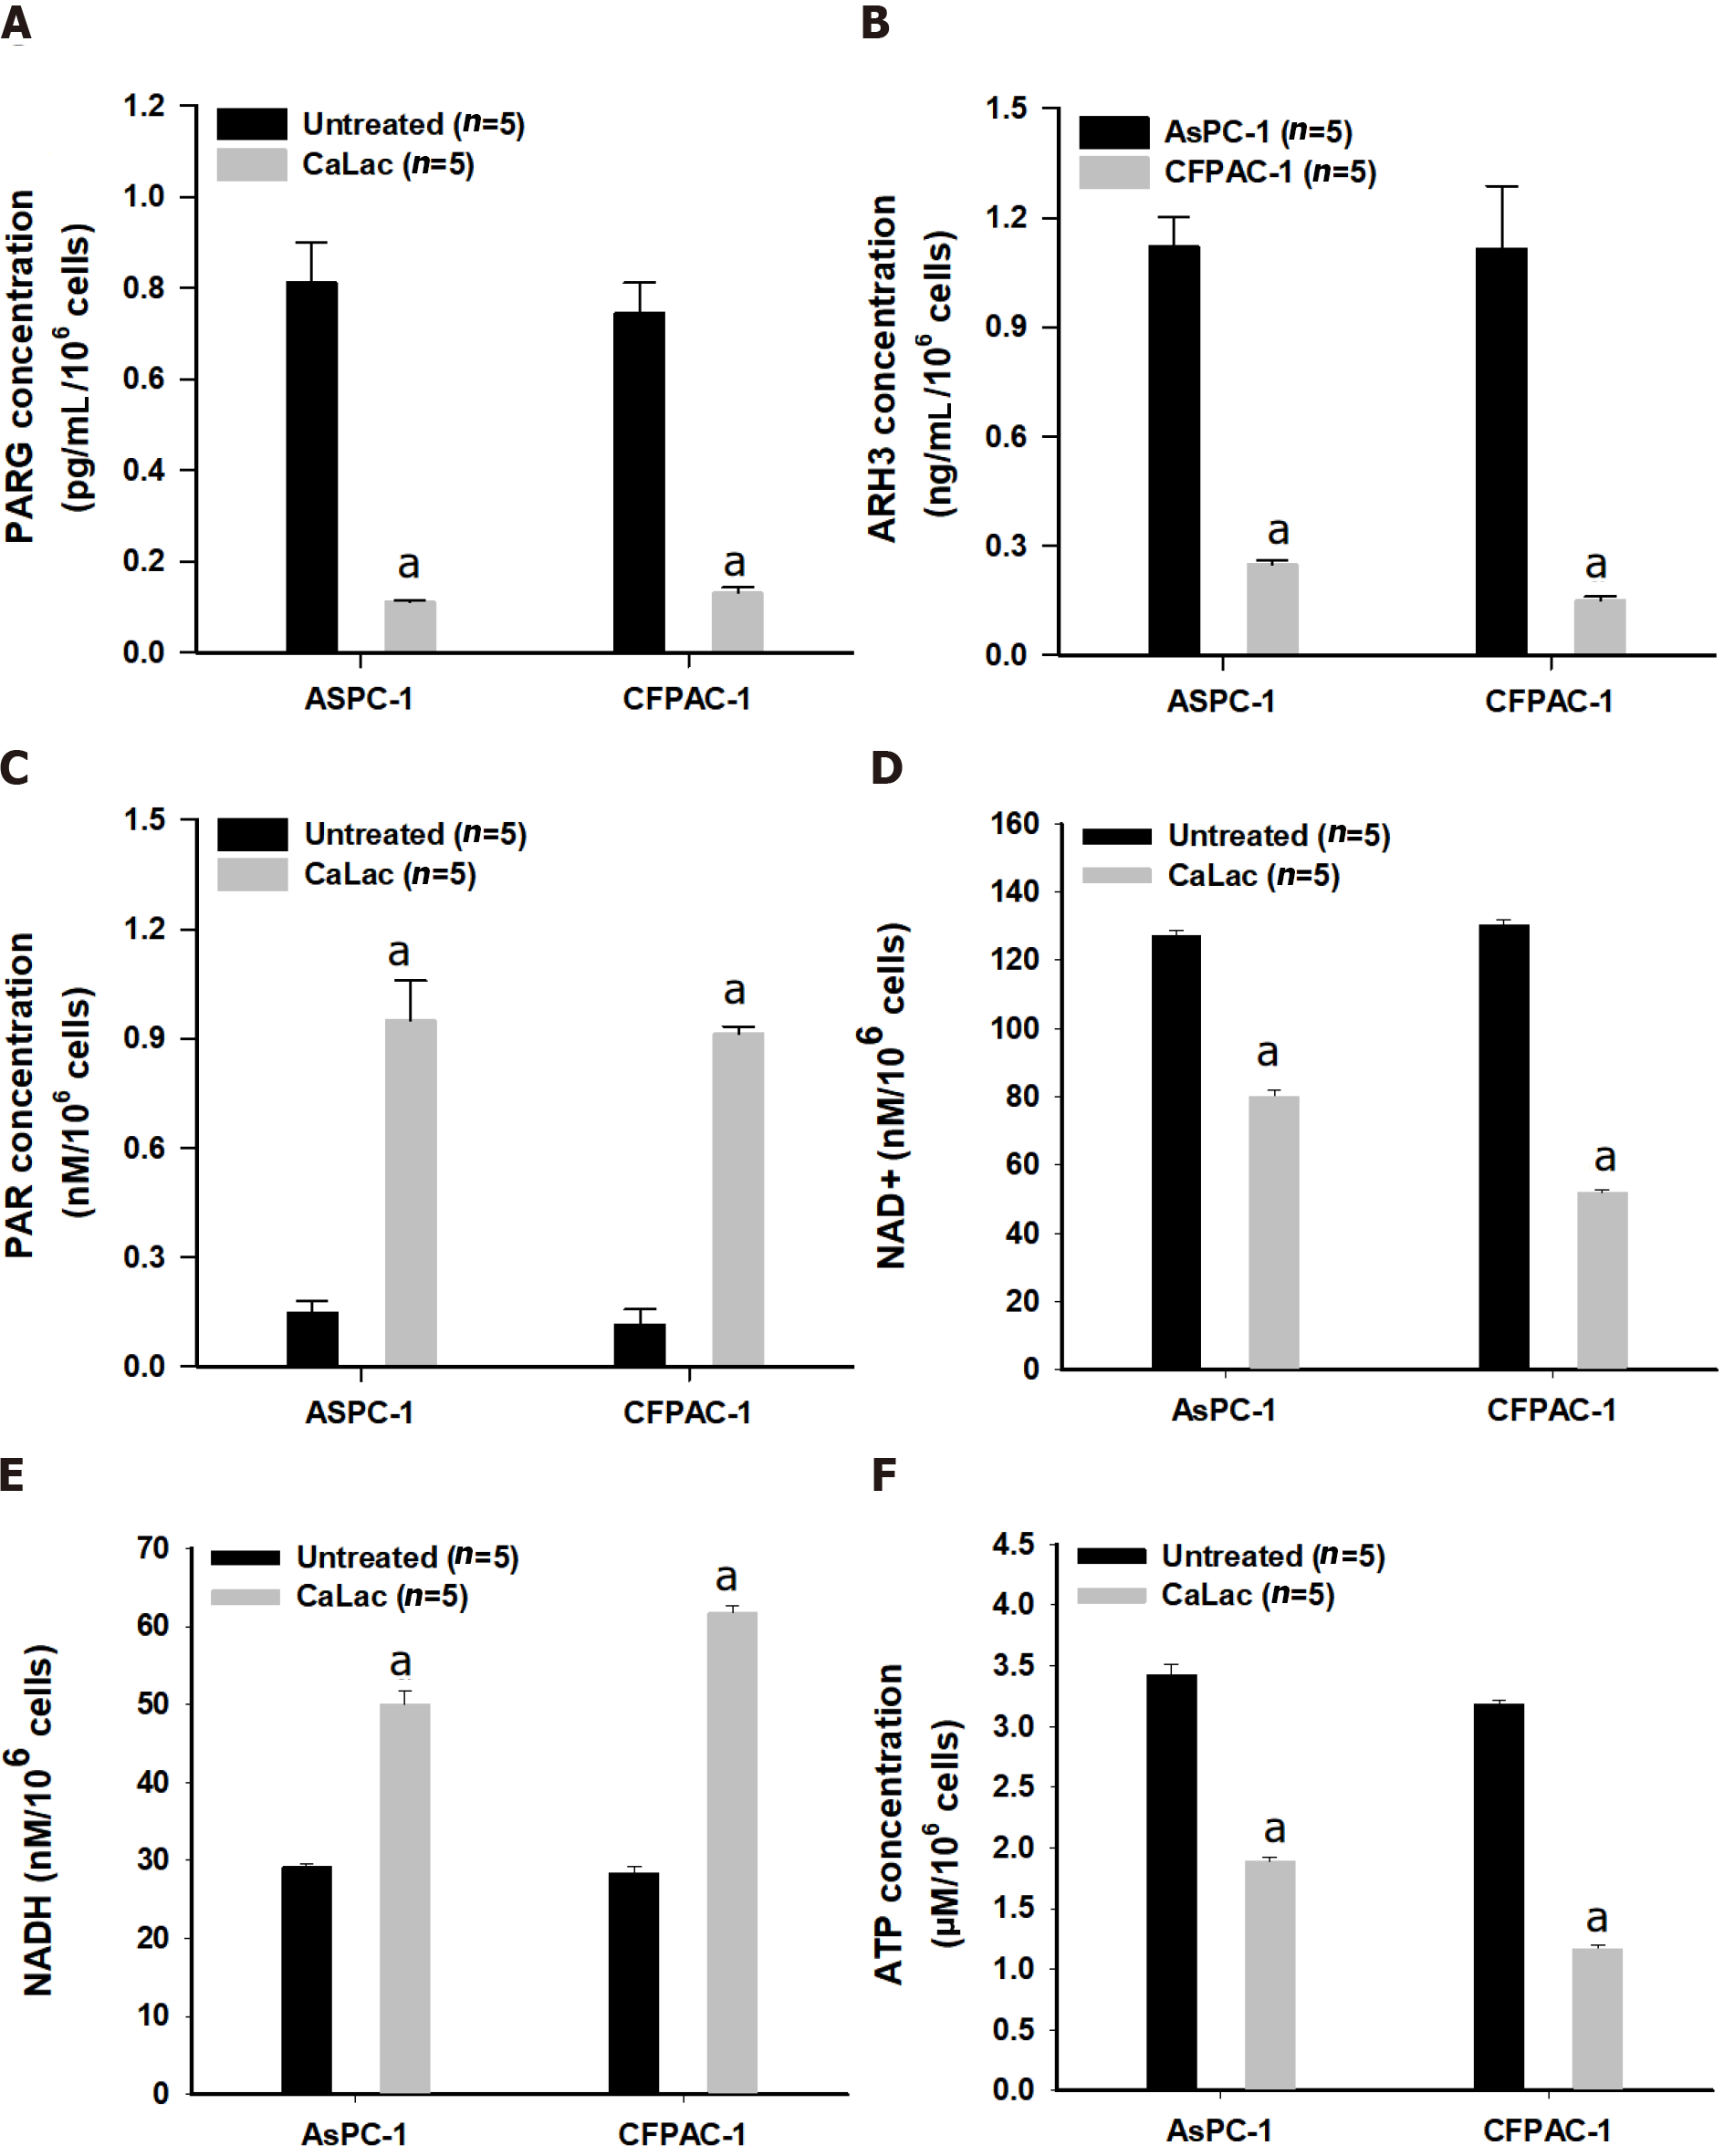
Figure 2 Confirmation of enzyme change and poly adenosine diphosphate-ribose accumulation by calcium supply resulting in energy crisis.
A: Quantitative analysis of the enzyme levels of poly adenosine diphosphate (ADP)-ribose (PAR) glycohydrolase in pancreatic cancer cells (AsPC-1 and CFPAC-1); B: Quantitative analysis of the enzyme levels of ADP-ribosyl hydrolase 3 in AsPC-1 and CFPAC-1; C: Quantitative analysis of PAR levels; D: Quantitative analysis of nicotinamide adenine dinucleotide levels; E: Quantitative analysis of NADH levels; F: Quantitative analysis of adenosine triphosphate (ATP) levels. The cells were treated with 2.5 mM lactate calcium salt for 72 h. Results represent the mean ± SD. aP < 0.001 vs untreated. CaLac: Lactate calcium salt; PARG: Poly adenosine diphosphate-ribose glycohydrolase; ARH3: Adenosine diphosphate-ribosyl hydrolase 3; NAD+: Nicotinamide adenine dinucleotide; ATP: Adenosine triphosphate.
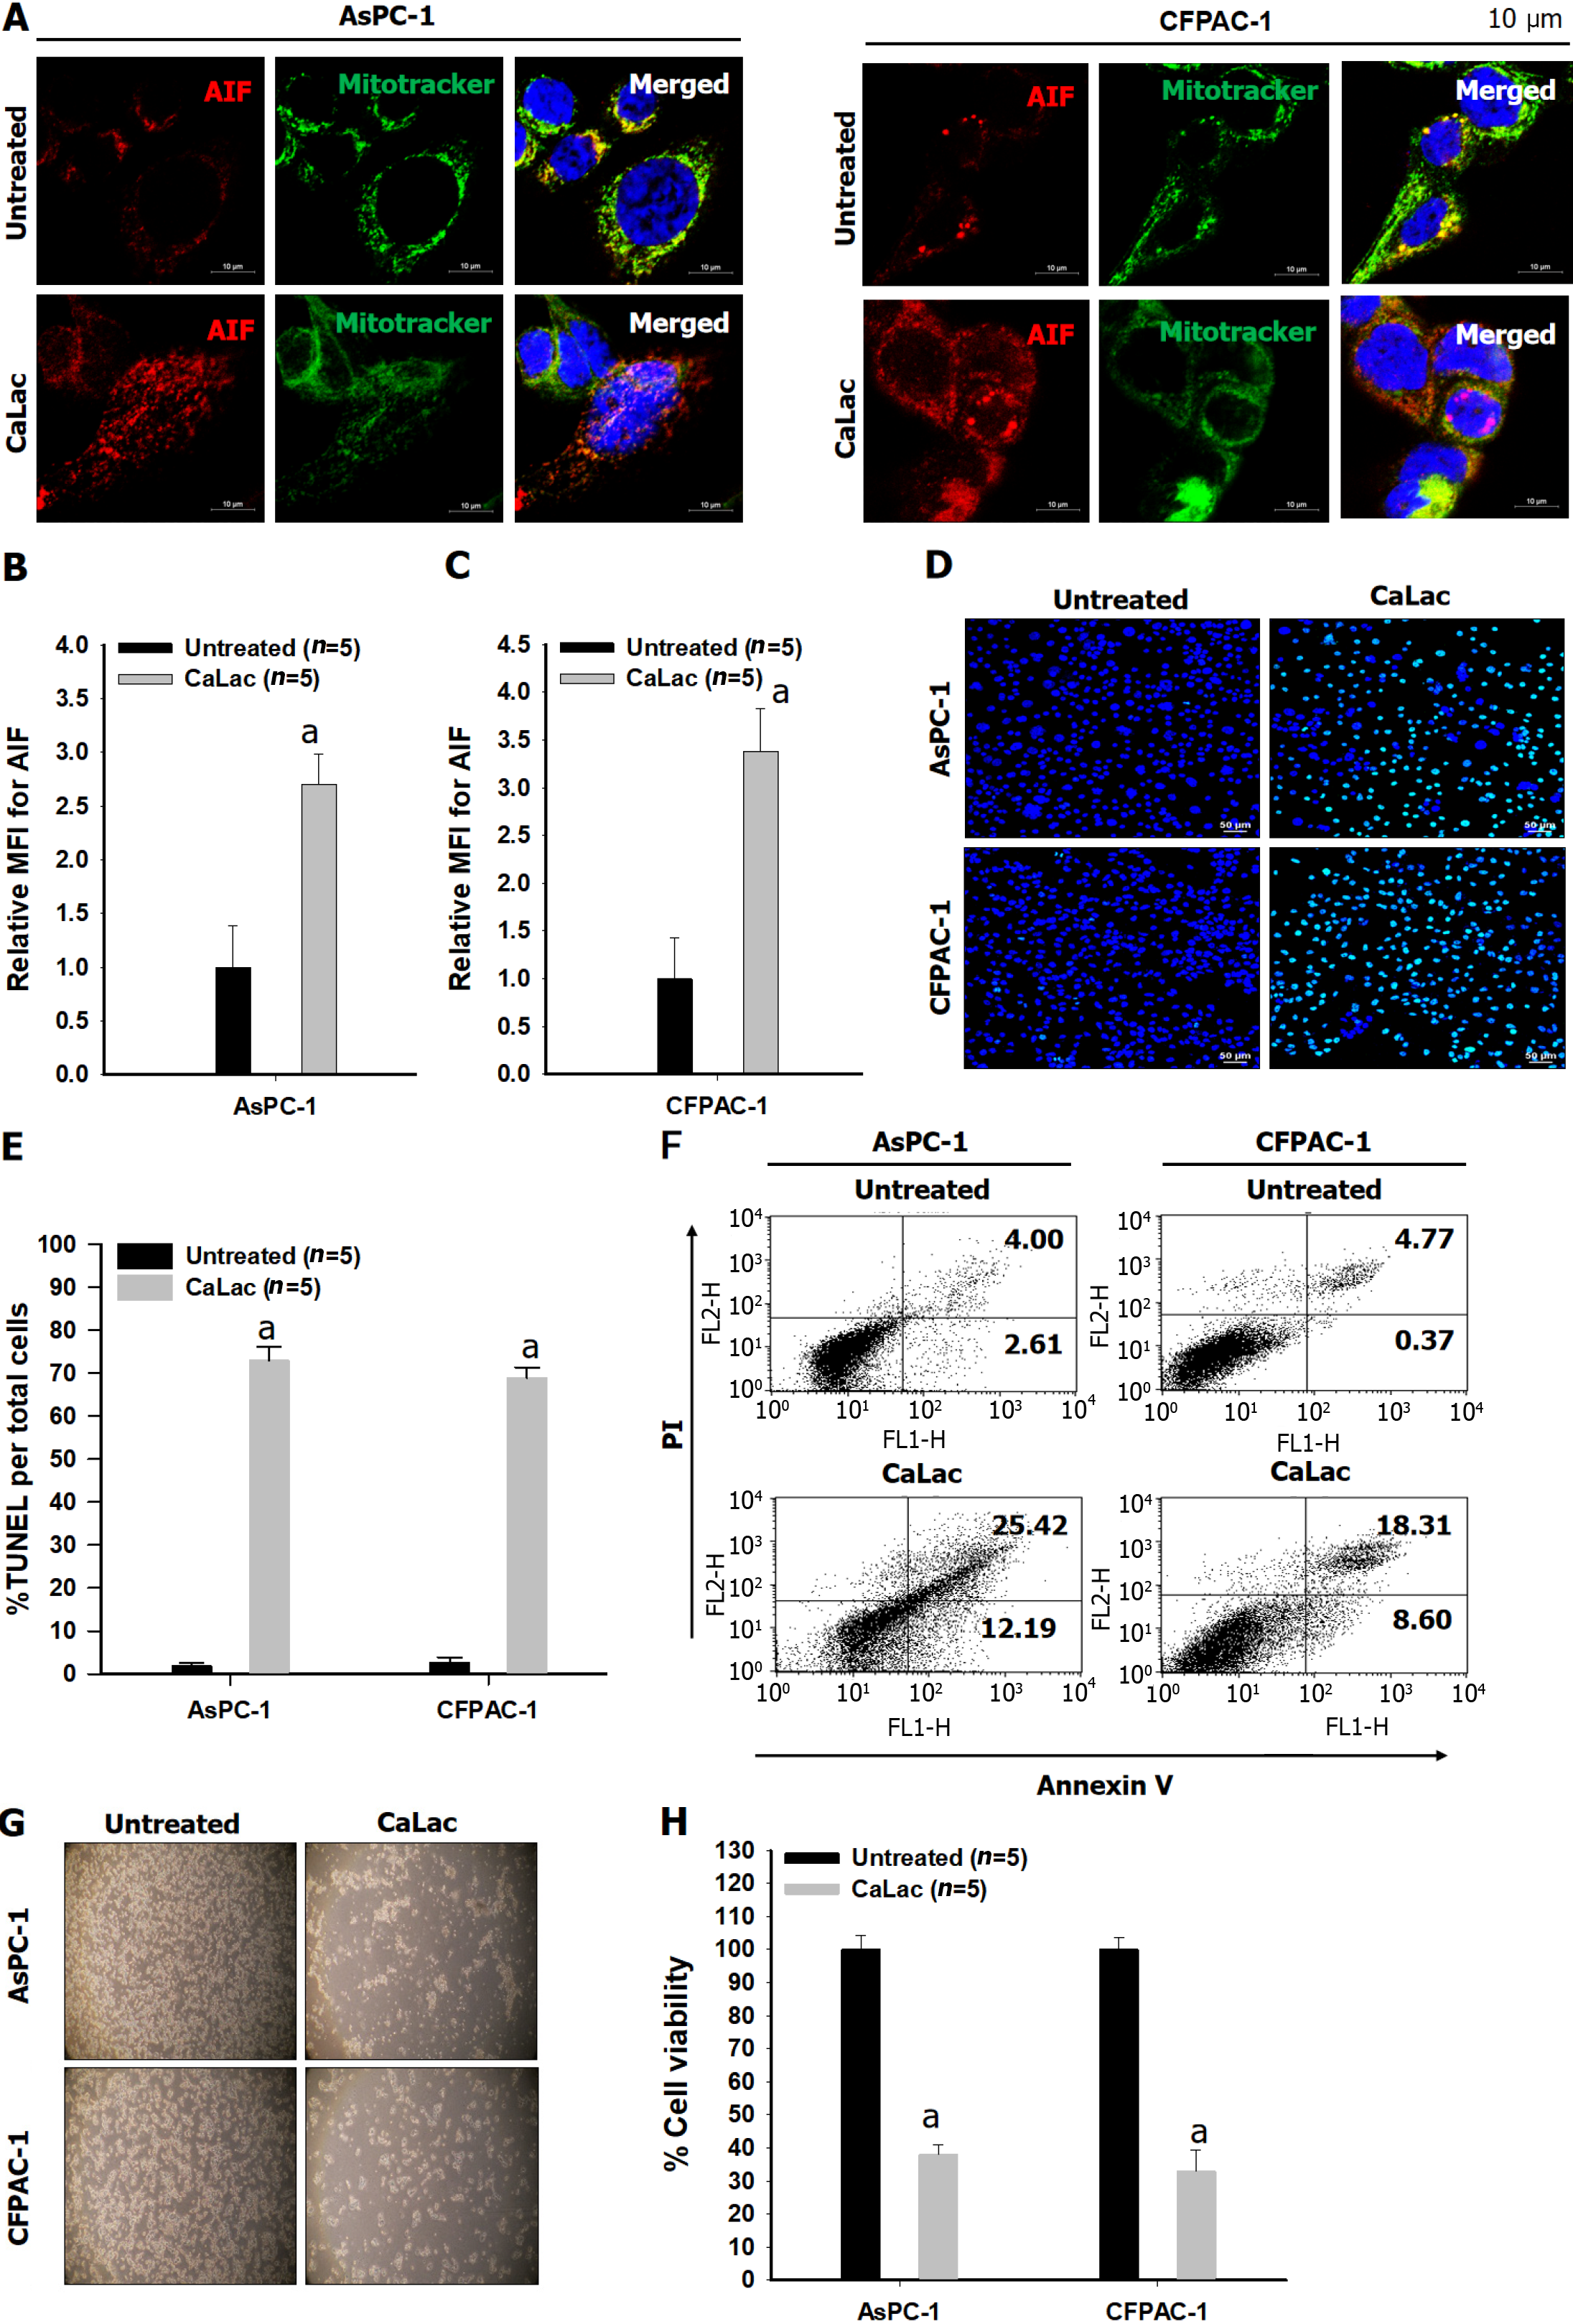
Figure 3 Confirmation of the expression of apoptosis-inducing factor followed by an increase in apoptosis in pancreatic cancer cells (AsPC-1 and CFPAC-1).
A: Immunocytochemical staining for apoptosis-inducing factor (AIF) release from mitochondria and translocation into the nucleus. Red dye: AIF; Green dye: Mitochondrial indicator. Scale bars: 10 μm; B: Quantitative analysis of the mean fluorescence intensity (MFI) of AIF in CFPAC-1; C: Quantitative analysis of the MFI of AIF in AsPC-1; D: Fluorescent microphotographs for colorimetric terminal deoxynucleotidyl transferase -mediated dUTP nick end labeling (TUNEL) detection. Green dye: TUNEL staining. Scale bars: 50 μm; E: Quantitative analysis of the % ratio of TUNEL detected cells per total pancreatic cancer cells; F: Representative flow cytometry plots using Annexin V-fluorescein-5-isothiocyanate/propidium iodide staining for apoptosis; G: Representative microphotographs to compare cell condition after calcium supply; H: Quantitative analysis of the percent cell viability following calcium supply. The cells were treated with 2.5 mM lactate calcium salt for 72 h. Results represent the mean ± SD. aP < 0.001 vs untreated. CaLac: Lactate calcium salt; AIF: Apoptosis-inducing factor; MFI: Mean fluorescence intensity; TUNEL: Transferase-mediated dUTP nick end labeling.
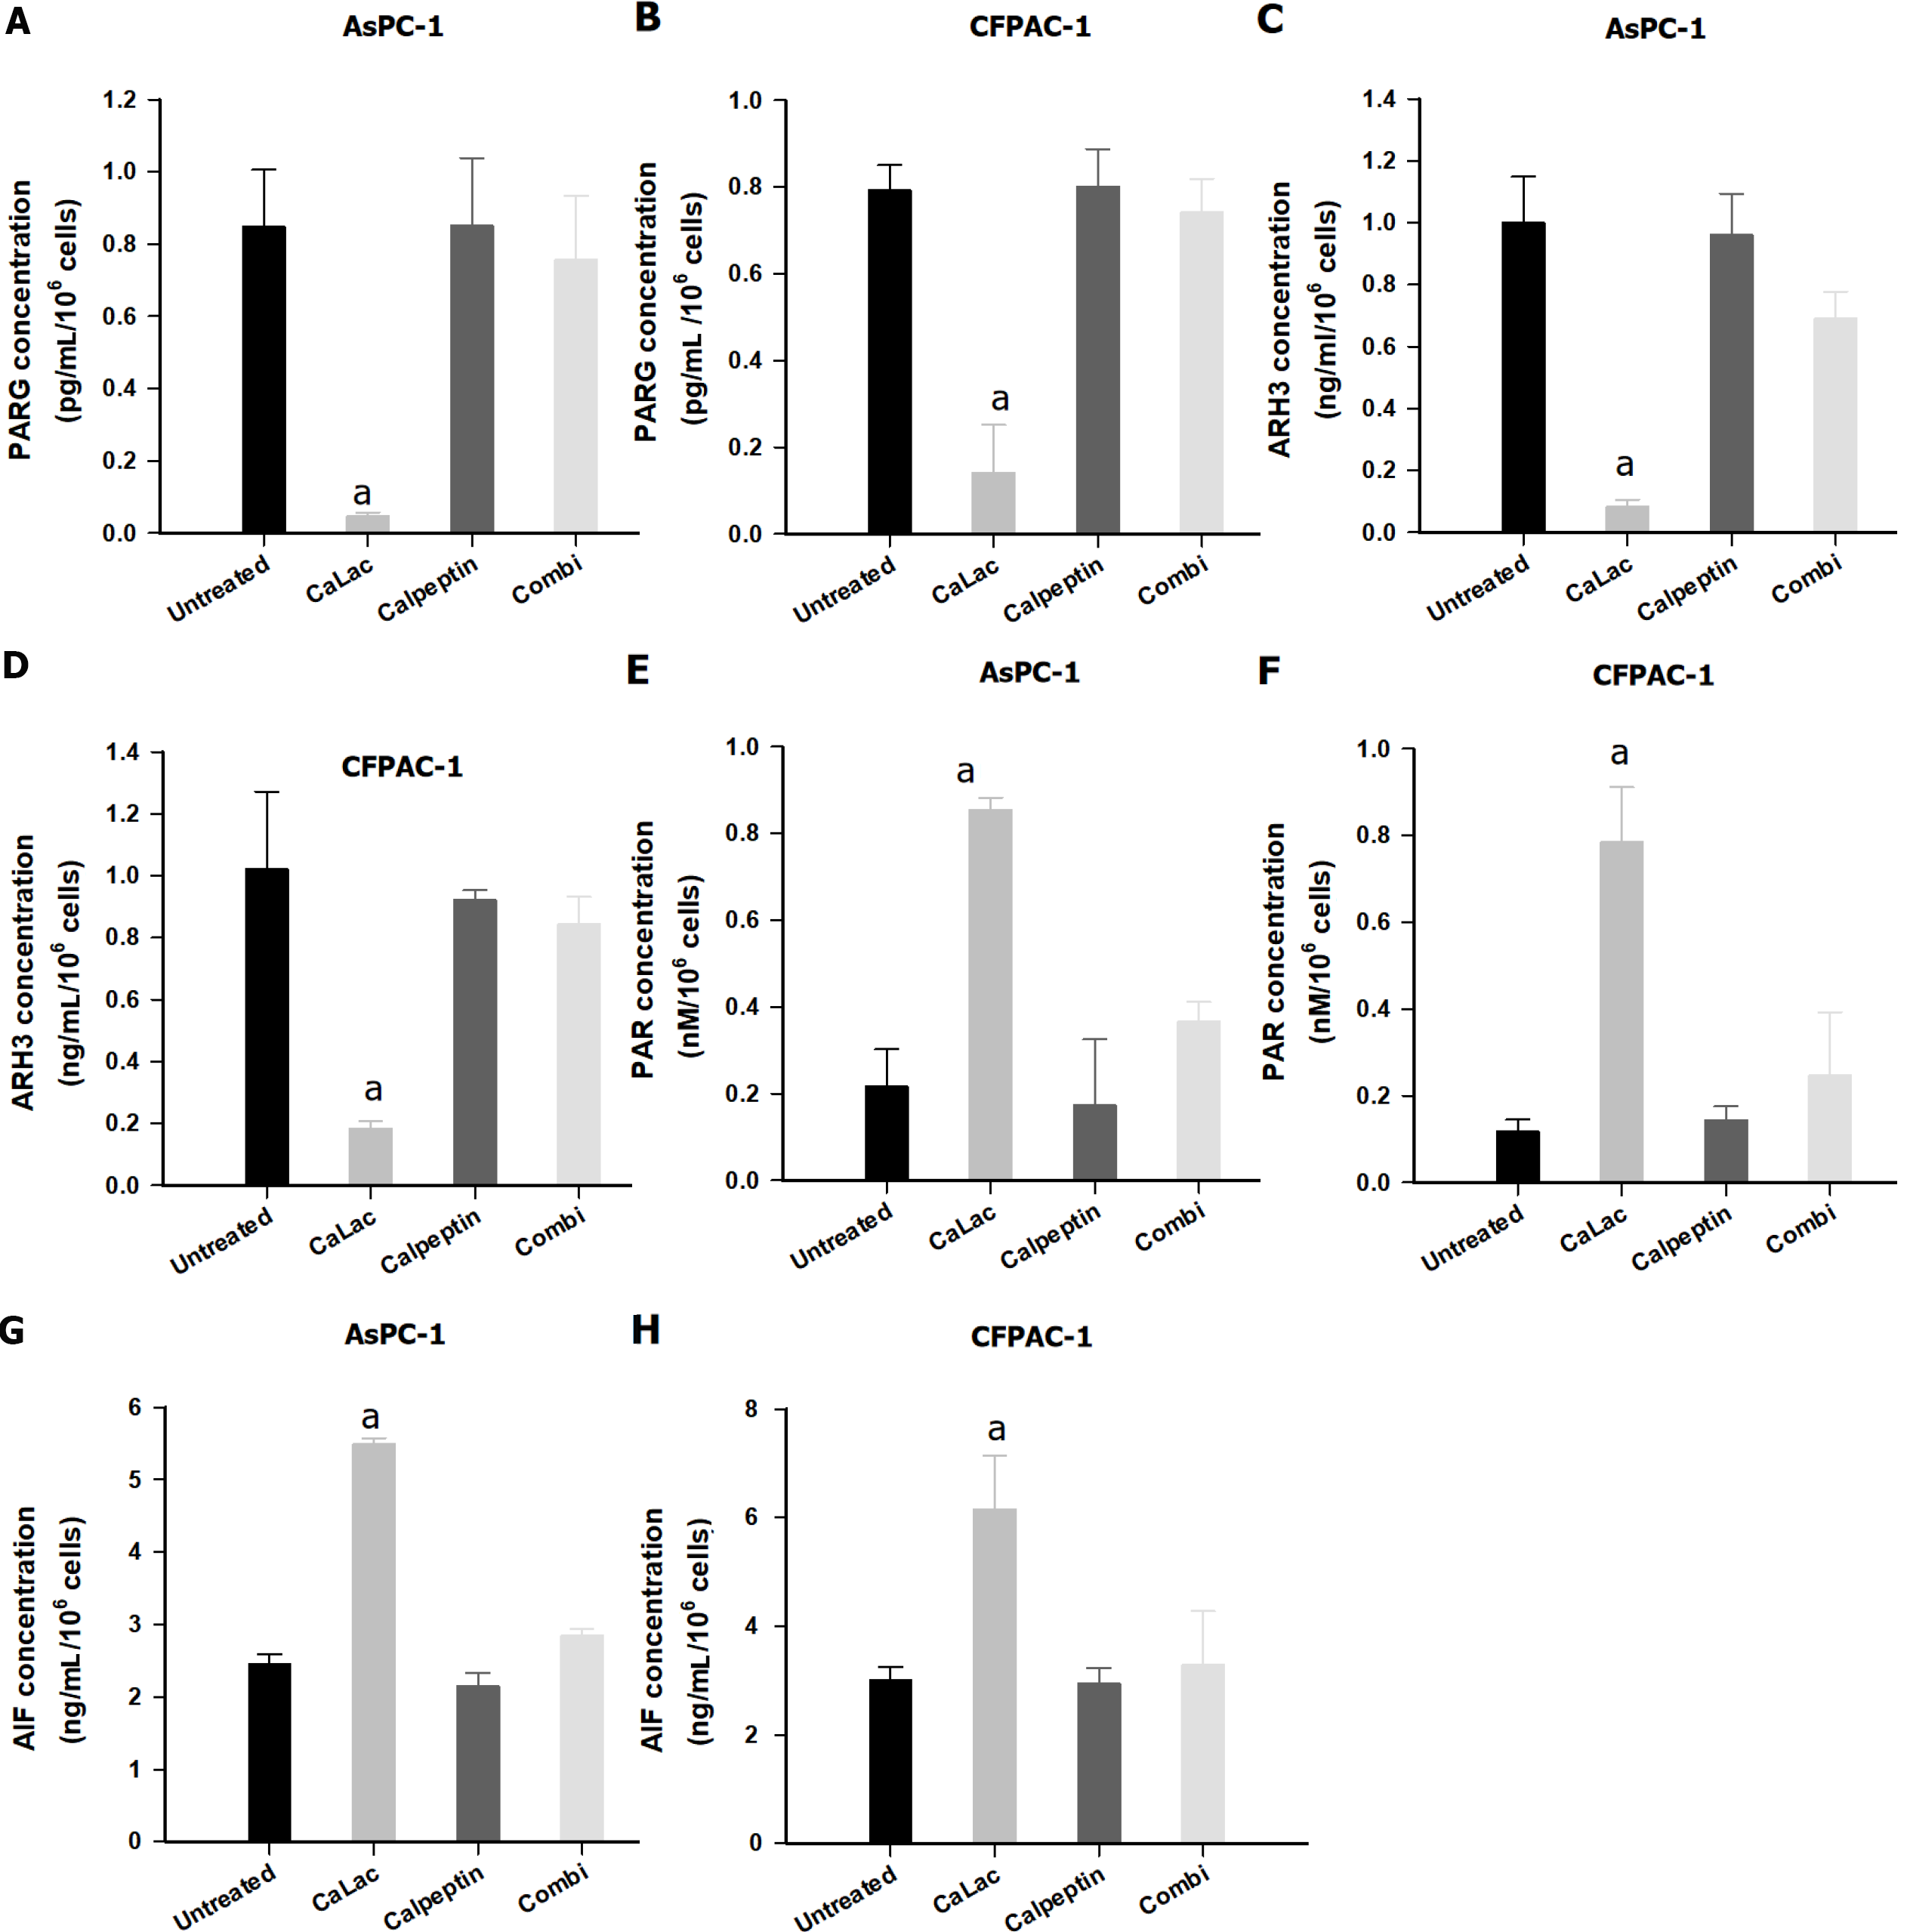
Figure 4 Confirmation of poly-adenosine diphosphate ribose accumulation in pancreatic cancer cells (AsPC-1 and CFPAC-1) by calcium-mediated proteasomal activity.
A: Quantitative analysis of poly adenosine diphosphate-ribose glycohydrolase (PARG) levels in AsPC-1; B: Quantitative analysis of PARG levels in CFPAC-1; C: Quantitative analysis of ADP-ribosyl hydrolase 3 (ARH3) levels in AsPC-1; D: Quantitative analysis of ARH3 levels in CFPAC-1; E: Quantitative analysis of PAR levels in AsPC-1; F: Quantitative analysis of PAR levels in CFPAC-1; G: Quantitative analysis of apoptosis-inducing factor (AIF) levels in AsPC-1; H: Quantitative analysis of AIF levels in CFPAC-1. Calpeptin was used for proteasome inhibition. The cells were treated with 2.5 mM lactate calcium salt for 72 h. Results represent the mean ± SD. aP < 0.001 vs untreated. CaLac: Lactate calcium salt; PARG: Poly adenosine diphosphate-ribose glycohydrolase; ARH3: Adenosine diphosphate-ribosyl hydrolase 3; AIF: Apoptosis-inducing factor.
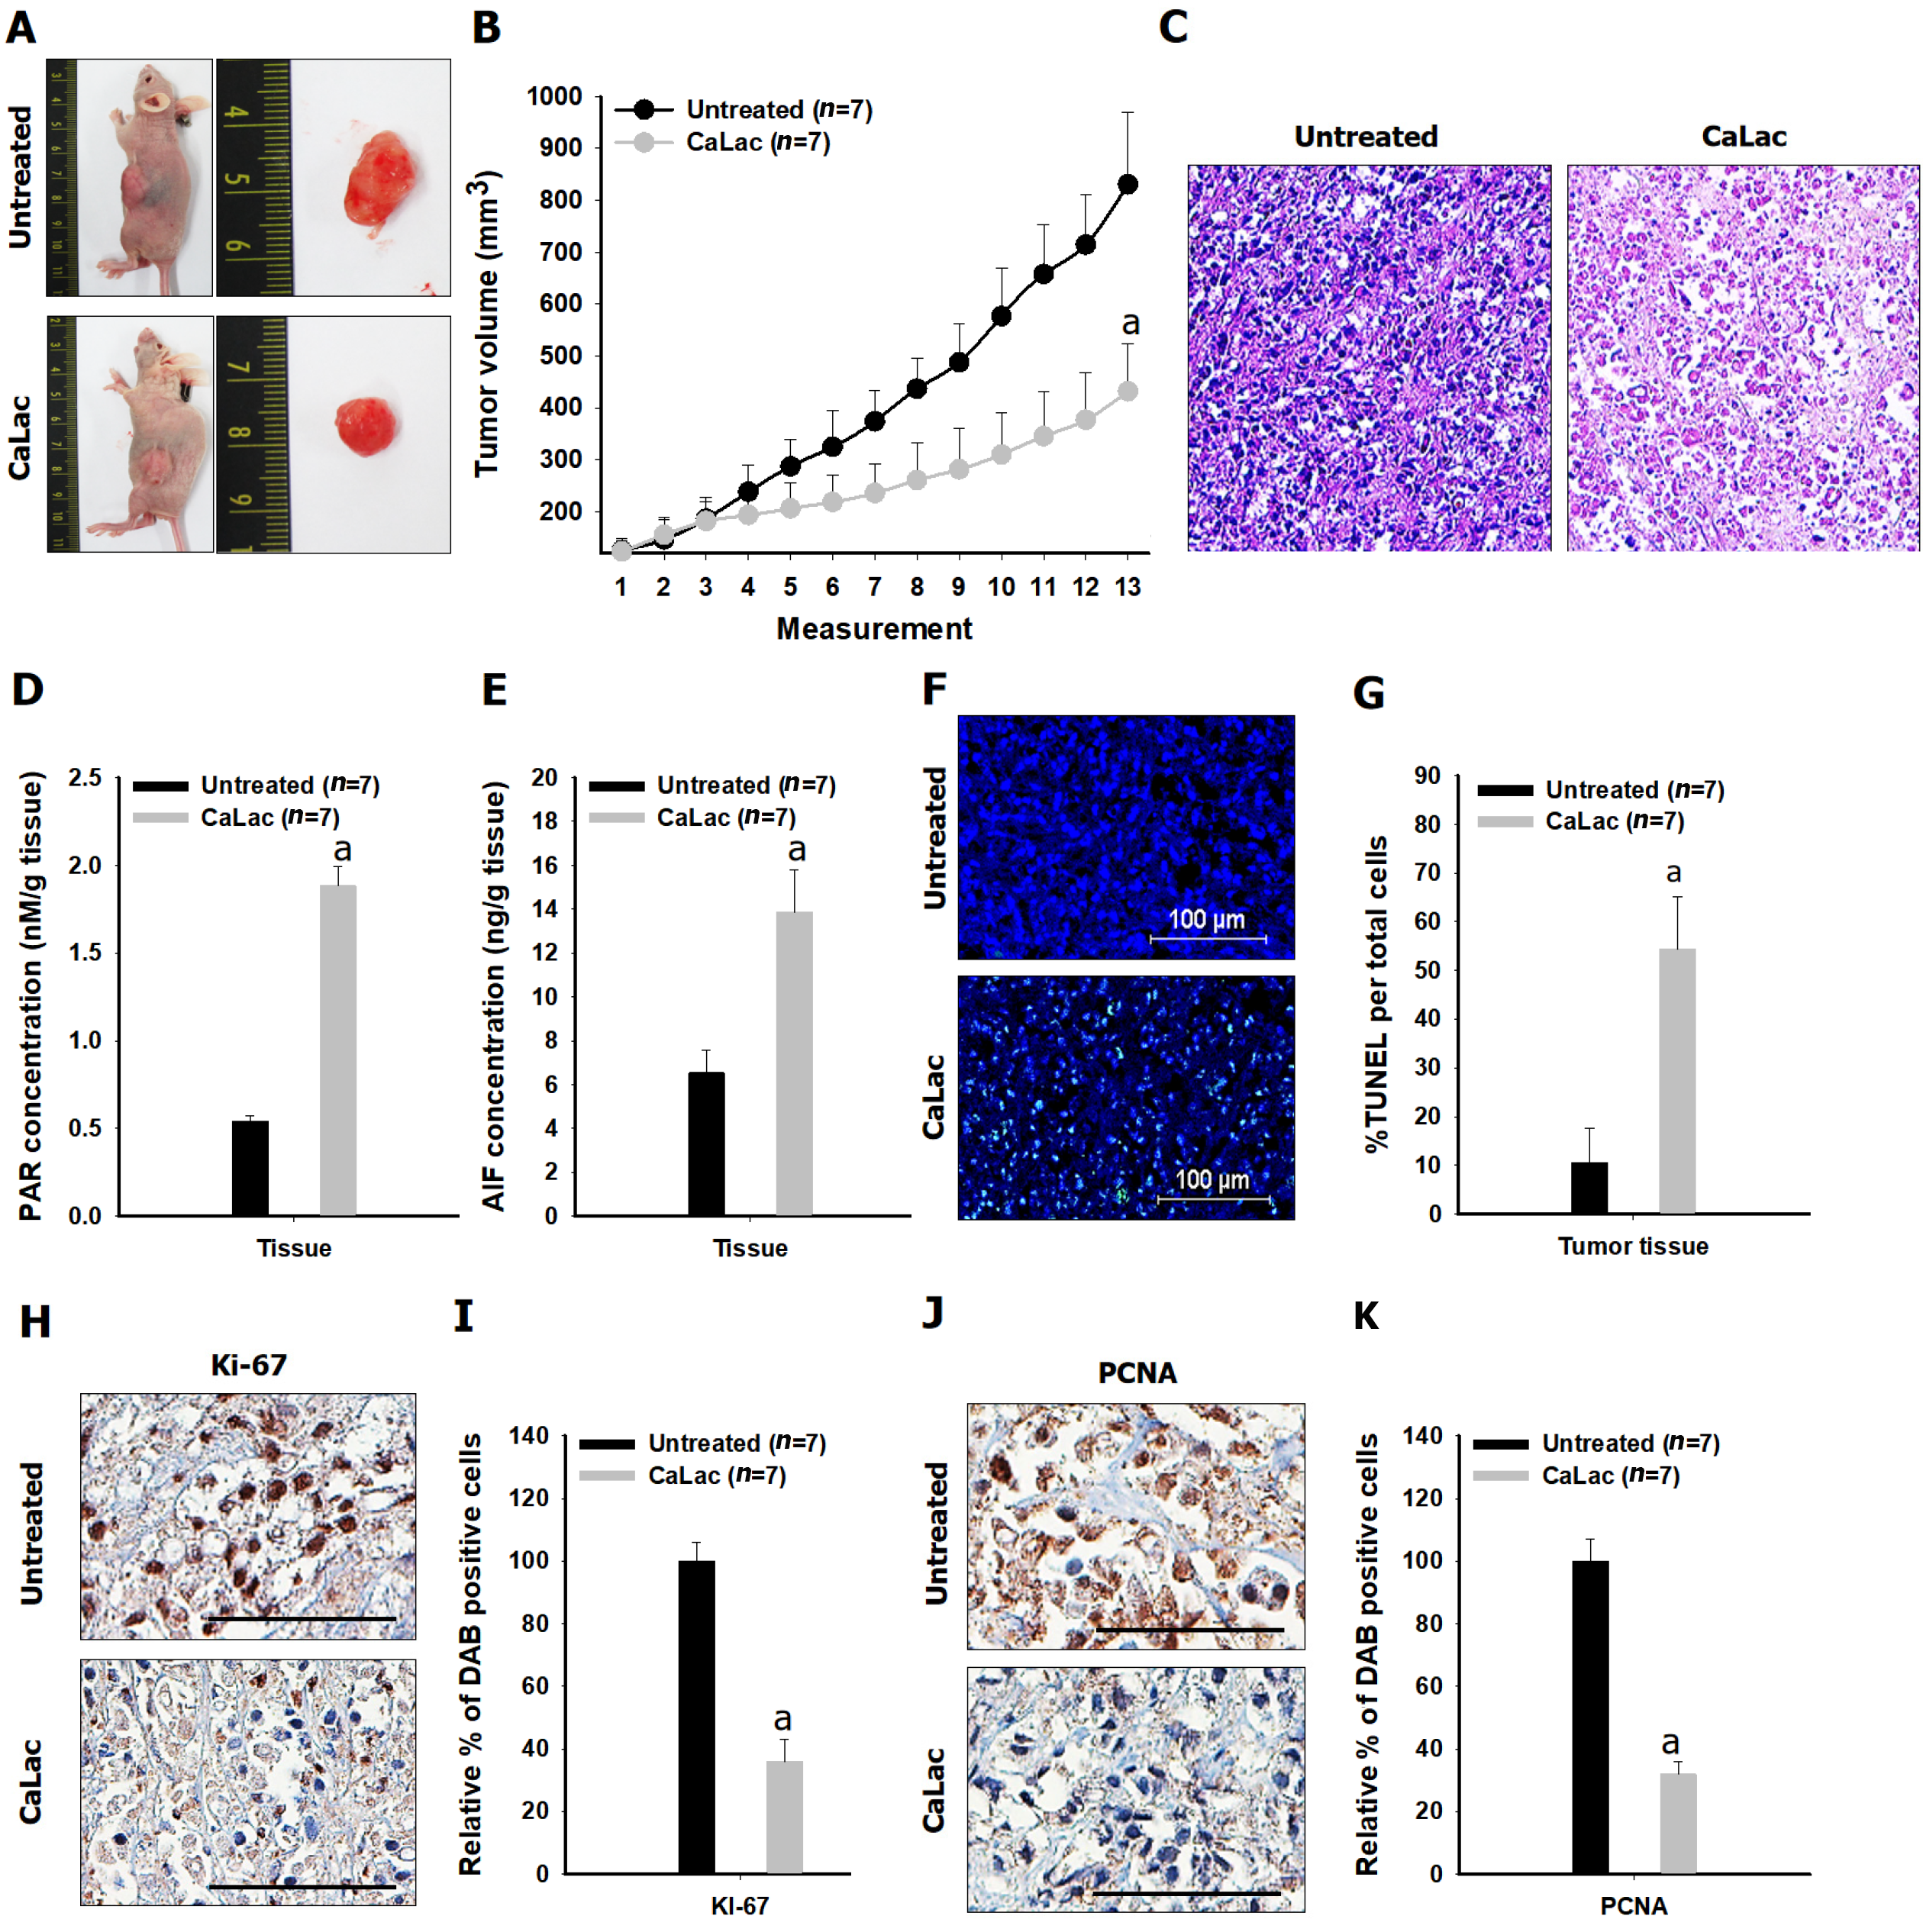
Figure 5 Confirmation of the in vivo antitumor effect on pancreatic cancer following sustained calcium administration.
A: Macroscopic observation of the tumor mass; B: Comparison of tumor volume between the untreated and calcium-administered groups. Lactate calcium salt (CaLac): 20 mg/kg/mouse, subcutaneous injection, daily for 21 d; C: Hematoxylin and eosin staining. Scale bars: 100 μm; D: Comparison of poly adenosine diphosphate ribose expression in tumor tissues; E: Comparison of apoptosis-inducing factor expression in tumor tissues; F and G: % terminal deoxynucleotidyl transferase-mediated dUTP nick end labeling expression to compare increased apoptosis in tumor tissues. Scale bars: 100 μm; H and I: Comparison of Ki-67 expression in tumor tissues. Scale bars: 50 μm; J and K: Comparison of proliferating cell nuclear antigen in tumor tissues. Scale bars: 50 μm. aP < 0.001 vs untreated. Results are the mean ± SD. PAR: Poly adenosine diphosphate ribose; AIF: Apoptosis-inducing factor; TUNEL: Transferase-mediated dUTP nick end labeling; PCNA: Proliferating cell nuclear antigen; CaLac: Lactate calcium salt.
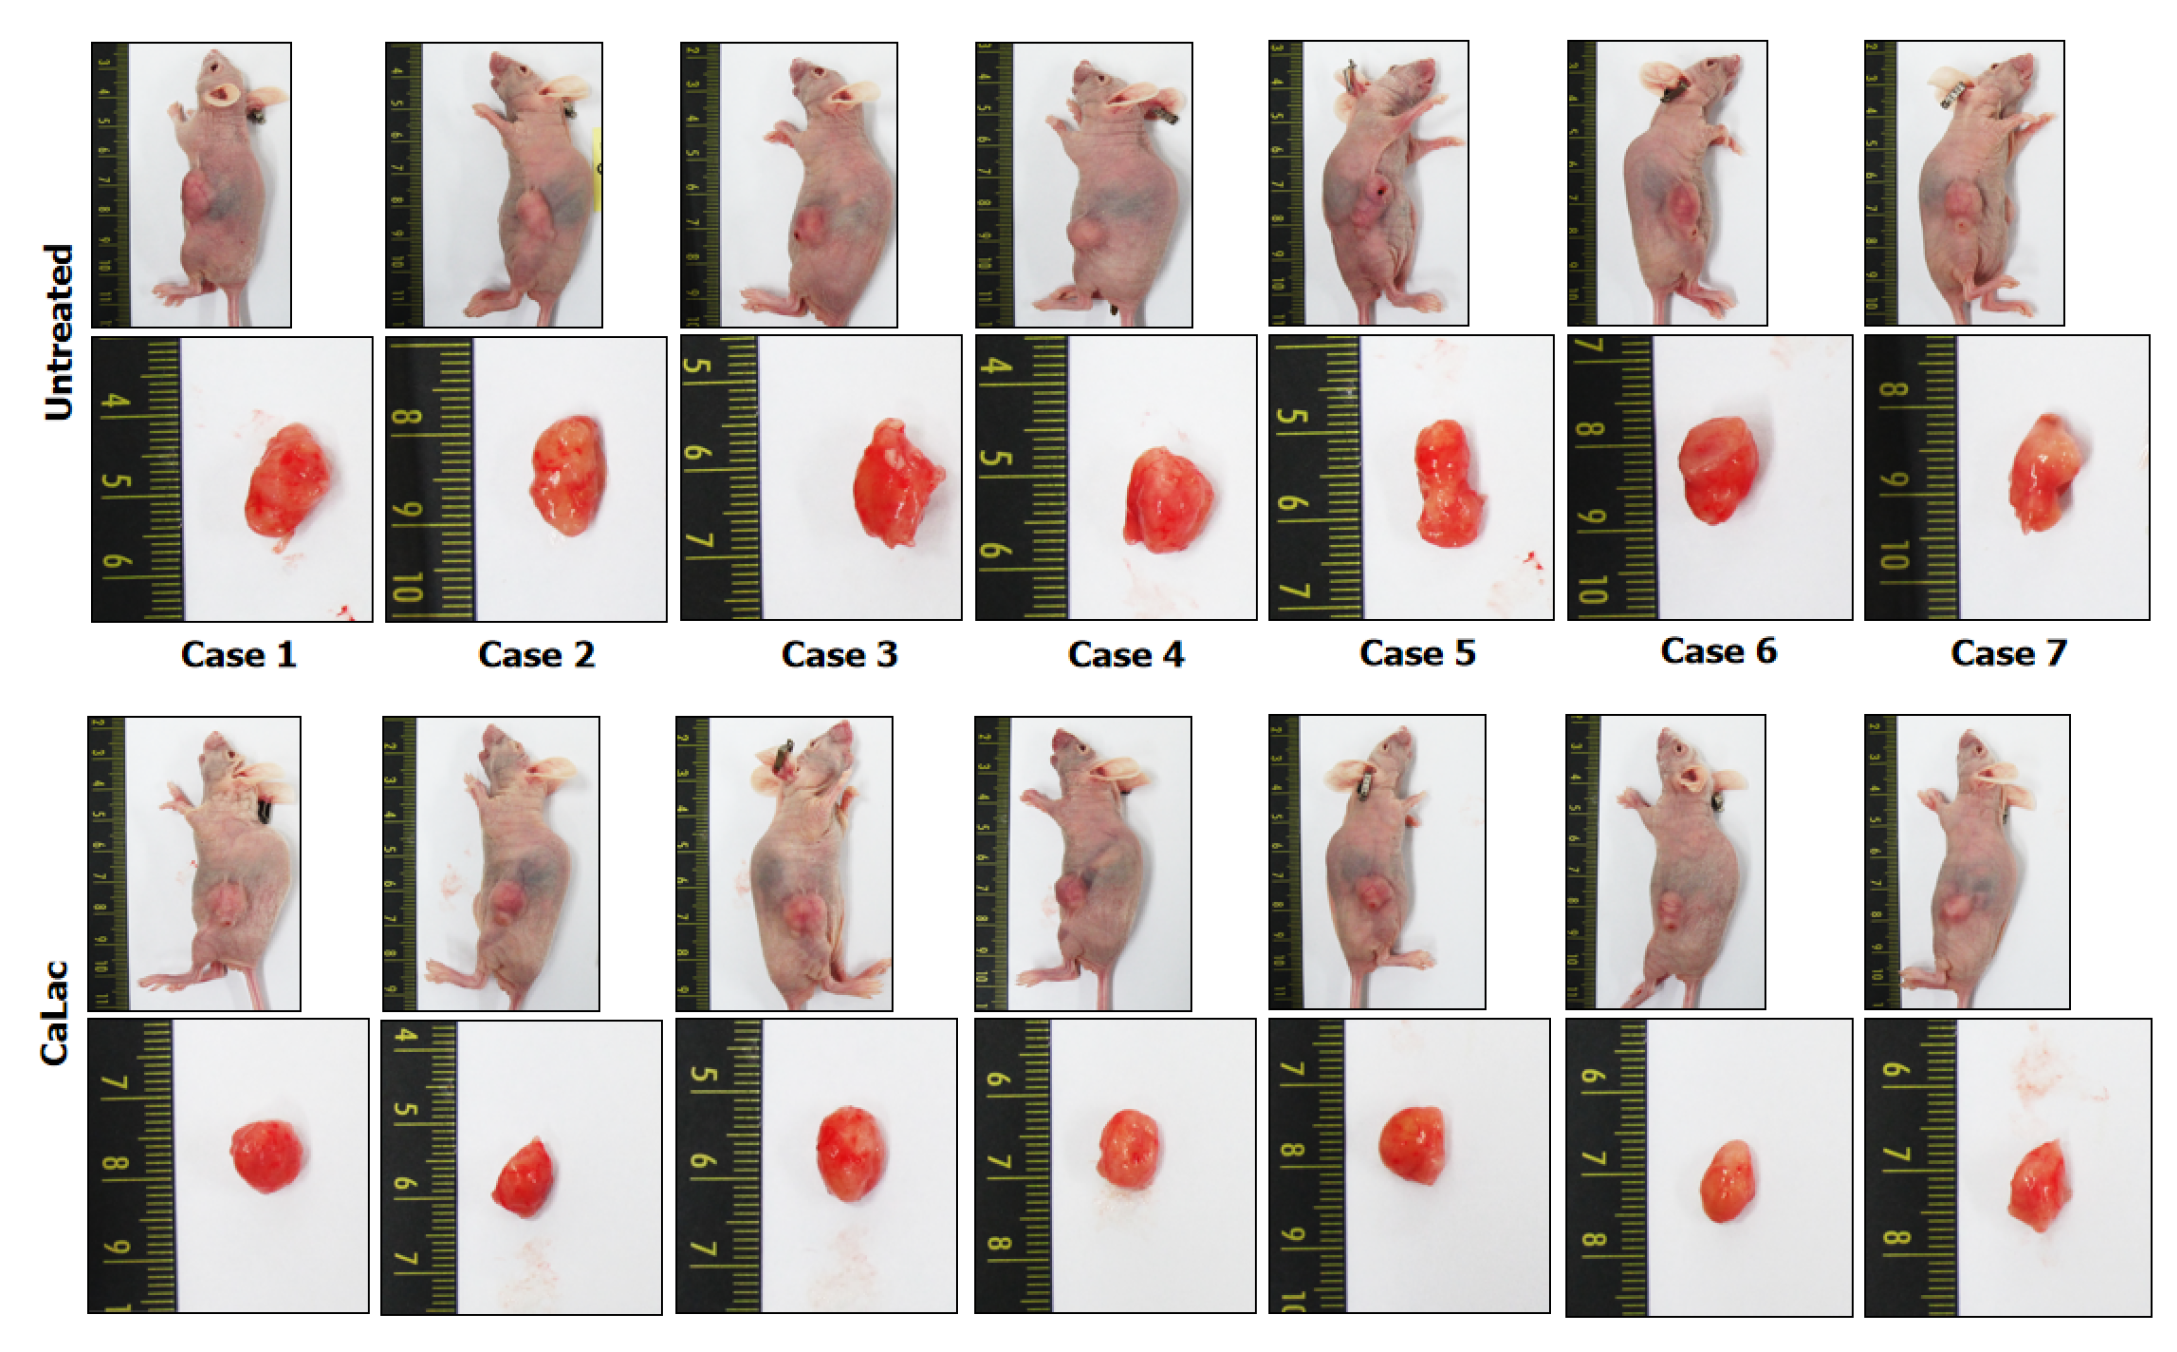
Figure 6 Tumor pictures of all xenograft mice following the end of 20 mg/kg lactate calcium salt administration for 21 d.
CaLac: Lactate calcium salt.
- Citation: Jeong KY, Sim JJ, Park M, Kim HM. Accumulation of poly (adenosine diphosphate-ribose) by sustained supply of calcium inducing mitochondrial stress in pancreatic cancer cells. World J Gastroenterol 2022; 28(27): 3422-3434
- URL: https://www.wjgnet.com/1007-9327/full/v28/i27/3422.htm
- DOI: https://dx.doi.org/10.3748/wjg.v28.i27.3422


