Copyright
©The Author(s) 2022.
World J Gastroenterol. Jul 14, 2022; 28(26): 3218-3231
Published online Jul 14, 2022. doi: 10.3748/wjg.v28.i26.3218
Published online Jul 14, 2022. doi: 10.3748/wjg.v28.i26.3218
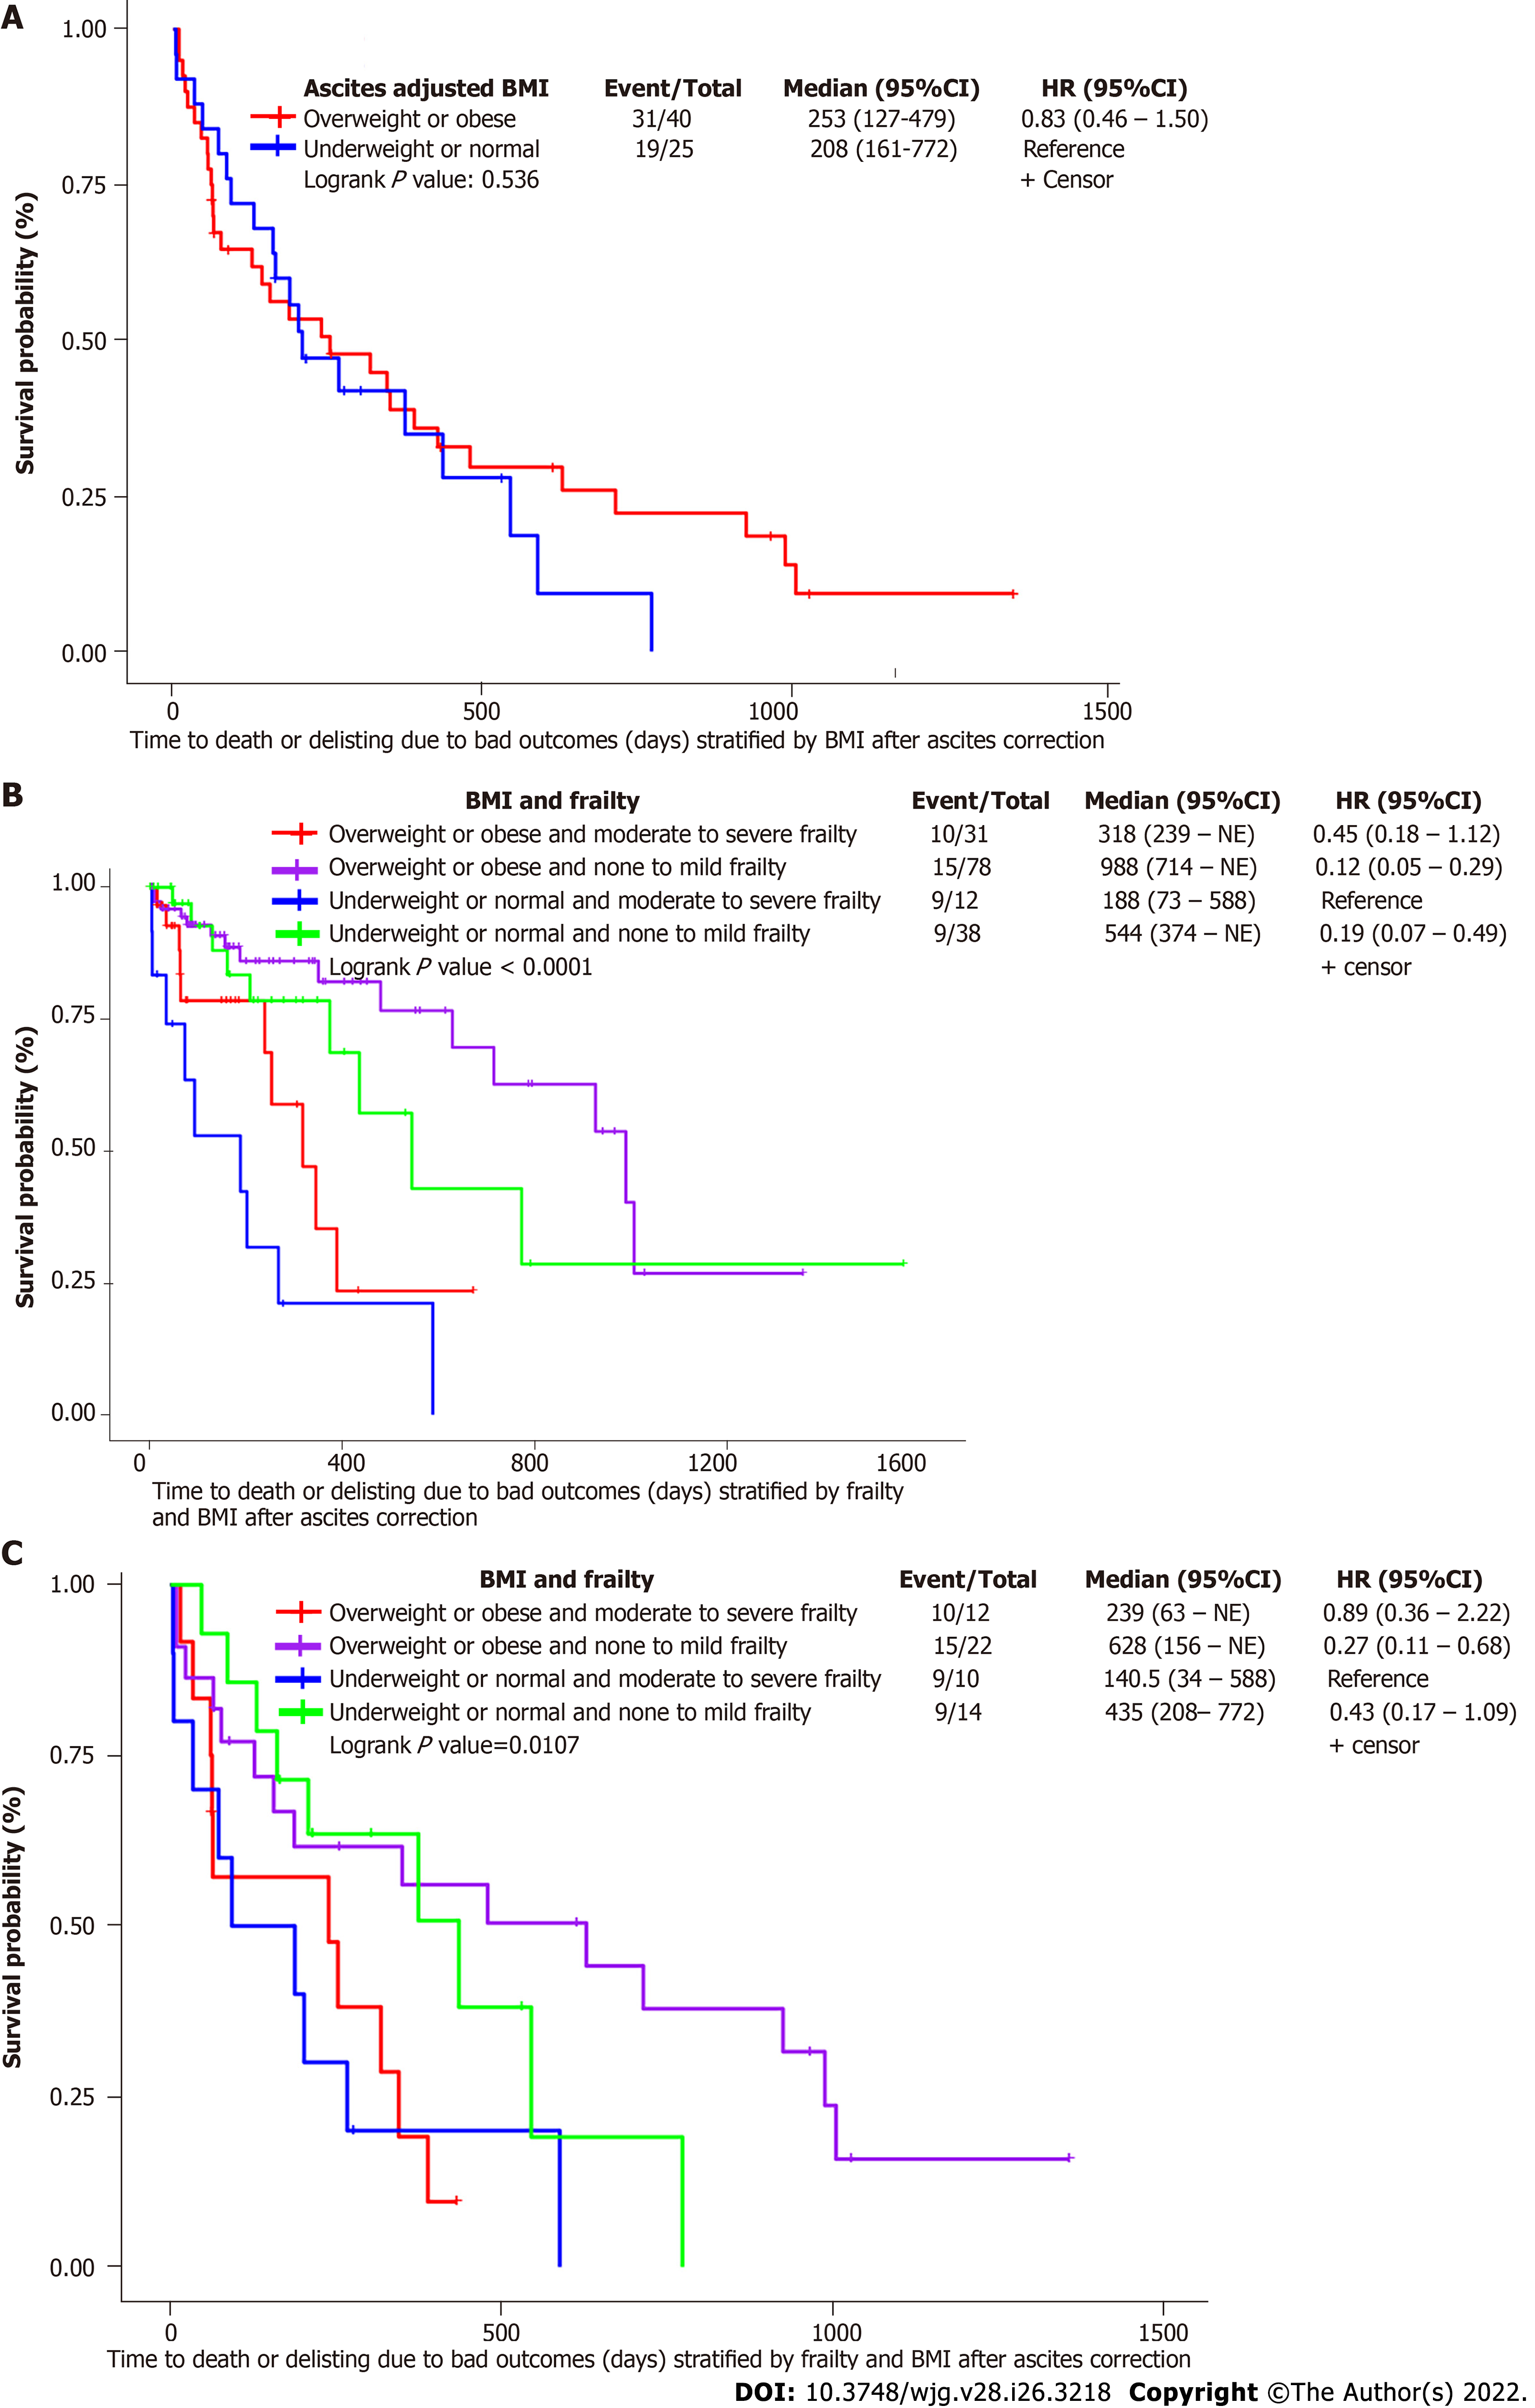
Figure 1 Kaplan-Meier–overall survival: Time to delisting or death on waitlist.
A: Ascites adjusted body mass index (BMI) groups (non-transplanted patients only); B: Ascites adjusted BMI and frailty (full cohort); C: Ascites adjusted BMI and frailty (non-transplanted patients only). HR: Hazard ratio; BMI: Body mass index.
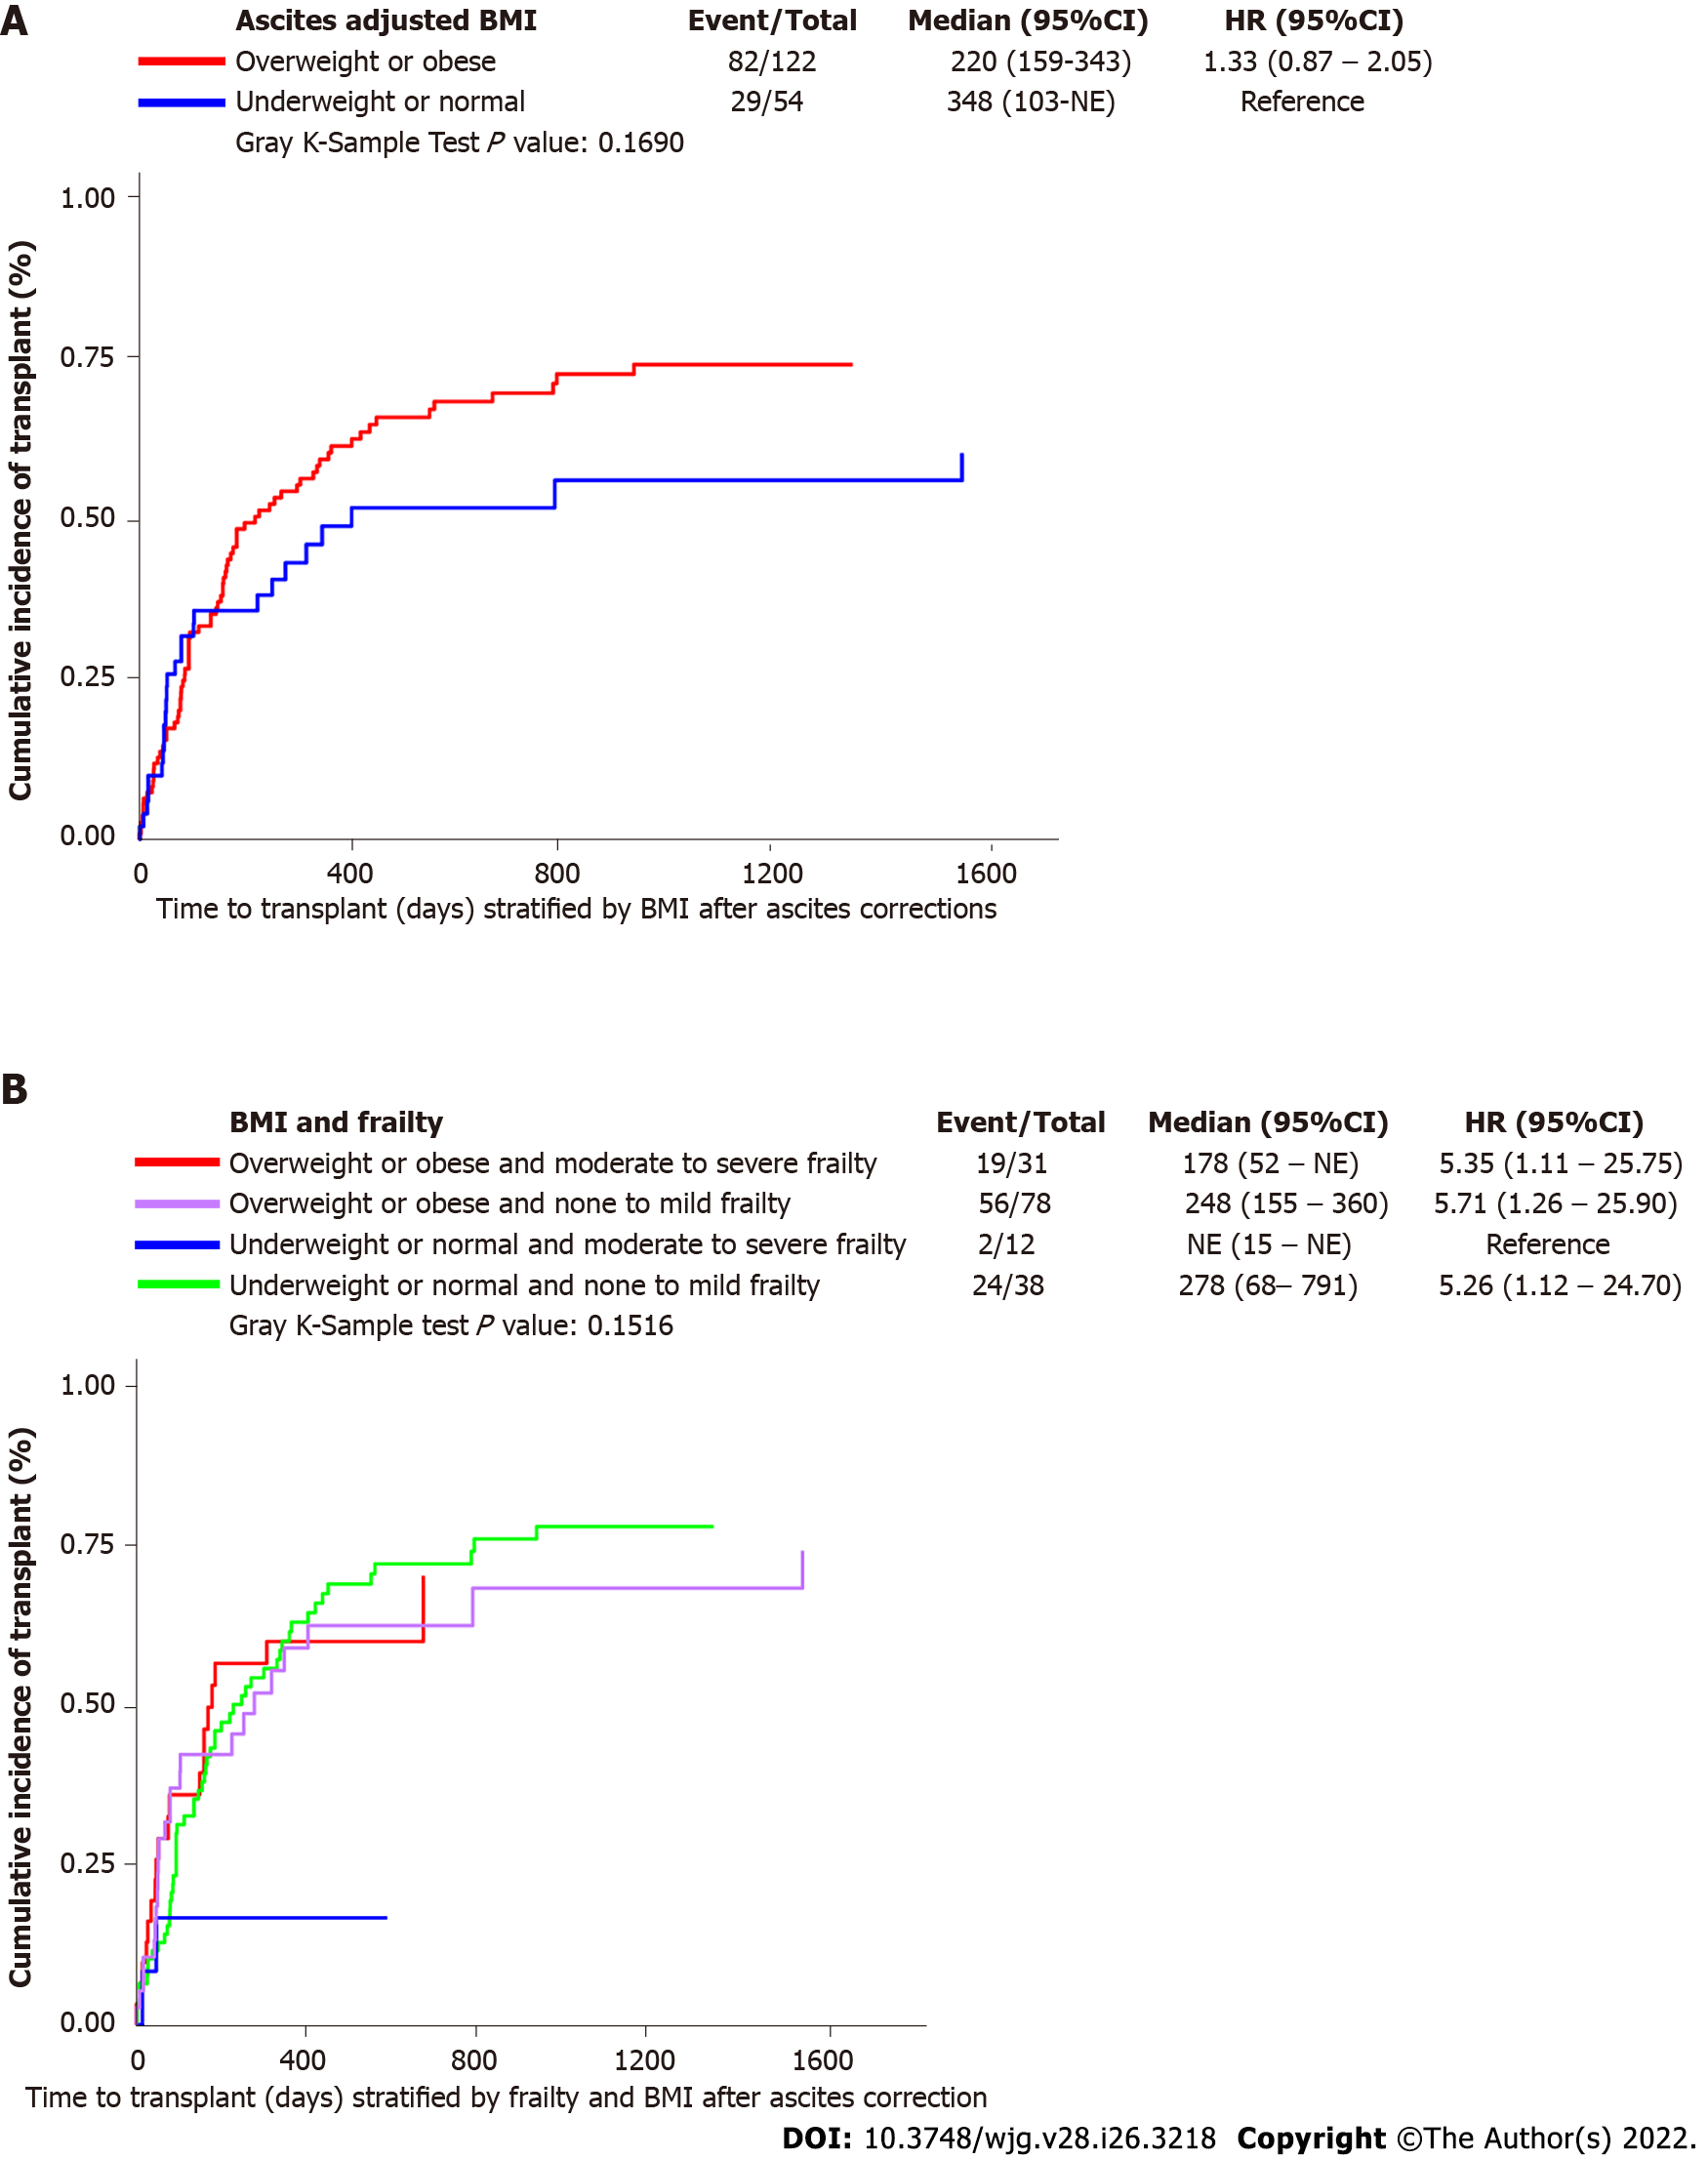
Figure 2 Competing risk analysis for time to transplant.
A: Ascites adjusted body mass index (BMI) groups; B: Ascites adjusted BMI and frailty. HR: Hazard ratio; BMI: Body mass index.
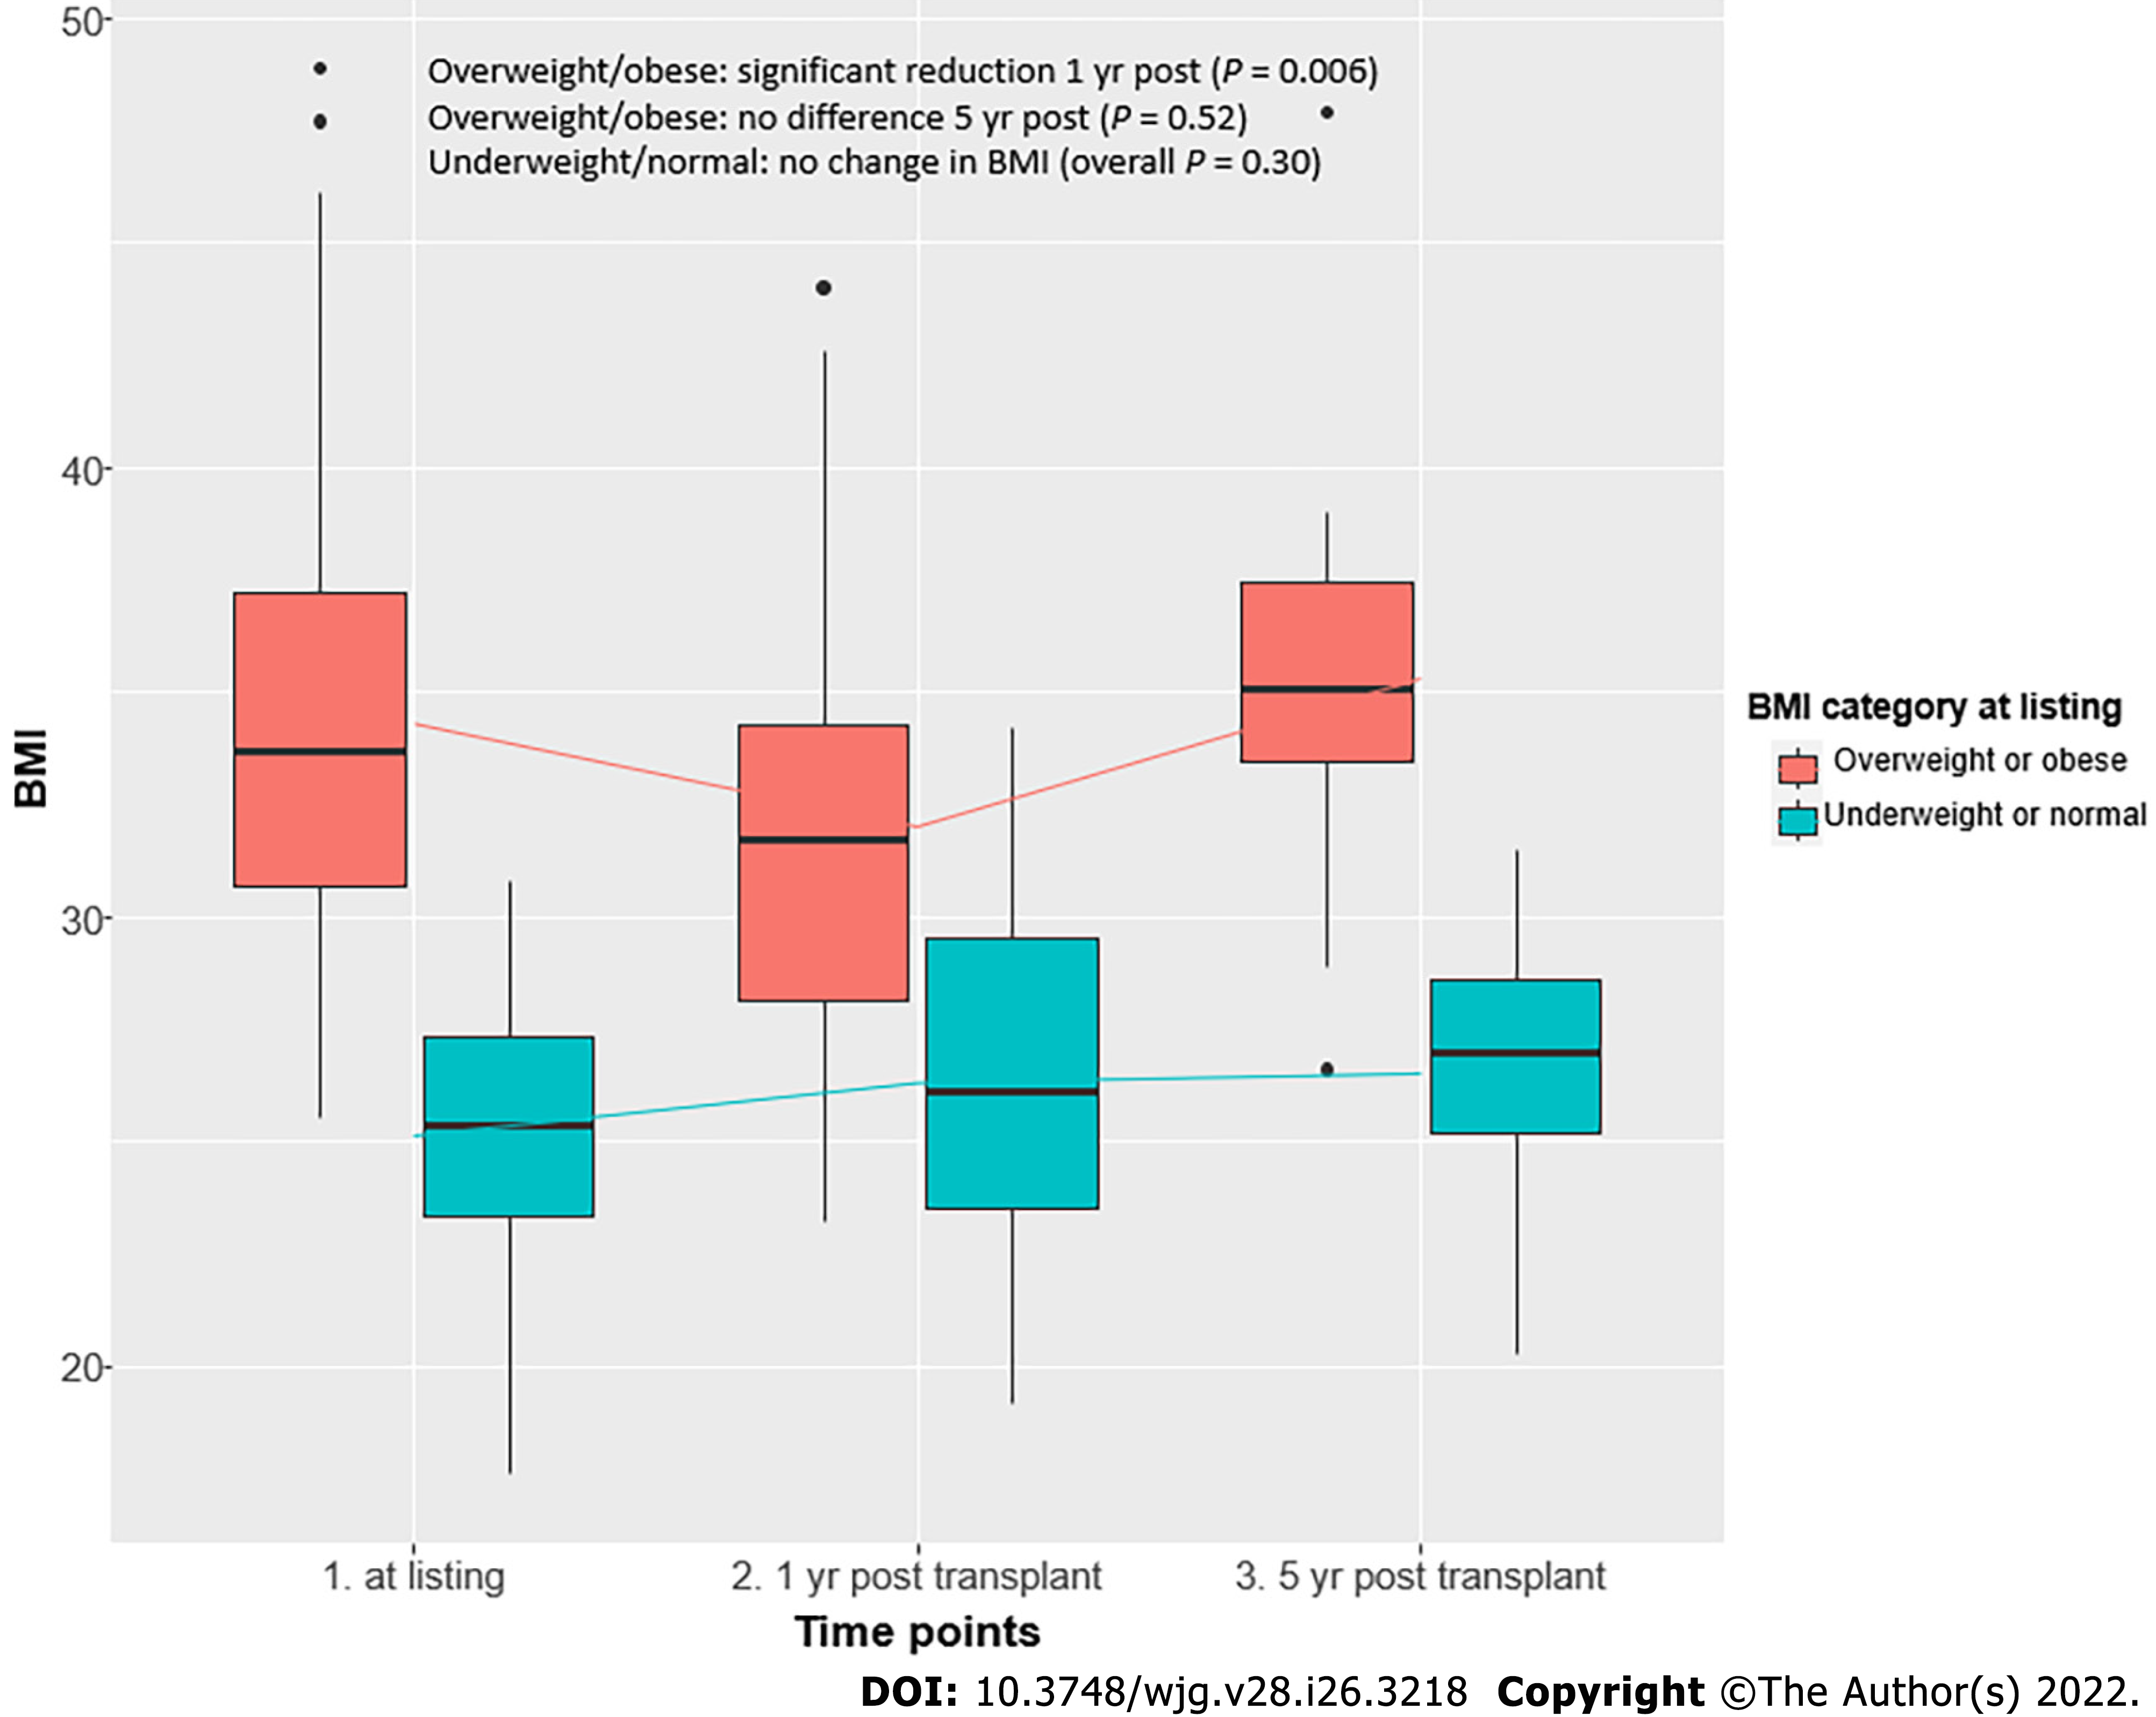
Figure 3 Change in body mass index from time of listing to post liver transplant at 1 and 5 yr.
BMI: Body mass index.
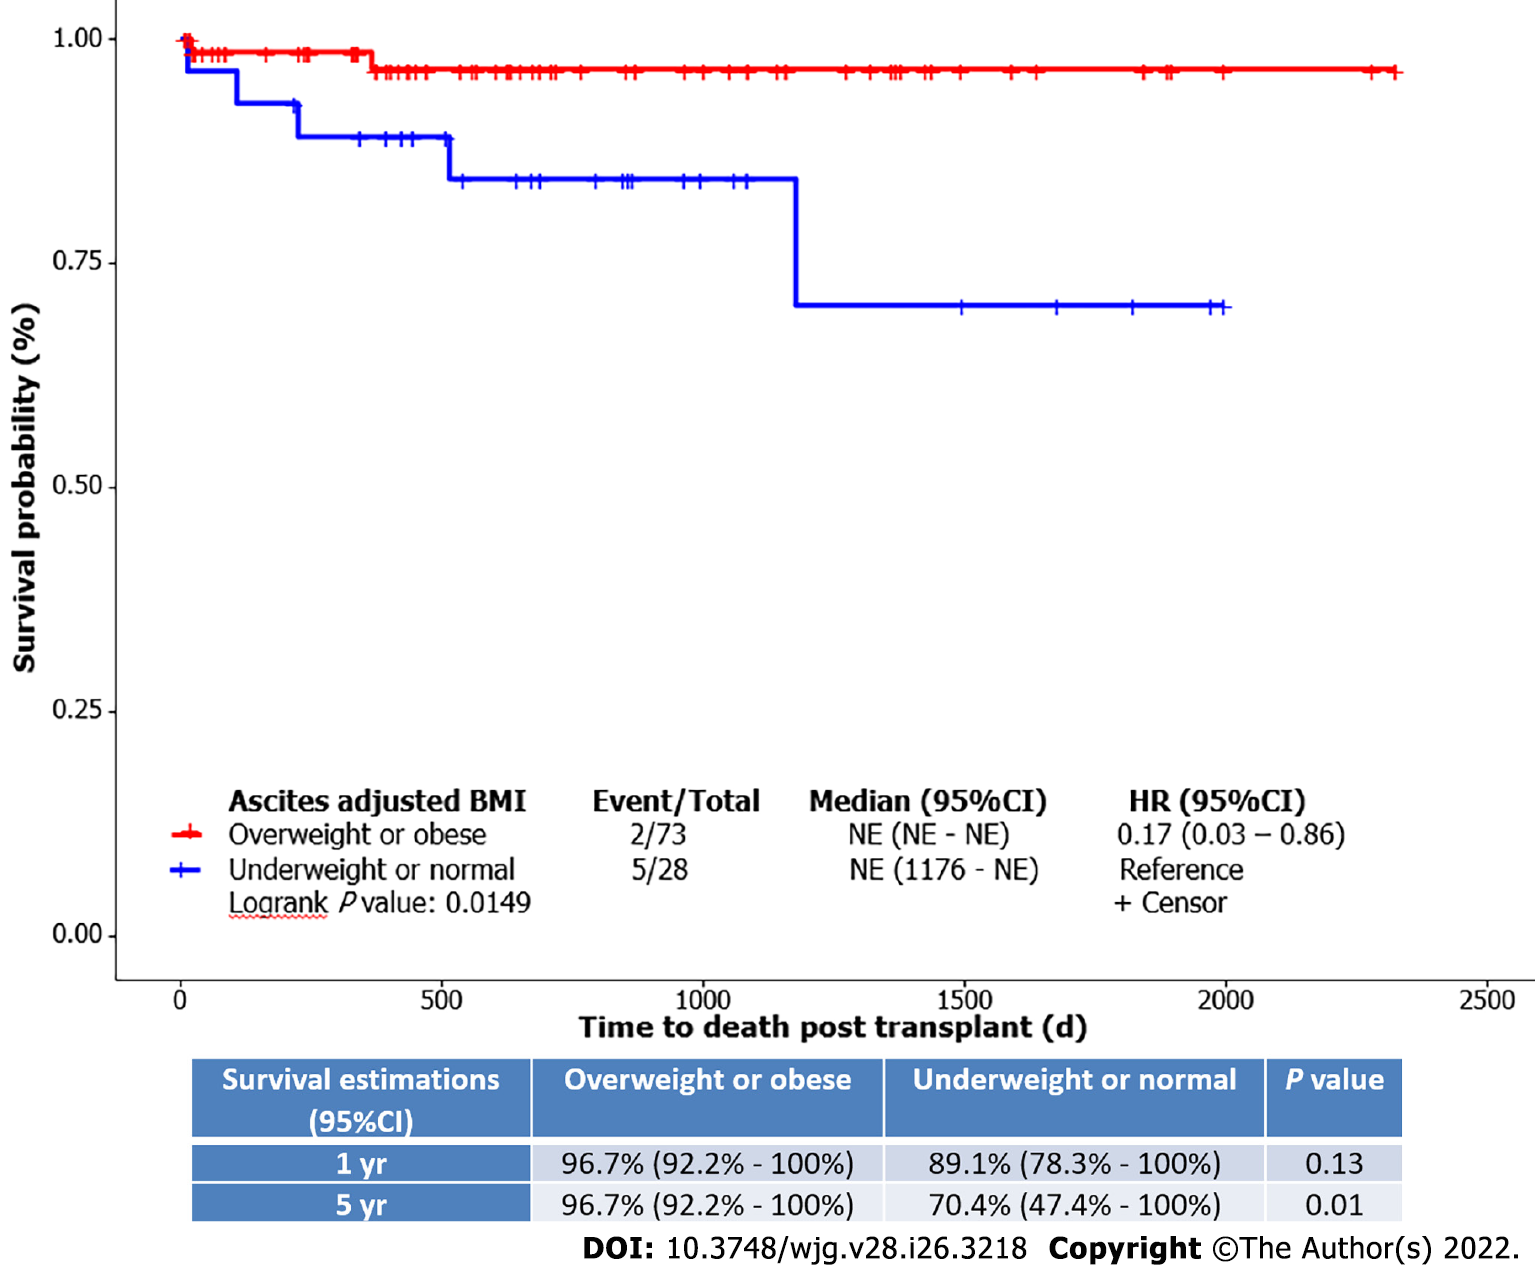
Figure 4 Kaplan-Meier–overall survival: Time to death post liver transplant stratified by ascites adjusted body mass index groups.
Lower panel shows the 1- and 5-yr survival estimates. HR: Hazard ratio; BMI: Body mass index.
- Citation: Qazi-Arisar FA, Uchila R, Chen C, Yang C, Chen SY, Karnam RS, Azhie A, Xu W, Galvin Z, Selzner N, Lilly L, Bhat M. Divergent trajectories of lean vs obese non-alcoholic steatohepatitis patients from listing to post-transplant: A retrospective cohort study. World J Gastroenterol 2022; 28(26): 3218-3231
- URL: https://www.wjgnet.com/1007-9327/full/v28/i26/3218.htm
- DOI: https://dx.doi.org/10.3748/wjg.v28.i26.3218


